AWS Compute Blog: Recent Episodes
None

This post is written by Julian Wood, Principal Developer Advocate, and Leandro Cavalcante Damascena, Senior Solutions Architect Engineer.
AWS Lambda now supports Python 3.13 as both a managed runtime and container base image. Python is a popular language for building serverless applications. The Python 3.13 release includes a number of changes to the language, the implementation, and the standard library. With this release, Python developers can now take advantage of these new features and enhancements when creating serverless applications on Lambda. Python 3.13 also includes experimental support for a number of features, which are not available in Lambda.
You can develop Lambda functions in Python 3.13 using the AWS Management Console, AWS Command Line Interface (AWS CLI), AWS SDK for Python (Boto3), AWS Serverless Application Model (AWS SAM), AWS Cloud Development Kit (AWS CDK), and other infrastructure as code tools.
The Python 3.13 runtime allows you to implement serverless best practices using Powertools for AWS Lambda (Python). This is a developer toolkit that includes observability, batch processing, AWS Systems Manager Parameter Store integration, idempotency, feature flags, Amazon CloudWatch Metrics, structured logging, and more.
Lambda@Edge allows you to use Python 3.13 to customize low-latency content delivered through Amazon CloudFront.
Lambda runtime changes Amazon Linux 2023 As with the Python 3.12 runtime, the Python 3.13 runtime is based on the provided.al2023 runtime, which is based on the Amazon Linux 2023 minimal container image. The Amazon Linux 2023 minimal image uses microdnf as a package manager, symlinked as dnf. This replaces the yum package manager used in Python 3.11 and earlier AL2-based images. If you deploy your Lambda functions as container images, you must update your Dockerfiles to use dnf instead of yum when upgrading to the Python 3.13 base image from Python 3.11 or earlier base images.
Learn more about the provided.al2023 runtime in the blog post Introducing the Amazon Linux 2023 runtime for AWS Lambda and the Amazon Linux 2023 launch blog post.
New Python features Data model improvements There are improvements to the Python data model. \_\_static\_attributes\_\_ stores the names of attributes accessed through self.X in any function in a class body.
Typing changes With the implementation of PEP 702, you can now use the new warnings.deprecated() decorator to mark deprecations in the type system and at runtime.
Python 3.13 also adds PEP 696, which introduces default values for type parameters. This enhancement allows developers to specify default types for TypeVar, ParamSpec, and TypeVarTuple when omitting type arguments.
Standard library The standard library includes improvements for a new PythonFinalizationError exception, raised when an operation is blocked during finalization.
The new functions base64.z85encode() and base64.z85decode() support encoding and decoding Z85 data.
The copy module now has a copy.replace() function, with support for many built-in types and any class defining the __replace__() method.
The os module has a suite of new functions for working with Linux’s timer notification file descriptors.
There is a change to the defined mutation semantics for locals().
Experimental features that are unavailable Python 3.13 includes a number of experimental features which are not enabled for the Lambda managed runtime or base images. These features must be enabled when the Python runtime is compiled. Since the Lambda-provided Python 3.13 runtime is intended for production workloads, these features are not enabled in the Lambda build of Python 3.13 and cannot be enabled via an execution-time flag. To use these features in Lambda, you can deploy your own Python runtime using a custom runtime or container image with these features enabled.
Free-threaded CPython You can not enable the experimental support for running Python in a free-threaded mode, with the global interpreter lock (GIL) disabled.
Just-in-time (JIT) compiler You can also not enable the experimental JIT compiler within the Lambda managed runtime or base image.
Performance considerations At launch, new Lambda runtimes receive less usage than existing established runtimes. This can result in longer cold start times due to reduced cache residency within internal Lambda sub-systems. Cold start times typically improve in the weeks following launch as usage increases. As a result, AWS recommends not drawing conclusions from side-by-side performance comparisons with other Lambda runtimes until the performance has stabilized. Since performance is highly dependent on workload, customers with performance-sensitive workloads should conduct their own testing, instead of relying on generic test benchmarks.
Using Python 3.13 in Lambda AWS Management Console To use the Python 3.13 runtime to develop your Lambda functions, specify a runtime parameter value Python 3.13 when creating or updating a function. The Python 3.13 version is available in the Runtime dropdown in the Create Function page:
Creating Python function in AWS Management Console
To update an existing Lambda function to Python 3.13, navigate to the function in the Lambda console and choose Edit in the Runtime settings panel. The new version of Python is available in the Runtime dropdown.
Changing a function to Python 3.13
You may need to check your code and dependencies for compatibility with Python 3.13, and update as necessary.
AWS Lambda container image Change the Python base image version by modifying the FROM statement in your Dockerfile
FROM public.ecr.aws/lambda/python:3.13# Copy function codeCOPY lambda_handler.py ${LAMBDA_TASK_ROOT}
AWS Serverless Application Model (AWS SAM) In AWS SAM set the Runtime attribute to python3.13 to use this version.
AWSTemplateFormatVersion: '2010-09-09'Transform: AWS::Serverless-2016-10-31Description: Simple Lambda Function MyFunction: Type: AWS::Serverless::Function Properties: Description: My Python Lambda Function CodeUri: my_function/ Handler: lambda_function.lambda_handler Runtime: python3.13
AWS SAM supports generating this template with Python 3.13 for new serverless applications using the sam init command. Refer to the AWS SAM documentation.
AWS Cloud Development Kit (AWS CDK) In AWS CDK, set the runtime attribute to Runtime.PYTHON_3_13 to use this version. In Python CDK:
from constructs import Construct from aws_cdk import ( App, Stack, aws_lambda as _lambda )class SampleLambdaStack(Stack): def __init__(self, scope: Construct, id: str, **kwargs) -> None: super().__init__(scope, id, **kwargs) base_lambda = _lambda.Function(self, 'python313LambdaFunction', handler='lambda_handler.handler', runtime=_lambda.Runtime.PYTHON_3_13, code=_lambda.Code.from_asset('lambda'))
In TypeScript CDK:
import * as cdk from 'aws-cdk-lib';import * as lambda from 'aws-cdk-lib/aws-lambda'import * as path from 'path';import { Construct } from 'constructs';export class SampleLambdaStack extends cdk.Stack { constructor(scope: Construct, id: string, props?: cdk.StackProps) { super(scope, id, props); // The code that defines your stack goes here // The python3.13 enabled Lambda Function const lambdaFunction = new lambda.Function(this, 'python313LambdaFunction', { runtime: lambda.Runtime.PYTHON_3_13, memorySize: 512, code: lambda.Code.fromAsset(path.join(__dirname, '/../lambda')), handler: 'lambda_handler.handler' }) }}
Conclusion Lambda now supports Python 3.13 as a managed language runtime. This release uses the Amazon Linux 2023 OS and includes Python 3.13 language additions including data model improvements, typing changes, and updates to the standard library. This release does not support the experimental option to disable the global interpreter lock or the experimental JIT compiler.
You can build and deploy functions using Python 3.13 using the AWS Management Console, AWS CLI, AWS SDK, AWS SAM, AWS CDK, or your choice of infrastructure as code tool. You can also use the Python 3.13 container base image if you prefer to build and deploy your functions using container images.
Python 3.13 runtime support helps developers to build more efficient, powerful, and scalable serverless applications. Try the Python 3.13 runtime in Lambda today and experience the benefits of this updated language version.
For more serverless learning resources, visit Serverless Land.
This post is written by Jeremy Girven, Solutions Architect at AWS and Chase Lindeman, Senior Specialist Solutions Architect at AWS.
Amazon Web Services (AWS) and AMD have collaborated since 2018 to deliver cost effective performance for a broad variety of Microsoft workloads, such as Microsoft SQL Server, Microsoft Exchange Server, Microsoft SharePoint Server, Microsoft Systems Center suite, Active Directory, and many other Microsoft workload use cases. This post shows how the performance improvements of the latest generation AMD-powered Amazon Elastic Compute Cloud (Amazon EC2) instances can help you reduce licensing costs on Microsoft workloads running on AWS.
AWS has been running Microsoft workloads for over 16 years. The most common of these workloads are those running Microsoft Windows Server and Microsoft SQL Server. Both can be brought to AWS using the Bring Your Own License (BYOL) or License Included (provided by AWS) licensing models. Many BYOL licensing restrictions need workloads to be run on dedicated tenancy and need Dedicated Hosts. For these workloads, a license would be needed to cover each physical core of the Dedicated Host (for example if the Dedicated Host has 96 physical cores, 96 licenses would be necessary to cover the host). For License Included EC2 instances, the cost of the associated Microsoft licenses is a per-vCPU fee bundled into the total price of the EC2 instance.
Regardless of which licensing option works best for you, the licensing cost is directly related to the number of virtual cores (vCPUs) or physical cores used by your workloads. Using high-performance processors allows you to potentially reduce the total number of cores necessary to run a workload. Reducing the total number of cores subsequently reduces your total cost of ownership (TCO) by reducing the number of licenses. One potential option available for running Microsoft workloads on AWS are EC2 instances, which use fourth generation AMD processors.
The AWS Nitro EC2 instance families using fourth generation AMD EPYC processors are M7a, C7a, R7a, and Hpc7a. These fourth generation AMD EC2 instances use DDR5 memory to deliver 2.25x more memory bandwidth and up to 50% higher performance as compared with previous generation AMD EC2 instances. For performance-per-watt improvements across integer performance, floating point, and natural language processing (NLP) throughout, these fourth generation AMD EPYC processors offer up to 2.7x greater results than those of previous generation AMD EC2 instances.
AMD has publicly available performance testing comparing the General Purpose M7a instances with the previous generation M6a instances. You can find the information in this link. We wanted to expand their testing to Compute Optimized and Memory Optimized EC2 instances to observe if their results hold true for different instance families.
In the following section we dive into our performance testing methodologies, and we review our results.
Method 1: CPU calculation speed The following is the configuration of the EC2 instances used for testing:
- Instance Types: C6a.large and C7a.large (2 vCPUs, 4 GiB Memory, and 30 GiB (3000 IOPS, 125 MB/s) GP3 EBS volume)
- Operating System: Microsoft Windows Server 2022 Datacenter (10.0.20348 N/A Build 20348)
- Installed Software: AWS device drivers (NVMe 1.5.1 & ENA 2.7.0), Amazon EC2 Launch Agent v2 (2.0.1981.0), Amazon SSM Agent (3.3.551.0), and PowerShell 7.4.5 (all non-essential software has been removed)
- AWS Region and AZ: us-west-2 / us-west-2a (usw2-az1)
We performed a direct, yet CPU-intensive math test by calculating prime numbers in a range of 2 through 10,000 using Windows PowerShell (version 7 needed). This runs in a loop ten times, which allows us to use the processing time over all the runs. The following is the code used for testing:
Function Start-PrimeNumberTest { [CmdletBinding()] param( [Parameter(Mandatory = $True)][Int32]$TestRunLimit, #The number of times the test will run in a loop [Parameter(Mandatory = $True)][Int32]$UpperNumberRange #The upper number of the range to find prime numbers in (larger the number the longer it takes to process) ) $DoCount = 0 $NumberRange = 2..$UpperNumberRange [System.Collections.ArrayList]$TimeArray = @() [System.Collections.ArrayList]$OutputArray = @() $vCPUCount = Get-CimInstance -ClassName 'Win32_Processor' | Select-Object -ExpandProperty 'NumberOfLogicalProcessors' Do { $Time = Measure-Command { $Range = $NumberRange $Count = 0 $Range | ForEach-Object -Parallel { $Number = $_ $Divisor = [Math]::Sqrt($Number) 2..$Divisor | ForEach-Object { If ($Number % $_ -eq 0) { $Prime = $False } Else { $Prime = $True } } If ($Prime) { $Count++ If ($Count % 10 -eq 0) { $Null } } } -ThrottleLimit $vCPUCount } $DoCount++ [void]$TimeArray.Add($Time.TotalSeconds) Start-Sleep -Seconds 5 } Until ($DoCount -eq $TestRunLimit) $Output = $TimeArray | Measure-Object -Average -Maximum -Minimum | Select-Object -Property 'Count', 'Average', 'Maximum', 'Minimum' [void]$OutputArray.Add("Number of runs : $($Output.Count)") [void]$OutputArray.Add("Average time to complete (seconds) : $($Output.Average)") [void]$OutputArray.Add("Maximum time to complete (seconds) : $($Output.Maximum)") [void]$OutputArray.Add("Minimum time to complete (seconds) : $($Output.Minimum)") Write-Output $Output}
To run the code, invoke the function and specify the Test Run Limit and Upper Number Range. For example, the following code mimics our test by finding prime numbers up to 10,000 and run the test 10 times:
Start-PrimeNumberTest -TestRunLimit 10 -UpperNumberRange 10000
Test results: CPU calculation speed Figure 1. C7a.large and C6a.large performance results over ten tests
Although this is a direct CPU performance test, it demonstrates a clear performance advantage of using the latest generation of AMD powered instances as compared with previous generations:
- Slowest test: The C7a.large was over seven seconds faster than the quickest run on the C6a.large. This is a delta of more than 25% faster in the worst-case scenario for the C7a.large.
- Fastest test: The C7a.large completed over 13 seconds faster than the C6a.large, showing a 47% faster processing time.
- Average: There is an 11 second difference in processing time between the two instances. The C7a.large is averaging over 38% faster than the C6a.large.
Price-performance The latest generation of AMD instances is more expensive than the previous generation. However, when we consider the performance delta between the two instances, using the average test duration length and the on-demand price of both instances in us-west-2, the C7a.large cost $0.000957791 per run to process the workload while the C6a.large cost $0.001352344. The C6a.large costs approximately $0.0004 per second more to process the same workload. Although that might sound small, this cost delta is greater than $12,000 over a 1-year period. These results show the value using the latest generation of AMD powered instances, especially with CPU bound workloads.
Method 2: SQL Server performance We wanted our second testing method to focus more on real-world applications related to Microsoft workloads. For this test, we wanted to measure SQL Server performance.
SQL Server can be tested with an open source load testing tool called HammerDB. SQL Server is primarily used for OLTP workloads, thus we used the TPROC-C benchmark from HammerDB because it is specifically tailored for OLTP database testing.
The following is the configuration of the EC2 instances used for testing:
- *Instance Types:* R7a.8xlarge and R6a.8xlarge (32 vCPUs, 256 GiB Memory)
- Storage: io2 EBS volumes w/ 40,000 IOPS (EC2 instance maximum)
- SQL Server: Microsoft SQL Server 2022 (RTM-CU14) (KB5038325) – 16.0.4135.4 (X64) Jul 10 2024 14:09:09 Copyright (C) 2022 Microsoft Corporation Enterprise Edition: Core-based Licensing (64-bit) on Windows Server 2022 Datacenter 10.0
(Build 20348: ) (Hypervisor) - Maximum Server Memory: 240 GB
- Database File Size: 220 GB
- Database Data Size: 2000 warehouses (~200 GB)
- MAXDOP: 1
HammerDB creates a test database based on “warehouses.” Each warehouse is approximately 100 MB of data. Our test server used 2000 warehouses, leaving approximately 20 GB for overhead in the 220 GB database file size. The total database size was also purposely sized smaller than the total memory allocated to our SQL Server. This allows SQL Server to cache as much of the database as possible in memory to avoid latency reading from disk.
When testing with Hammer DB, it uses “virtual users” as a method of applying load to the database. Our testing on each EC2 instance started with a small load of 32 virtual users to match the number of virtual users to vCPUs. Tests used a warmup time of five minutes and five minutes of processing. Then, the virtual users were increased by logarithmic scale to apply a larger performance load on the servers. Testing continued until we saw a decline of the of the total Transactions Per Minute (TPM). Three full runs were completed on each EC2 instance to create an average TPM at each level of virtual users.
Test results: SQL Server performance Figure 2. R7a.8xlarge and R6a.8xlarge average TPM
Figure 3. R7a.8xlarge and R6a.8xlarge average TPM
The R7a.8xlarge consistently outperformed the R6a.8xlarge, even on tests with low load. The most notable difference was a 34% increase in TPM at peak performance. These results are similar to the 32% difference that AMD published when testing the M7a.8xlarge and M6a.8xlarge instances using another OLTP benchmark, TPROC-E.
Cost savings Our test results are good news if you’re running SQL Server workloads. The ability to process more transactions with the same number of vCPUs translates into needing fewer vCPUs to run your current workloads, thereby lowering the total number of SQL Server licenses in your environment. With SQL Server Enterprise Edition licensing costing over $15,000 per 2-core pack as of this writing, being able to reduce your SQL Server licensing costs could save you hundreds of thousands of dollars for your total cost of ownership.
Conclusion When evaluating the cost of CPU license-based workloads, such as those available with Microsoft workloads, the results show looking at the price alone isn’t optimal for selecting instances to use for your workloads. Commercial software such as Microsoft’s Windows Server or SQL Server are typically licensed at the vCPU level or the physical core level (BYOL). When dealing with CPU-bound workloads, choosing the instance with the highest performance to price ratio is the best evaluation method.
This post is written by Ballu Singh, Principal Solutions Architect at AWS, Ankush Goyal, Enterprise Support Lead in AWS Enterprise Support, Hasan Tariq, Principal Solutions Architect with AWS and Ninad Joshi, Senior Solutions Architect at AWS.
The On-Demand Capacity Reservations (ODCR) allows you to reserve compute capacity for your Amazon Elastic Compute Cloud (Amazon EC2) instances in a specific Availability Zone (AZ) for any duration. It makes sure that you always have access to your Amazon EC2 capacity when you need it. This is ideal for users who need to make sure their instances are available during critical events, even when it is stopped and restarted. Users can create ODCR anytime, without the need for a one or three-year term commitment.
In the post Automate the Creation of On-Demand Capacity Reservations for running EC2 instances, we discussed a solution for automating ODCR operations for existing EC2 instances. The post included creating, modifying, and canceling Capacity Reservations. We also showed monitoring Capacity Reservation usage using the Amazon CloudWatch metric InstanceUtilization, which indicates the percentage of reserved capacity currently in use. This metric is essential for effectively monitoring and optimizing your ODCR consumption.
On August 1st, 2024, AWS introduced new CloudWatch dimensions for Amazon EC2 ODCR. Using these enhancements you can now group CloudWatch metrics for ODCR by dimensions, such as InstanceType, AvailabilityZone, InstanceMatchCriteria, InstancePlatform, Tenancy, CapacityReservationId, or across the Capacity Reservations within a selected AWS Region. With these new dimensions, you no longer need to create a new alarm each time a new Capacity Reservation ID (CRID) is added. Furthermore, there is no longer a need to poll ODCR metadata using the describe-capacity-reservations AWS CLI command or API, because this information is now readily available through CloudWatch metrics.
This post shows you how to create CloudWatch alarms for ODCR using these new dimensions. The setup methodology helps you get the information directly in the CloudWatch console instead of having to call the DescribeCapacityReservations API or invoking the describe-capacity-reservationsCLI command.
Summary * The Prerequisites section outlines the necessary prerequisites and assumptions that should be completed before implementing the technical steps described later in this post. This includes any accounts, services, permissions, or configurations that need to be set up in advance. * The Setup section describes the specific scenario and infrastructure environment assumed for demonstrating the CloudWatch dimensions and alarms discussed in this post. * In the Implementation details section, we do a deep dive into the technical implementation, such as code snippets and step-by-step configurations for creating CloudWatch alarms for metric InstanceUtilization grouped by six dimensions outlined earlier. * The Cleaning up section provides steps to prevent ongoing charges after experimenting with the infrastructure and alarms created here. * Finally, in the Conclusion section, we recap the key points explored around CloudWatch, dimensions, metrics, and alarms. This content can serve as a solid foundation for implementing more advanced monitoring, optimization, and architectural best practices going forward.
Prerequisites This solution needs you to complete the following prerequisites:
- Create Capacity Reservations in your account by following the ODCR Workshop self-paced lab. The solution needs scripts from this lab. If you are using any other Capacity Reservations for this lab, then you must use parameters according to your environment setup (for example AWS Region, AZ, platform, and instance match criteria)
- All the code used in this post is publicly available in the accompanying GitHub repository. Refer to the json included in the GitHub repository for the AWS Identity and Access Management (IAM) role permissions for IAM users used in the solution.
- Refer to the preceding GitHub repository for the code, and save the txt file in the same directory with other Python scripts. You may want to run the requirements.txt file if you don’t have appropriate dependencies to run the rest of the Python scripts. You can run this using the following command:
pip3 install -r requirements.txt
Setup For this post, we have provided Python scripts to create CloudWatch alarms for Capacity Reservation usage metric for ODCR, for example InstanceUtilization. These alarms can be grouped using the new dimensions: InstanceType, AvailabilityZone, InstanceMatchCriteria, InstancePlatform, Tenancy, CapacityReservationId, or across the Capacity Reservations within a selected Region. We also created an Amazon Simple Notification Service (Amazon SNS) topic named ODCRAlarmTopic to notify you when there’s a breach with your CloudWatch alarm’s threshold.
To get started, download the scripts for creating a CloudWatch alarm using each aforementioned dimension from the GitHub repository in the Prerequisites section.
We envision a scenario where multiple Capacity Reservations exist across a Region in your AWS account. The goal is to identify any unused Capacity Reservations to optimize capacity usage and reduce unnecessary charges. Unused capacity can be identified by creating a CloudWatch alarm for the InstanceUtilization metric. The alarm can be grouped by one of six dimensions: AZ, Instance Match Criteria, Instance Type, InstancePlatform, Tenancy, or across the Capacity Reservations. You must set the alarm threshold that aligns to your usage optimization targets.
With Capacity Reservations, charges apply to any unused capacity. Users accept these charges because reservations provide capacity assurance. However, with improved reservation usage, users can make sure their reserved capacity is fully used. A triggered CloudWatch alarm signifies unused capacity. It can notify users to take near real-time action to optimize capacity and eliminate charges for unused reservations.
Implementation details The following sections show the implementation details of alarms for each dimension.
For each alarm that we create in this section, you can set a threshold based on your usage optimization goals. For this post, we are setting the threshold to 75%. When these alarms are in place and the CloudWatch alarm breaches that threshold, the system enters an alarm state and sends an SNS notification to ODCRAlarmTopic. This process helps identify and address potential issues or opportunities for optimization related to the specific monitored dimension.
Creating CloudWatch alarm using AllCapacityReservations dimension In this scenario, an organization is currently using the Capacity Reservations at 100% usage, but it needs to be notified when the total capacity usage drops to less than or equal to the threshold value. To do so, we use the InstanceUtilization metric for ODCR and group it with the AllCapacityReservations dimension. You can run the by_all_capacity_reservations.py script provided in the GitHub repository to create this CloudWatch alarm.
Prior to running the script, you must determine the following parameters:
Necessary input parameters * RegionName: The Region where the CloudWatch alarm should be created (for example us-east-1). * EmailAddress: The email address to receive notifications (for example user@example.com).
Optional input parameters * Dimension (default: AllCapacityReservations): The dimension for the CloudWatch alarm. * MetricName (default: InstanceUtilization): The metric name for the CloudWatch alarm. * ComparisonOperator (default: LessThanOrEqualToThreshold): The comparison operator for the CloudWatch alarm. * Threshold (default: 75.0): The threshold value for the CloudWatch alarm. * Protocol (default: email): The protocol for the SNS subscription. * TopicName (default: ODCRAlarmTopic): The name of the SNS topic.
After you’ve determined your input parameters, run the following Python script with your desired parameters to set up the alarm:
python3 by_all_capacity_reservations.py --RegionName <<Insert here the region where you have the Capacity Reservations>> --EmailAddress <<Insert here the email address subscribed to ODCRAlarmTopic>>
This creates a CloudWatch alarm that monitors InstanceUtilization for the Capacity Reservations in the Region you specified. You can confirm the alarm has been created by reviewing the by_all_capacity_reservations.log created in the same folder where you ran the script from. The following is an example log file content that confirms the creation of the alarm.
2024-10-17 19:32:34,922 __main__ INFO: Creating CloudWatch Alarm for the InstanceUtilization metric with AllCapacityReservations dimension in the us-east-1 region.
2024-10-17 19:32:35,514 __main__ INFO: The SNS topic 'ODCRAlarmTopic' already exists with ARN: arn:aws:sns:us-east-1:XXXXXXXXXXXX:ODCRAlarmTopic.
2024-10-17 19:32:35,516 __main__ INFO: Please ensure you have subscribed to the SNS Topic arn:aws:sns:us-east-1: XXXXXXXXXXXX:ODCRAlarmTopic.
2024-10-17 19:32:35,986 __main__ INFO: Successfully created CloudWatch Alarm for the InstanceUtilization metric with AllCapacityReservations dimension in the us-east-1 region.
You can also validate in the CloudWatch console. Choose All alarms and search for ODCRAlarm-InstanceUtilization-AllCapacityReservations.
Figure 1: Example AllCapacityReservations Alarm Setup validation using CloudWatch console
Creating CloudWatch alarm using InstanceType dimension After receiving an alert on total Capacity Reservations usage dropping below the threshold, you may want to view the usage drop by a specific instance type. To do so you can use the InstanceUtilization metric for ODCR and group it with the InstanceType dimension. You can use the by_instanceType.py script provided in the GitHub repository to create this CloudWatch alarm.
Prior to running the script, you must determine the following parameters:
Necessary input parameters * RegionName: The Region where the CloudWatch alarm should be created (for example us-east-1). * EmailAddress: The email address to receive notifications (for example user@example.com). * InstanceType: The instance type for the CloudWatch alarm (for example t2.micro).
Optional input parameters * Dimension (default: InstanceType): The dimension for the CloudWatch alarm. * MetricName (default: InstanceUtilization): The metric name for the CloudWatch alarm. * ComparisonOperator (default: LessThanOrEqualToThreshold): The comparison operator for the CloudWatch alarm. * Threshold (default: 75.0): The threshold value for the CloudWatch alarm. * Protocol (default: email): The protocol for the SNS subscription. * TopicName (default: ODCRAlarmTopic): The name of the SNS topic.
After you’ve determined your input parameters, run the following Python script with your desired parameters to set up the alarm:
python3 by_instanceType.py --RegionName <<Insert here the region where you have the Capacity Reservations>> --EmailAddress <<Insert here the email address subscribed to the ODCRAlarmTopic>> --InstanceType t2.micro
This should create the InstanceType dimension alarm. You can confirm this by reviewing the by_instanceType.log created in the same folder where you ran the script from. The following is an example log file content that confirms the creation of this alarm.
2024-10-17 19:46:07,288 __main__ INFO: Creating CloudWatch Alarm for the InstanceUtilization metric with InstanceType dimension in the us-east-1 region.
2024-10-17 19:46:07,804 __main__ INFO: The SNS topic 'ODCRAlarmTopic' already exists with ARN: arn:aws:sns:us-east-1:XXXXXXXXXXXX:ODCRAlarmTopic.
2024-10-17 19:46:07,804 __main__ INFO: Please ensure you have subscribed to the SNS Topic arn:aws:sns:us-east-1:XXXXXXXXXXXX:ODCRAlarmTopic.
2024-10-17 19:46:08,285 __main__ INFO: Successfully created CloudWatch Alarm for the InstanceUtilization metric with InstanceType dimension in the us-east-1 region.
You can also validate in the CloudWatch console. Choose All alarms and, for example, search for ODCRAlarm-InstanceUtilization-InstanceType-t2.micro.
Figure 2: Example InstanceType Alarm Setup validation using CloudWatch console
Creating CloudWatch alarm using AvailabilityZone dimension After receiving an alert on total Capacity Reservations usage at the instance level dropping below the threshold, you may want to view the usage drop by a specific AZ. You can do so by using the InstanceUtilization metric for ODCR and group it with the AvailabilityZone dimension. You can use the by_availabilityZone.py script provided in the GitHub repository to create this CloudWatch alarm.
Prior to running the script, you must determine the following parameters:
Necessary input parameters * RegionName: The Region where the CloudWatch alarm should be created (for example us-east-1). * EmailAddress: The email address to receive notifications (for example user@example.com). * AvailabilityZone: The AZ for the CloudWatch alarm (for example us-east-1a).
Optional input parameters * Dimension (default: AvailabilityZone): The dimension for the CloudWatch alarm. * MetricName (default: InstanceUtilization): The metric name for the CloudWatch alarm. * ComparisonOperator (default: LessThanOrEqualToThreshold): The comparison operator for the CloudWatch alarm. * Threshold (default: 75.0): The threshold value for the CloudWatch alarm. * Protocol (default: email): The protocol for the SNS subscription. * TopicName (default: ODCRAlarmTopic): The name of the SNS topic.
After you’ve determined your input parameters, run the following Python script with your desired parameters to set up the alarm:
python3 by_availabilityZone.py --RegionName <<Insert here the region where you have the Capacity Reservations>> --EmailAddress <<Insert here the email address subscribed to the ODCRAlarmTopic>> --AvailabilityZone us-east-1b
This should create the AvailabilityZone alarm. You can confirm this by reviewing the by_availabilityZone.log created in the same folder where you ran the script from. The following is an example log file content that confirms the creation of this alarm.
2024-10-17 19:38:39,141 __main__ INFO: Creating CloudWatch Alarm for the InstanceUtilization with AvailabilityZone dimension in the us-east-1 region.
2024-10-17 19:38:39,667 __main__ INFO: The SNS topic 'ODCRAlarmTopic' already exists with ARN: arn:aws:sns:us-east-1:XXXXXXXXXXXX:ODCRAlarmTopic.
2024-10-17 19:38:39,667 __main__ INFO: Please ensure you have subscribed to the SNS Topic arn:aws:sns:us-east-1:XXXXXXXXXXXX:ODCRAlarmTopic.
2024-10-17 19:38:40,172 __main__ INFO: Successfully created CloudWatch Alarm for the InstanceUtilization metric with AvailabilityZone dimension in the us-east-1 region.
You can also validate in the CloudWatch console. Choose All alarms, and search for ODCRAlarm-InstanceUtilization-AvailabilityZone-us-east-1b.
Figure 3: Example AvailabilityZone Alarm Setup validation using CloudWatch console
Create CloudWatch alarm using the InstancePlatform dimension Based on workload requirements, organizations use different platforms such as Windows and Linux/UNIX for EC2 instances. They may want to be notified when the usage drops below threshold for a particular platform. To achieve this, we can use the InstanceUtilization metric for ODCR and group it with the InstancePlatform dimension. You can use the by_platform.py script provided in the GitHub repository to create the CloudWatch alarm.
Prior to running the script, you must determine the following parameters:
Necessary input parameters * RegionName: The Region where the CloudWatch alarm should be created (for example us-east-1). * EmailAddress: The email address to receive notifications (for example user@example.com). * InstancePlatform: The InstancePlatform for the CloudWatch alarm. For exampleE: ‘Linux/UNIX’. Supported InstancePlatform are’Linux/UNIX’,’Red Hat Enterprise Linux’,’SUSE Linux’,’Windows’,’Windows with SQL Server’,’Windows with SQL Server Enterprise’,’Windows with SQL Server Standard’,’Windows with SQL Server Web’,’Linux with SQL Server Standard’,’Linux with SQL Server Web’,’Linux with SQL Server Enterprise’,’RHEL with SQL Server Standard’,’RHEL with SQL Server Enterprise’,’RHEL with SQL Server Web’,’RHEL with HA’,’RHEL with HA and SQL Server Standard’,’RHEL with HA and SQL Server Enterprise’,’Ubuntu Pro’
Optional input parameters * Dimension (default: InstancePlatform): The dimension for the CloudWatch alarm. * MetricName (default: InstanceUtilization): The metric name for the CloudWatch alarm. * ComparisonOperator (default: LessThanOrEqualToThreshold): The comparison operator for the CloudWatch alarm. * Threshold (default: 75.0): The threshold value for the CloudWatch alarm. * Protocol (default: email): The protocol for the SNS subscription. * TopicName (default: ODCRAlarmTopic): The name of the SNS topic.
After you’ve determined your input parameters, run the following Python script with your desired parameters to set up the alarm:
python3 by_platform.py --RegionName <<Insert here the region where you have the Capacity Reservations>> --EmailAddress <<Insert here the email address subscribed to the ODCRAlarmTopic>> --InstancePlatform Linux/Unix
This should create the InstancePlatform alarm. You can confirm this by reviewing the by_platform.log created in the same folder where you ran the script from. The following log entry shows a confirmation the creation of this alarm.
2024-10-17 19:52:03,839 __main__ INFO: Creating CloudWatch Alarm for the InstanceUtilization with Platform dimension in the us-east-1 region.
2024-10-17 19:52:04,345 __main__ INFO: The SNS topic 'ODCRAlarmTopic' already exists with ARN: arn:aws:sns:us-east-1:XXXXXXXXXXXX:ODCRAlarmTopic.
2024-10-17 19:52:04,345 __main__ INFO: Please ensure you have subscribed to the SNS Topic arn:aws:sns:us-east-1:XXXXXXXXXXXX:ODCRAlarmTopic.
2024-10-17 19:52:04,854 __main__ INFO: Successfully created CloudWatch Alarm for the InstanceUtilization with Platform dimension in the us-east-1 region.
You can also validate in the CloudWatch console. Choose All alarms, and search for ODCRAlarm-InstanceUtilization-Platform-Linux/Unix.
Figure 4: Example AvailabilityZone Alarm Setup validation using CloudWatch console
Creating CloudWatch alarm using the InstanceMatchCriteria dimension Capacity Reservations are configured as either open or targeted. If the Capacity Reservation is open, then the new and existing instances that have matching attributes automatically run in the capacity of the Capacity Reservation. If the Capacity Reservation is targeted, then instances must specifically target it to run in the reserved capacity. Organizations using these configurations may want to be notified when instance usage drops in either open or targeted Capacity Reservations. To achieve this, we use the InstanceUtilization metric for ODCR and group it with the InstanceMatchCriteria dimension. You can use the by_instanceMatchCriteria.py script provided in the GitHub repository to create the CloudWatch alarm.
Prior to running the script, you must determine the following parameters:
Necessary input parameters * RegionName: The Region where the CloudWatch alarm should be created (for example us-east-1). * EmailAddress: The email address to receive notifications (for example user@example.com). * InstanceMatchCriteria: The tenancy for the CloudWatch alarm. Supported values are ‘open’ and ‘targeted’.
Optional input parameters * Dimension (default: InstanceMatchCriteria): The dimension for the CloudWatch alarm. * MetricName (default: InstanceUtilization): The metric name for the CloudWatch alarm. * ComparisonOperator (default: LessThanOrEqualToThreshold): The comparison operator for the CloudWatch alarm. * Threshold (default: 75.0): The threshold value for the CloudWatch alarm. * Protocol (default: email): The protocol for the SNS subscription. * TopicName (default: ODCRAlarmTopic): The name of the SNS topic.
After you’ve determined your input parameters, run the following Python script with your desired parameters to set up the alarm:
python3 by_instanceMatchCriteria.py --RegionName <<Insert here the region where you have the Capacity Reservations>> --EmailAddress <<Insert here the email address subscribed to the ODCRAlarmTopic>> --InstanceMatchCriteria open
This should create the InstanceMatchCriteria alarm. You can confirm this by reviewing the by_instanceMatchCriteria.log created in the same folder where you ran the script from. The following log entry confirms the creation of such alarm.
2024-10-17 19:43:25,463 __main__ INFO: Creating CloudWatch Alarm for the InstanceUtilization with InstanceMatchCriteria dimension in the us-east-1 region.
2024-10-17 19:43:25,996 __main__ INFO: The SNS topic 'ODCRAlarmTopic' already exists with ARN: arn:aws:sns:us-east-1:XXXXXXXXXXXX:ODCRAlarmTopic.
2024-10-17 19:43:25,996 __main__ INFO: Please ensure you have subscribed to the SNS Topic arn:aws:sns:us-east-1:XXXXXXXXXXXX:ODCRAlarmTopic.
2024-10-17 19:43:26,552 __main__ INFO: Successfully created CloudWatch Alarm for the InstanceUtilization metric with InstanceMatchCriteria dimension in the us-east-1 region.
You can also validate in the CloudWatch console. Choose All alarms, and search for ODCRAlarm-InstanceUtilization-InstanceMatchCriteria-open.
Figure 5: Example InstanceMatchCriteria Alarm Setup validation using CloudWatch console
Creating CloudWatch alarm using the Tenancy dimension By default, EC2 instances run on shared tenancy hardware. However, if users want, they can also choose dedicated tenancy. Organizations using both types of tenancy for their workload may want to be notified when instance usage drops in either of these tenancies. To achieve this, we use the InstanceUtilization metric for ODCR and group it with the Tenancy dimension. You can run the by_tenancy.py script provided in the GitHub repository to create the CloudWatch alarm.
Prior to running the script, you must determine the following parameters:
Necessary input parameters * RegionName: The Region where the CloudWatch alarm should be created (for example us-east-1). * EmailAddress: The email address to receive notifications (for example user@example.com). * Tenancy: The tenancy for the CloudWatch alarm. Supported Tenancy are ‘default’ and ‘dedicated’.
Optional input parameters * Dimension (default: Tenancy): The dimension for the CloudWatch alarm. * MetricName (default: InstanceUtilization): The metric name for the CloudWatch alarm. * ComparisonOperator (default: LessThanOrEqualToThreshold): The comparison operator for the CloudWatch alarm. * Threshold (default: 75.0): The threshold value for the CloudWatch alarm. * Protocol (default: email): The protocol for the SNS subscription. * TopicName (default: ODCRAlarmTopic): The name of the SNS topic.
After you’ve determined your input parameters, run the following Python script with your desired parameters to set up the alarm:
python3 by_instanceMatchCriteria.py --RegionName <<Insert here the region where you have the Capacity Reservations>> --EmailAddress <<Insert here the email address subscribed to the ODCRAlarmTopic>> --Tenancy default
This should create the Tenancy dimension alarm successfully. You can confirm this by reviewing the by_tenancy.log created in the same folder where you ran the script from. The following entry confirms the creation of the alarm.
2024-10-17 19:56:14,331 __main__ INFO: Creating CloudWatch Alarm for the InstanceUtilization with Tenancy dimension in the us-east-1 region.
2024-10-17 19:56:14,809 __main__ INFO: The SNS topic 'ODCRAlarmTopic' already exists with ARN: arn:aws:sns:us-east-1:XXXXXXXXXXXX:ODCRAlarmTopic.
2024-10-17 19:56:14,810 __main__ INFO: Please ensure you have subscribed to the SNS Topic arn:aws:sns:us-east-1:XXXXXXXXXXXX:ODCRAlarmTopic.
2024-10-17 19:56:15,287 __main__ INFO: Successfully created CloudWatch Alarm for the InstanceUtilization with Tenancy dimension in the us-east-1 region.
You can also validate in the CloudWatch console. Choose All alarms and search for ODCRAlarm-InstanceUtilization-Tenancy-default.
Figure 6: Example Tenancy Dimension Alarm Setup validation using CloudWatch console
Other options As of this post’s publication, there is no native support to create a CloudWatch alarm on two dimensions. However, you can create a custom CloudWatch metric and create an alarm on that metric.
Cleaning up If you used the ODCR workshop to create Capacity Reservations in your account, then follow the Clean-up step of the workshop to delete the Capacity Reservations and EC2 instances to stop incurring any charges. If you created any other EC2 instances or Capacity Reservations for this post, terminate those EC2 instances and cancel those Capacity Reservations.
To delete the alarms you created in this post, follow these steps given in the CloudWatch documentation.
Conclusion In this post, we explored how to use the new Amazon CloudWatch dimensions for Amazon EC2 ODCR to efficiently monitor and maintain constant Capacity Reservations and achieve a higher level of usage, thereby saving costs associated with unused capacity. By automating the creation of CloudWatch alarms for Capacity Reservation usage metrics, specifically InstanceUtilization, you can gain more granular insights into your reserved capacity. This includes grouping metrics by Instance Type, Availability Zone, Platform, Instance Match Criteria, Tenancy, or across the Capacity Reservations in a Region.
We also used an Amazon SNS topic to receive near-real time alerts when thresholds are breached. These tools enable you to effectively monitor and optimize your ODCR usage, making sure that you maintain efficient and cost-effective capacity management during critical events.
For more details, refer to the updated Capacity Reservations documentation. If you have any questions or feedback, feel free to share them in the comments section or contact AWS Support.
*This post is written by Rafet Ducic, Senior Solutions Architect at Amazon Web Services (AWS)* Introduction Amazon Elastic Compute Cloud (Amazon EC2) now lets you modify CPU configurations after an instance has launched. With this new feature, users can change instance CPU settings either by directly modifying the **CPU configuration,** or when changing instance size or type. You can now specify a custom number of CPUs and/or disable simultaneous multithreading (SMT) also known as hyper-threading (HT), for workloads where HT doesn’t provide performance improvement. These capabilities help Bring Your Own license (BYOL) users to optimize their CPU-based licensing costs. For more details on supported instance types, core count, and threads per core values available for each instance type, refer to the supported CPU options for Amazon EC2 instance type documentation.
Why CPU configuration matters for different workloads? One of our users recently faced a significant challenge when their SQL Server licensing costs unexpectedly increased after scaling their EC2 instances to the next size up. This increase occurred because the Optimized CPUs feature, which can be configured to enable a custom number of CPUs to disable HT so that they can save on SQL Server BYOL licensing costs, was reset during scaling. As a result, this user quadrupled (as opposed to doubled) their licensing requirements when scaling from r7i.xlarge to r7i.2xlarge. Initially, we recommended creating a new Amazon Machine Image (AMI) and launching a new instance with the desired CPU configurations. But this approach introduced complications such as creating new AMIs, moving Amazon Elastic Block Store (Amazon EBS) volumes, and managing security groups. The user wanted a solution that would allow them to scale their workloads seamlessly without these complexities. After working backward from this and other user requirements, we are excited to bring the capability to retain the Optimized CPU configuration during scaling. This reassures you that your licensing costs are as you would expect (for example increase or decrease linearly with your instance size).
An Optimized CPU can reduce your per-CPU licensing costs by 50% by disabling HT, as long as doing so doesn’t affect application performance. You can save more by selectively disabling additional cores based on your specific workloads. Example workloads include, but are not limited to the following:
- Compute-intensive workloads (for example scientific computing, simulations), which often perform better with one thread per core rather than two threads per core.
- Database workloads (for example SQL Server) where reducing the thread count to one per core typically does not impact performance, because these workloads need more memory and storage but are less dependent on a high number of CPUs. For more details, refer to Optimize CPU best practices for SQL Server workloads.
- High-performance computing (HPC) workloads, which sometimes perform better without HT because it can cause performance degradation because of context switching.
Three ways to set or modify CPU configurations First, you can modify the EC2 instance configuration on an instance that is stopped after launch by modifying CPU Options:
- Go to the EC2 Dashboard: Log in to your AWS Management Console and go to the EC2 dashboard.
- Choose the Instance: Choose the EC2 instance that you want to modify from the list.
- Stop the Instance: In the Instance State dropdown, choose Stop Instance.
- Change CPU Options: In the Actions dropdown, choose Instance Settings, and choose Change CPU Options. You should observe the box shown in Figure 1.
- Configure CPU Settings:
a. Adjust the number of CPU cores (for example the dropdown box to the left of core(s))
b. Set the number of threads per core to 1 so that you disable HT (for example the dropdown box to the left of thread(s) per CPU core)
- Apply the Changes: When your desired CPU configuration is set, choose Apply to save the settings.
Figure 1: Changing CPU options after instance launch
Second, you can also modify the CPU configuration during an instance size or type change:
- Select the Instance: From the EC2 dashboard, choose the instance to modify.
- Stop the Instance: In the Instance State dropdown, choose Stop Instance.
- Change Instance Type: In Actions, choose Instance Settings, then choose Change Instance Type. You should observe the box shown in Figure 2.
- Configure CPU Options: While changing the instance type, you can also:
a. Adjust the number of CPU cores (for example the dropdown box to the left of core(s))
b. Set the number of threads per core to 1 so that you disable HT (for example the dropdown box to the left of thread(s) per CPU core)
- Apply Changes: When configured, apply the changes.
Figure 2: Specifying CPU options during instance size or type change
Finally, you can use the CLI, API, or SDK method to configure the core count and threads per core for your instance using the new command modify-instance-cpu-options:
aws ec2 modify-instance-cpu-options --core-count "2" --threads-per-core "1" --instance-id "i-<your-instance-id>"
License tracking with optimized CPUs in AWS License Manager You can effectively track your license usage by enabling the vCPU Optimization feature for self-managed license configuration within AWS License Manager. This feature integrates with Amazon EC2 CPU optimization, which lets you track the number of vCPUs on an instance. When the vCPU Optimization rule is set to True, License Manager counts vCPUs based on your customized core and thread count. Otherwise, it counts the default number of vCPUs for the instance type, which may not reflect your optimized CPU settings.
Conclusion The ability to modify CPU configurations after an EC2 instance launch offers flexibility and efficiency for managing your workloads. You can adjust CPU cores, threads per core, and change instance types or sizes while retaining custom CPU settings without creating a new instance. This feature helps optimize performance, reduce licensing costs, and streamline operations.
Start using this new functionality today to improve the efficiency and scalability of your EC2 instances!
To learn more about CPU options on Amazon EC2, check out this guide, and Optimize CPU best practices for SQL Server workloads.
Author Bio Rafet Ducic Rafet Ducic is a Senior Solutions Architect at Amazon Web Services (AWS). He applies his more than 20 years of technical experience to help Global Industrial and Automotive users transition their workloads to the cloud cost-efficiently and with optimal performance. With domain expertise in Database Technologies and Microsoft licensing, Rafet is adept at guiding companies of all sizes toward reduced operational costs and top performance standards.
This post is written by Markus Adhiwiyogo, Senior Product Marketing Manager at Amazon Web Services (AWS)
From December 2nd to December 6th, AWS will hold its annual premier learning event: re:Invent. At this event, attendees can become stronger and more proficient in any area of AWS technology through a variety of experiences: large keynotes given by AWS leaders, smaller innovation talks and interactive working sessions given by AWS experts, and fun activities such as live music and games at re:Play.
There are over 2000+ learning sessions that focus on specific topics at various skill levels, and the compute team have created 72 unique sessions for you to choose. There are many sessions you can choose from, and we are here to help you choose the sessions that best fits your needs. Even if you are not able to join in person, you can catch-up with many of the sessions on-demand and even watch the keynote and innovation sessions live.
The Basic: Session types If you’re able to join us, just a reminder that we offer several types of sessions which can help maximize your learning in a variety of AWS topics.
re:Invent attendees can also choose to attend chalk-talks, builder sessions, workshops, or code talk sessions. Each of these are live non-recorded interactive sessions.
- Breakout sessions: Attendees will be in a lecture-style 60-minute informative sessions presented by AWS experts, customers, or partners. These sessions are recorded and uploaded a few days after to the AWS Events YouTube channel.
- Chalk-talk sessions: Attendees will interact with presenters, asking questions and using a whiteboard in session.
- Builder Sessions: Attendees participate in a one-hour session and build something.
- Workshops sessions: Attendees join a two-hour interactive session where they work in a small team to solve a real problem using AWS services.
- Code talk sessions: Attendees participate in engaging code-focused sessions where an expert leads a live coding session.
- Lightning talk sessions: Attendees watch a 20-minute demo dedicated to either a specific service or customer story (located in the Expo Hall).
Getting started with Amazon EC2 The foundation of compute in AWS is Amazon Elastic Compute Cloud (Amazon EC2). Amazon EC2 offers the broadest and deepest compute platform, with over 800 instances and choice of the latest processor, storage, networking, operating system, and purchase model to help you best match the needs of your workload. We’ve created the following sessions to help you implement and manage your workloads in Amazon EC2.
- CMP101 | What’s new with Amazon EC2Learn about the latest compute innovations from AWS. This session helps you better understand Amazon EC2 instances and how organizations like yours can use them to run any workload while meeting your cost, performance, and sustainability goals.
- CMP343 | Select and launch the right instance for your workload and budgetWith more than 800 instances for various use cases, including instances best for common workloads and for workloads with specific requirements, how do you choose instances? Learn how to determine which instance is best for your specific use case and budget.
- CMP319 | Managing Amazon EC2 capacity and availabilityAmazon EC2 offers a variety of capacity usage and reservation models, so you can choose the right combination for your workload and budget. Learn how to combine these models in a way that’s best for your business and manage your capacity to improve utilization and availability.
- CMP207 | AWS-accelerated computing enables customer success with generative AIDiscover how AWS provides the most performant, low-cost infrastructure for building and scaling large-scale generative AI models. Come learn what’s new in the accelerated computing portfolio including our GPU-based and AWS AI chips-powered instances.
- CMP318 | Choose the optimal compute environment for your AI/ML workloads
If you’re trying to decide between accelerators such as AWS Inferentia and AWS Trainium, GPUs from NVIDIA and AMD, processors such as AWS Graviton, or managed services such as Amazon Bedrock and Amazon SageMaker, this chalk covers the different options available on AWS.
Learn about AWS compute innovations AWS has invested years designing custom silicon optimized for the cloud to deliver the best price performance for a wide range of applications and workloads using AWS services. Learn more about the AWS Nitro System, processors at AWS, and ML chips.
- CMP301 | Dive deep into the AWS Nitro System
The AWS Nitro System is a rich collection of building block technologies that are powering the recent and future generations of Amazon EC2 instances. Dive deep into the Nitro System and see how it made the seemingly impossible possible.
- CMP320 | AWS Graviton: The best price performance for your AWS workloadsAWS Graviton-based Amazon EC2 instances provide the best price performance for workloads in Amazon EC2. Learn about common use cases, best practices to optimize your workloads across various applications, customer success stories, and how to accelerate your Graviton journey.
- CMP209 | Conquer AI performance, cost, and scale with AWS AI chips
Generative AI promises to revolutionize industries, but its immense computational demands and escalating costs pose significant challenges. To overcome these hurdles, AWS designed and purpose-built AI chips including AWS Trainium2 and AWS Inferentia2.
- CMP334 | Deep dive into third generation AWS Nitro SSDsLearn about AWS Nitro SSDs. Discover how AWS Nitro SSDs are different than other commercially available SSDs and see how AWS Nitro SSDs can deliver performance to benefit your workloads.
Optimize your compute costs At AWS, we focus on delivering the best possible cost structure for our customers. Frugality is one of our founding leadership principles. Cost effective design continues to shape everything we do, from how we develop products to how we run our operations. Come learn of new ways to optimize your compute costs through AWS services, tools, and optimization strategies in the following sessions:
- CMP214 | Win-win: Maximize Amazon EC2 savings while improving performanceLet this session be your guide to building cost-effective, sustainable infrastructure without sacrificing application performance on AWS. Learn both technical and non-technical best practices for building efficient compute architectures on AWS.
- CMP408 | Amazon EC2 flex instances: Deliver performance at lower costAmazon EC2 flex instances provide the easiest way to save costs and achieve better price performance for a majority of your workloads. In this session, dive deep into flex instances, explore how they deliver performance at lower cost, and identify the suitable workloads.
- CMP312 | Spot the savings: Optimize deployments with Amazon EC2 Spot InstancesAmazon EC2 Spot Instances use spare Amazon EC2 capacity available to you at steep discounts compared to on-demand prices. In this workshop, learn about the solutions, tools, and best practices to help you maximize your savings with Spot instances.
- CMP346 | Uncover compute efficiency with AWS Graviton Savings Dashboard
The Graviton Savings Dashboard offers a comprehensive analysis of your compute usage, identifying prime candidates for Graviton migration. Learn how to implement and use the Graviton Savings Dashboard to quantify the potential TCO reduction from Graviton adoption. - CMP311 | Proactively scale for optimal cost and availability in Amazon EC2Amazon EC2 Auto Scaling groups help you take advantage of the elasticity benefits that are built in to AWS. With more responsive and proactive scaling, you run only the required number of instances at any time of the day, reducing the cost of overprovisioned EC2 instancess
Maximize you workload’s performance Your workload’s performance matters beyond just cost because it directly impacts the quality, efficiency, and effectiveness of your compute solution. It can significantly influence customer satisfaction, business growth, and overall productivity. Even if a cheaper option exists, a low-cost option with poor performance can lead to long-term financial losses due to issues such as lost customers, engineering rework, and negative reputation. We have a number of sessions that help you optimize your workload’s performance.
- CMP411 | Everything you’ve wanted to know about performance on EC2 instancesThis session covers all the details you’ve always wanted to know to optimize your compute performance such as memory topology, accessing hardware counters, accounting for the side-effects of hyperthreading, properly running performance tests, and optimizing your latency.
- CMP413 | Moving from naive benchmarking to application performance engineeringMost of the time, benchmarks aren’t representative of their applications’ behaviors. In this session, learn the tools and best practices that will help you understand your applications’ performance behaviors on Amazon EC2 instances so that you can maximize your performance.
- CMP405 | How to optimize latency and throughput
The availability of processors with and without hyperthreading makes performance evaluation a tricky game. In this code talk, study a web application and evaluate its performance in various scenarios, and discover how to optimize throughput and latency along the way.
Customer experiences and applications with machine learning Machine learning (ML) has been evolving for decades and has an inflection point with generative AI applications capturing widespread attention and imagination. More customers, across a diverse set of industries, choose AWS compared to any other major cloud provider to build, train, and deploy their ML applications. Learn about generative AI infrastructure at Amazon or get hands-on experience building ML applications through our ML focused sessions, such as the following:
- CMP208 | Customer stories: Optimizing AI performance and cost with AWS AI chipsAWS Trainium and AWS Inferentia deliver high-performance AI training and inference while reducing costs by up to 50%. Attend this session to hear from four AWS customers and how they realized these benefits to grow their businesses while delivering innovative experiences.
- CMP321 | Explore the many ways to train foundation models on AWSThis session unravels the complexities of building and scaling large scale foundation models. From selecting the optimal compute resources to optimizing data pipelines and maximizing network performance.
- CMP331 | Build and accelerate LLMs on AWS Trainium and AWS Inferentia using RayLearn how to accelerate the development and deployment of large language models (LLMs) with Ray, AWS Trainium, and AWS Inferentia. This session delves into how Ray’s unified compute framework integrates with powerful AWS AI chips to optimize performance and cost efficiency.
- CMP304 | Fine-tune Hugging Face LLMs using Amazon SageMaker and AWS TrainiumYou can improve the performance of a pretrained LLM by fine-tuning the model using a smaller task-specific or domain-specific dataset. In this builders’ session, learn how to use Amazon SageMaker to fine-tune a pretrained Hugging Face LLM using AWS Trainium for inference use.
- CMP337 | Fine-tune and deploy Llama 3.1 models on AWS Trainium and InferentiaThis session provides an overview of Neuron SDK and the various capabilities that maximize performance and deliver ease-of-use when training and deploying Llama 3.1 models on AWS AI chips.
- CMP314 | Keeping it small: Agentic workflows with SLMs on AWS InferentiaWhile LLMs offer versatility, smaller language models (SLMs) provide resource efficiency, speed, and simplicity. This session explores task simplification and decomposition techniques to harness multiple specialized SLMs, surpassing a single large model’s accuracy at fraction of cost.
- CMP329 | Beyond text: Unlock multi-modal AI with AWS AI chipsRevolutionize your applications with multi-modal AI. Learn how to harness the power of AWS AI chips to create intelligent systems that understand and process text, images, and video.
- CMP323 | Optimize your AI/ML workloads with Amazon EC2 GravitonJoin this session to explore performance, cost, and sustainability optimizations of your AI/ML solutions with services powered by AWS Graviton, accelerated computing instances, and Amazon EC2 Spot Instances.
- CMP407 | Optimized RAG pipelines using AWS Graviton: VectorDB and LLM endpointsLearn from AWS experts about efficient RAG deployment options for use cases that optimize cloud resource usage and costs. Learn what’s possible when using AWS Graviton to power your RAG-optimized generative AI inference workloads.
Accelerate your AWS Graviton adoption journey The AWS Graviton Processors are custom designed server processors designed by AWS. They deliver the best price performance for your cloud workloads running in AWS, and help you reduce your carbon footprint. Ready to realize up to 40% better price performance for your workloads? We have curated the following session to help you accelerate your Graviton adoption:
- CMP305 | Learnings from developers adopting AWS Graviton at scale
In this chalk talk, engage directly with AWS specialists that help customers on a daily basis with their adoption journey—from workload selection to running at scale in production. Explore AWS Graviton use cases, best practices, performance, and customer success stories. - CMP310 | Migrating applications to AWS Graviton on Amazon EKSDuring this hands-on workshop, walk through the steps for migrating a workload running on x86 to AWS Graviton-based instances including performing tests locally and modifying the CI/CD pipeline to build and deploy the application in Amazon EKS using Karpenter.
- CMP316 | AWS Graviton GameDay: Optimize your Amazon EC2 workload with GravitonReady to learn more about AWS Graviton in an immersive environment? In this team-based gamified learning setting, perform a live migration of your workload to Graviton. You learn how to unlock Graviton’s full price-performance potential and optimize the size of an Amazon EC2 fleet.
- CMP404 | Exploring performance analysis with AWS Graviton instancesIn this session, AWS experts open a shell on an Amazon EC2 instance and dig into the system to see which tools and resources you can use, including the Amazon Aperf tool. Learn as they write some mini-applications to study their performance behavior and how to improve them.
Check out workload-specific sessions Amazon EC2 offers the broadest and deepest compute platform to help you best match the needs of your workload. More SAP, high performance computing (HPC), ML, and Windows workloads run on AWS than any other cloud. Join sessions focused around your specific workload to learn about how you can leverage AWS solutions to accelerate your innovations.
- CMP205 | Launch a secure WordPress site on Amazon Lightsail in minutes
Join this session to learn how to set up a secure and highly available WordPress website on Amazon Lightsail – an easy-to-use virtual private server (VPS). Discover what Amazon Lightsail is, the resources available to create a website, and how to set one up in minutes, all at a predictable monthly cost. - CMP341 | Migrate and modernize your web applications with AWS Elastic Beanstalk
Moving classic web applications to the cloud can be a complex task for customers. In this chalk talk, operators and developers can learn the benefits of using AWS Elastic Beanstalk to upload and deploy web applications in a simplified, fast way and integrate with your existing CI/CD. - CMP213 – Run workloads efficiently on EKS with Karpenter and EC2 Spot InstancesThis session covers how Karpenter can help you reduce complexities and improve efficiency in Kubernetes clusters. Explore how to leverage Amazon EC2 Spot Instances as a purchase option, and learn how AWS Graviton-based Amazon EC2 instances help further optimize your workloads while improving sustainability.
- CMP322 | Amazon EC2 High Memory portfolio for SAP HANAThis session showcases how customers leverage the agility, flexibility and resiliency that AWS High Memory instances provide to help them deploy and scale the infrastructure for SAP HANA deployments while meeting performance and high availability goals.
- CMP324 | Protect sensitive data in use with AWS Confidential computeConfidential computing enables customers to protect code and data from unauthorized access during processing. This session dives into how AWS delivers a combination of hardware- and software-based solutions to deliver confidential computing capabilities.
- CMP203 | Drive innovation and results with high performance computing on AWSIn this session, explore how customers across healthcare and life sciences (HCLS) and manufacturing industries are harnessing the convergence of HPC, cloud, and AI on AWS to accelerate time to insights, optimize performance, and drive innovation.
- CMP210 | Modernize Apple platform development with AWS and EC2 MacLearn about Apple application development in the cloud using EC2 Mac instances and hear firsthand how an AWS customer optimized its Apple development workflow and benefited from Apple application development in the cloud.
- CMP302 | Run containerized workloads efficiently on AWSContainers offer scalability and flexibility, enabling seamless deployment, management, and scaling of applications in any environment. Using containers on AWS can help you improve your efficiency and achieve your price performance goals.
- CMP326 | Accelerate AI innovation for health care and life sciences on AWS
Biopharma researchers are looking to build and deploy models such as AlphaFold2, ProtGPT2, and ESM-2 for generative biology and chemistry. In this chalk talk we cover how to deploy NVIDIA BioNeMo on NVIDIA GPU-powered Amazon EC2 instances, AWS ParallelCluster, and Amazon SageMaker. - CMP342 | Scaling 3D content creation with open source technologiesThis chalk talk explores 3D Gaussian Splatting as an emergent 3D reconstruction technique and how AWS can accelerate and scale the generation, management, and consumption of digitalized real-world assets in enterprise contexts, from virtual production to immersive commerce.
- CMP315 | Creating immersive 3D digital twins from photos, videos, and LiDAR
Join spatial computing specialists as they show you how to build a digital twin in this interactive workshop using NVIDIA Omniverse.
Ready to unlock new possibilities? The AWS Compute team looks forward to seeing you in Las Vegas. Come meet us at the Compute Booth in the Expo and check out our various Amazon EC2 demos. And if you’re looking for more session recommendations, check-out additional re:Invent attendee guides curated by experts.
AWS Lambda is introducing an enhanced local IDE experience to simplify Lambda-based application development. The new features help developers to author, build, debug, test, and deploy Lambda applications more efficiently in their local IDE when using Visual Studio Code (VS Code).
Overview The IDE experience is part of the AWS Toolkit for Visual Studio Code. A new guided walkthrough helps developers set up their local environment and install required tools. The toolkit includes a set of sample applications which show you how to iterate on your code locally and in the cloud. You can configure and save build settings to speed up application builds. Generate a configuration file to set up the debugging environment for VS Code to attach and launch the step-through debugger. Iterate faster by choosing to sync local application changes quickly to the cloud or perform a full application deploy. Test functions locally and in the cloud and create and share test events to speed up local and cloud testing. There are quick action buttons for build, deploy to cloud, and local or remote invoke. The toolkit integrates with AWS Infrastructure Composer, providing a visual application building experience directly from the IDE.
Using the new features Installing the extension To use the updated IDE experience, ensure you have the AWS Toolkit minimum version 3.31.0 installed as a VS Code Extension.
The AWS Toolkit now includes an additional section called Application Builder within the AWS extension side-bar. This allows you to view template resources and create, build, debug, and test serverless applications.
Using Application Builder for existing applications You can open an existing local application template using Open Folder.
Lambda’s enhanced in-console editing experience allows you to download existing function code and an AWS Serverless Application Model (AWS SAM) template. This allows you to start in the console and more easily move to using infrastructure as code, which is a serverless best practice.
Using the guided walkthrough The guided walkthrough helps you install dependencies, select an application template, and explains how to use Application Builder to iterate locally and deploy to the cloud.
- Choose Open Walkthrough which opens the walkthrough.
-
Complete installation takes you through a wizard to install required dependencies and select application templates. The wizard provides download links to install the three dependencies:
-
AWS Command Line Interface (AWS CLI)
- AWS SAM CLI
- Docker Desktop (optional)
If you have installed the dependencies, selecting the links recognizes the installations.
- Select Choose your application template, which allows you to create example applications in VS Code.
- The Iterate locally tile provides guidance on how to use Application Builder to build and invoke the function, and how to view the results.
- Deploy to the cloud provides a link to Configure credentials and explains how to deploy your function to the cloud, remote invoke from your IDE, and view the results.
Creating an application from the samples The following steps show how to create a function locally from an included template. You build the code artifact, locally test and debug, deploy, and remotely invoke and view results and logs, all without leaving your IDE.
- Navigate back to Choose your application template.
- New template with visual builder allows you to use Infrastructure Composer to create a new application using a visual canvas.
- See more application examples provides additional sample applications across a number of managed runtimes.
There are also two specific example applications to explore Lambda functionality.
- Rest API: Learn how to build a synchronous Lambda function behind an API.
- File processing.: Learn how to build an asynchronous Amazon S3 file processing application.
Building a synchronous Rest API application 1. Select Rest API and chose Initialize your project.
2. Select a language runtime. Select Python for this example.
3. Open the file explorer, create a folder to download the example application and choose Create Project.
Application Builder downloads the application. This includes the function code hello_world\app.py, with dependencies in requirements.txt, an AWS SAM template, template.yaml file, and an example event trigger, event.json. A README.md file explains the application structure and provides build and deploy instructions.
The Application Builder section populates with the template resources.
- The icons provide shortcuts to view, build, and deploy the application.
- You can also use the Command Pallete to initiate the AWS SAM commands.
- Selecting the Open Template File icon opens the AWS SAM template in Infrastructure Composer.
- View the application resources and select Details to edit the template using the visual canvas.
- Navigate to the function resource and select Open Function Handler to show the function code.
Building the application The build step helps you build artifacts from the files in your application project directory.
- Select the Build SAM template icon.
- Specify build flags allows you to configure AWS SAM builds settings.
- Select build settings particular to your configuration. Cached and parallel are useful to speed up future builds. Use container builds your function in a Lambda-like container. This allows you to build applications without having the language runtime and build tools installed locally.
- Save parameters adds the default build options in
samconfig.toml.
version = 0.1[default.build.parameters]template_file = "c:\\Code\\lambda-dx\\Rest-API\\template.yaml"cached = trueparallel = trueuse_container = true
AWS SAM builds the application. It downloads the build container image, installs the dependencies, and copies the function code.
- Press any key to close the additional terminal.
Iterate locally: invoke and debug You can locally invoke and debug your serverless application before uploading it to the cloud. This helps you to test the logic of your function faster. Step-through debugging allows you to identify and fix issues in your application one instruction at a time in your local environment.
Local invoke 1. In the Application Builder section, navigate to the function and select Local Invoke and Debug Configuration. Initiating Local Invoke and Debug Configuration
-
This brings up another window which allows you to configure how to invoke the function locally and set up a debug configuration. Viewing Local Invoke and Debug Configuration Options
-
You can create sample event payloads to test your function. Select an event provides a list of common trigger event payloads you can use and customize. Selecting an example event template
This example application has an included sample event.
- Select Local file and choose the
events\event.jsonfile. -
Select the Invoke button. This builds the application and locally invokes the function within a Lambda emulation environment, using the event input file.
-
View the function output within the IDE Output pane.
Viewing function output
Local debugging You can also debug the function locally using VS Code’s built-in debugger.
-
Add a breakpoint to the function code. Adding a breakpoint to the function code
-
Select the Invoke button again. This locally invokes the function and attaches a debugger to the Lambda emulation environment.
-
The debugger stops at the breakpoint and you can view the function variables and call stack. Viewing step through debugging
-
Use the VS Code debugger icons to step through the code. Using VS Code debugger icons to step through the code.
-
In the Local Invoke and Debug Configuration panel. Chose Save Debug Config.
-
Choose Add Local Invoke and Debug Configuration. Saving debug configuration
-
Enter a debug configuration name which creates a
launch.jsonfile and adds the debug configuration. Naming debug configuration
You can create and save multiple debug configurations for different scenarios. See the AWS SAM documentation for more launch.json configuration options.
- Once you save the debug configuration, you can use VS Code’s Run and Debug panel and select which debug configuration to run.
Using the Run and Debug panel
Deploying the application 1. Navigate to the Application Builder section and chose the Deploy SAM Application icon. Selecting Deploy SAM Application icon
AWS SAM provides two deployment options:
- Sync uses AWS SAM sync to perform an initial CloudFormation deploy and then allows for quick syncing of your application code, which allows for rapid prototyping. Use this for development environments only, as it doesn’t do a full CloudFormation deploy on code changes.
- Deploy does a full CloudFormation deploy, which is preferred for non-quick development environments.
Viewing AWS SAM deployment options
- Select Sync.
-
Select Specify required parameters and save as defaults. Specifying SAM sync parameters
-
Select a Region to deploy the stack and enter a stack name. It is good practice to specify that this is a dev stack to avoid confusion when using the Deploy option. Entering dev stack name
-
Select an existing S3 bucket to store the artifacts, or create a new one. Selecting S3 bucket
-
Specify the Sync parameters. Ensure you select Watch as this automatically watches for code changes and quickly syncs code changes to the Lambda service Setting sync parameters
-
AWS SAM sync does an initial CloudFormation deploy to build the resources and then waits for code changes.
-
Make a change to the handler file code and save the file, Amending code
-
This performs a quick sync which reduces the time to test in the cloud. Quickly syncing code
-
You can use the Deploy option to deploy a non-quick sync test version, amending the stack name to differentiate it from the dev stack.
Naming test version stack
Remote invoke You can invoke the function in the cloud from your IDE. This allows you to test functionality without having to mock security, external services, or other environment variables.
Once the application is deployed, Application Builder detects changes to samconfig.toml and template.yaml, it updates the resources list with the cloud resources.
Viewing cloud resources
-
You can browse directly to the CloudFormation stack to view resources. Browsing to CloudFormation stack
-
Selecting the function provides quick link functionality, which includes function details and a link directly to the Lambda console for the function. Viewing function quick link options
-
Select Invoke in cloud.
-
Select the same local event file for the local invoke. Selecting local file for remote invoke
-
Choose Remote Invoke. The function invokes in the cloud using the local test event and displays the remote invoke results in the local IDE Output pane.
Viewing remote invoke results
- Name and save the local event file as a remote event which becomes available in the Lambda console.
Saving remote test event
Viewing logs You can fetch the Amazon CloudWatch Log streams generated by your Lambda function in the IDE.
-
Select the Search Logs icon. Selecting Search Logs icon
-
You can optionally filter the results.
Optionally filtering log results
Conclusion Lambda is introducing an enhanced local IDE experience to simplify the development of Lambda-based applications using the VS Code IDE and AWS Toolkit. This streamlines the code-test-deploy-debug cycle. A guided walkthrough helps set up your local development environment and provides sample applications to explore Lambda functionality. You can then build, debug, test, and deploy Lambda applications using icon shortcuts and the Command Pallette. This allows you to more easily iterate on your Lambda-based applications without switching between multiple interfaces.
For more serverless learning resources, visit Serverless Land.
AWS Lambda is introducing a new code editing experience in the AWS console based on the popular Code-OSS, Visual Studio Code Open Source code editor. This brings the familiar Visual Studio Code interface and many of the features directly into the Lambda console, allowing developers to use their preferred coding environment and tools in the cloud. The Lambda Code Editor displays larger function package sizes and also integrates with Amazon Q Developer. This is an AI-powered coding assistant that provides real-time suggestions and insights to help you write, understand, and troubleshoot your Lambda functions more efficiently.
Overview Visual Studio Code is the most popular IDE among developers according to the 2023 Stack Overflow Developer Survey. Integrating Code-OSS into the Lambda Console brings a familiar, accessible, and customizable interface to the in-browser code editing capabilities. This provides a coding experience that is substantially similar to working with function code locally. You can install selected extensions, apply preferred themes and settings, and use your familiar keyboard shortcuts and coding preferences.
The new editing experience is included as part of the standard Lambda service, at no extra cost.
Accessibility The update also addresses important accessibility needs. With features like high color contrast, keyboard-only navigation, and screen reader support, the Code-OSS integration ensures an inclusive and accessible coding experience for all developers.
Differences from Visual Studio Code IDE The Lambda console’s Code-OSS integration complements, rather than fully replaces, local development workflows. You can view and edit function code that uses an interpreted language, not compiled languages, which is consistent with the previous Lambda console. The terminal window is also unavailable in Code-OSS.
AWS Toolkit for Visual Studio Code extensions Deeper integration with the AWS Toolkit for VS Code extension provides access to a subset of AWS specific functionality, including Q Developer. This ensures that the Lambda code editing experience benefits from additional developer tooling enhancements provided through the AWS Toolkit.
Larger package sizes With Lambda, the total package size for ZIP-based functions, including code and libraries, cannot exceed 50 MB. Previously Lambda imposed a 3MB limit for editing code in the console. Now you are able to view function package sizes up to 50 MB in the console, however, there is still a single file limit of 3 MB. This allows you to view function code even when you have larger dependencies.
Using the new features Viewing code To experience the new Lambda Code Editor, log into the AWS Management Console and navigate to the Lambda service. Create a new function or edit an existing one. The new Lambda Code Editor is ready to use, with no additional setup required.
This example shows editing an existing function, viewing the function code in the familiar Code-OSS editor.
Viewing function code in the Lambda Code Editor
Previously, the code was not viewable as the code package size was greater than 3 MB. The update allows you to view larger files. The following image shows a package size of 13.3 MB and the Code-OSS editor allows editing of the function handler.
Viewing larger package size
Environment variables In the left pane, the environment variables are viewable for the function. Select the pencil icon to edit, add, and remove environment variables.
Viewing and editing environment variables
Creating test events The new split-screen view allows you to test your function and see your code and test results side-by-side, simplifying test event configuration.
- Select Create test event to open the panel. Creating test event
You can create Private test events or Shareable test events for other builders to use with access to the account.
- Generate an event using an event template for the Amazon API Gateway HTTP API event trigger that the function uses. Save the test event. Creating API Gateway test event
Invoke function9. Invoke the function by selecting the Invoke button
The function results appear in the Output panel, consistent with the local VS Code IDE experience.
Function invoke result
The function logs appear below the output.
Viewing function logs
This view allows you to view and edit your code, generate and use test events, and invoke your function, all visible within the familiar Lambda Code Editor interface.
Live Tail Logs Lambda now natively supports Amazon CloudWatch Logs Live Tail. This is an interactive log streaming and analytics capability, which allows you to view and analyze your Lambda function logs in real time.
- Select the Run and Debug icon in the Activity Bar on the left-hand side of the code editor in the Code tab.
- Select Open CloudWatch Live Tail. This opens the CloudWatch Logs Live Tail bottom drawer.
- Select Start to start a Live Tail session and view your Lambda function logs stream in real time.
- Alternatively, navigate to the Test tab and select CloudWatch Logs Live Tail to start a Live Tail session.
CloudWatch Logs Live Tail
Keyboard shortcuts In the left pane Extensions dialog, you can see the keyboard shortcuts are installed by default.
Viewing installed extensions
Select the Manage gear icon which shows which aspects are configurable.
Viewing configuration options
The Keyboard shortcuts dialog allows you to view and change the shortcuts.
Amending keyboard shortcuts
Command Palette Viewing the Command Palette shows available commands.
Viewing Command Palette
Configuration settings The Settings panel allows you to configure the Lambda Code Editor to match your local IDE environment if required.
Viewing Settings panel
Navigate to Themes | Color Themes to customize the theme, including dark mode.
Lambda Console Editor dark mode
Downloading function code and template It is now easier to download the function code and an AWS Serverless Application Model (AWS SAM) template which represents the Cloudformation resources required to set up the function, policies, and triggers. This allows you to start in the console and more easily move to using infrastructure as code, which is a serverless best practice.
- Navigate to the Activity Bar Run and Debug section.
- Select Download code and SAM template.
- Extract the .zip file and open the folder in your local VS Code IDE.
You can continue to edit the function in your local IDE experience, which is consistent with the Lambda Console Editor.
Local VS Code IDE to continue working on function
Using your local IDE terminal or AWS Toolkit for VS Code, you can update the existing function. You can also use AWS SAM functionality to build and deploy the template as a Cloudformation stack to the cloud.
Using Amazon Q The Amazon Q Developer AI assistant integrates directly into the code editor. This reduces the need to consult external documentation or tutorials, streamlining your development workflow.
Amazon Q provides inline suggestions or by using keyboard shortcuts for common actions you take, such as initiating Amazon Q or accepting a recommendation.
This example below adds more functionality to a new Lambda function to download an object from S3 with the help of Amazon Q. Enter a comment explaining the functionality you need.
Asking Amazon Q a question
Select tab to accept the suggestion.
Accepting an Amazon Q suggestion
You can continue to invoke Q manually to keep adding more code suggestions.
Continue adding functionality with Amazon Q
Conclusion
Lambda is introducing a new AWS console code editing experience based on the popular Code-OSS, Visual Studio Code Open Source code editor. This brings the familiar VS Code IDE interface and features directly into the Lambda console so you can use your preferred coding environment and tools in the cloud. Invoke your function using a new split-screen view to see your code and test results side-by-side, simplifying test event configuration.
The code editor displays larger function package sizes, makes environment variables more visible, and also integrates with Amazon Q Developer. This provides real-time suggestions and insights to help you write, understand, and troubleshoot your Lambda functions more efficiently.
For more serverless learning resources, visit Serverless Land.
This post is written by Shridhar Pandey, Senior Product Manager, AWS Lambda
Today, AWS is announcing two new features which make it easier for developers and operators to build and operate serverless applications using AWS Lambda. First, the Lambda console now natively supports Amazon CloudWatch Logs Live Tail which provides you real-time visibility into Lambda function logs, making it easier to develop and troubleshoot Lambda functions. Second, the Lambda console now offers Amazon CloudWatch Metrics Insights dashboard for key Lambda function metrics, enabling you to easily identify and troubleshoot the source of errors or performance issues.
This blog post dives into the new capabilities enabled by these launches, how these capabilities simplify the developer and operator experience for building serverless applications with Lambda, and how you can get started with them.
Native CloudWatch Live Tail logs in Lambda console Customers building serverless applications using Lambda want visibility into the behavior of their Lambda functions in real time, such as when an error occurs or a code change causes unexpected behavior. For example, developers want to instantly see the result of their code or configuration changes on the behavior of the function, and operators want to quickly troubleshoot any critical issues which would prevent the function from operating smoothly.
To help you monitor and troubleshoot the behavior of your function, the Lambda service automatically captures and sends logs to CloudWatch Logs. However, previously, you had to wait for Lambda function logs to be ingested, processed, and stored by CloudWatch Logs before you could view them. Then, you had to navigate to the CloudWatch console to view, search, and query logs using tools like CloudWatch Logs Insights. This caused frequent context switching between the Lambda and CloudWatch consoles in order to access logs, which introduced friction in the process of rapidly developing and troubleshooting Lambda functions.
The Lambda console now natively supports CloudWatch Logs Live Tail, an interactive log streaming and analytics capability which enables developers and operators to view and analyze their Lambda function logs in real time. This capability provides a built-in, real-time view of function logs as they become available in the Lambda console, as seen in the following image. Developers can now easily start a Live Tail session with one click and view the latest log entries as their function is executing. So, they can now edit the function code, deploy changes, invoke the function, and view the result of their code change in real time, without navigating away from the Lambda console. This streamlines and accelerates the author-test-deploy cycle (also known as the “inner dev loop”) when building serverless applications using Lambda.
Figure 1 CloudWatch Logs Live Tail in Lambda console
The Live Tail experience in Lambda console also offers fine-grained log analysis capabilities to filter logs, making it easier for operators and DevOps teams to debug and troubleshoot issues and critical errors in their Lambda functions. For example, while investigating errors in the Lambda function, operators can apply filter patterns to only display log events containing keywords of interest e.g., ERROR, exception, etc. This helps narrow down the search to relevant log events and cut out the noise, reducing the mean time to recovery (MTTR) when troubleshooting Lambda function errors. Thus, Live Tail enables operators to proactively monitor the health of their serverless applications built using Lambda and react faster to resolve errors or unexpected behavior.
Live Tail in action To use Live Tail capabilities on any CloudWatch log group, you must have logs:StartLiveTail, logs:StopLiveTail, and logs:DescribeLogGroups AWS Identity and Access Management (IAM) permissions for that CloudWatch log group. Alternatively, you can add CloudWatchLogsReadOnlyAccess managed IAM policy (which contains these IAM permissions) to your IAM role. See Overview of managing access permissions to your CloudWatch Logs resources to learn more.
To get started with Live Tail in the Lambda console:
- Navigate to the Lambda console at https://console.aws.amazon.com/lambda/
- In the Functions page, select the Lambda function for which you want to view Live Tail logs.
- In the Code tab, select Run and Debug icon in the Activity Bar on the left-hand side of the code editor. This opens the Run and Debug view.
- Select Open CloudWatch Live Tail. This opens the CloudWatch Logs Live Tail bottom drawer.Figure 2: Starting Live Tail from code editor in Lambda console Note: Figure 2 shows the new code editor experience in the Lambda console
- Select Start to start a Live Tail session and view your Lambda function logs stream in real time. Alternatively, visit Test tab and select CloudWatch Logs Live Tail to start a Live Tail session.
Figure 3: Active Live Tail session
The CloudWatch Logs Live Tail bottom drawer features a Filter panel on the left-hand side, which contains useful controls such as CloudWatch log group selection, option to filter logs, and the Start and Stop buttons. You can collapse this panel if you want to utilize the entire width of your screen to view logs (without horizontal scrolling) in the Live Tail session, as shown in the following image.
Figure 4: Active Live Tail session with collapsed Filter Panel
The Filter panel has the CloudWatch log group corresponding to your Lambda function selected by default, but you can select other log groups. You can select up to 5 log groups at a time. You can also stop the Live Tail session at any time by selecting Stop in the Filter panel.
To filter logs based on specific terms or keywords, apply patterns using the “Add filter pattern” option in the Filter panel. The filters field is case sensitive. You can specify keywords, phrases, numeric values, or regular expressions in the filter pattern. See Filter pattern syntax for metric filters, subscription filters, filter log events, and Live Tail to learn more about how to use filter patterns to display only log events of interest. For example, you can filter log events containing specific keywords or phrases (e.g., ERROR, FATAL, exception, etc.) as shown in the following image.
Figure 5: Active Live Tail session with multiple log groups selected and filter patterns applied
The Live Tail session automatically stops after 15 minutes (i.e., 900 seconds) of inactivity or when the Lambda console session times out. However, when you restart the Live Tail session, the previously applied filtering criteria will be retained. This means, you can pick up where you left off with just one click.
You get 1,800 minutes of Live Tail session usage per month for free with the AWS Free Tier, after which you pay $0.01 per minute of usage. See CloudWatch pricing page for Live Tail pricing details.
The Live Tail experience in Lambda console is available in all commercial AWS Regions where AWS Lambda and Amazon CloudWatch Logs are available. See Lambda documentation and this introductory video to learn more about native Live Tail support for Lambda.
CloudWatch Metrics Insights dashboard in Lambda console In order to effectively operate distributed applications, easily identifying the source of errors or performance issues is critical. For example, when you notice a spike in critical metrics like errors or invocation duration in your Lambda dashboard, you want to quickly find out which Lambda functions are causing these spikes. Previously, you had to navigate to the CloudWatch console and query metrics or create custom dashboards.
Now, the Lambda console features a new built-in CloudWatch Metrics Insights dashboard which provides you instant visibility into critical insights for Lambda functions in your account, such as “most invoked Lambda functions”, “functions with highest number of errors”, and “functions taking the longest to run”. The dashboard leverages CloudWatch Metrics Insights capability to enable you to easily identify functions driving the highest usage, errors, and performance issues. Thus, the Metrics Insights dashboard surfaces key insights right where you need them, reducing friction due to context switching and making it easy for your operator team(s) to identify and fix errors and performance anomalies for your serverless applications built using Lambda.
Metrics Insights dashboard in action You can easily get started with Metrics Insights dashboard without making any code changes or creating custom dashboards. Simply navigate to the Dashboard page in the Lambda console to start accessing the insights surfaced in the Metrics Insights dashboard. The following image shows the Metric Insights dashboard in the Lambda console.
Figure 6: Lambda Dashboard page with Metrics Insights dashboard
The dashboard shows the top 10 Lambda functions in your AWS account with highest number of invocations, errors, and longest invocation duration. In the example shown in the following image, the Lambda function named 1-LambdaConsoleStack-er4D14B2288-VulWZHExuSFp shows the highest error rate among all functions experiencing errors. This could be a signal to the operator team to prioritize identifying the root cause behind the high error rate for this function.
Figure 7: Metrics Insights dashboard showing top 10 functions with highest errors, invocations, and concurrent executions
The Metrics Insights dashboard displays data for the most recent 3 hours. You can view and query metrics in the CloudWatch console if you require metrics for longer than 3 hours.
Metrics Insights dashboard in Lambda console is now available in all commercial AWS Regions where AWS Lambda and Amazon CloudWatch are available, including the AWS GovCloud (US) Regions, at no additional cost.
Conclusion This post introduces and illustrates two new Lambda features — native support for CloudWatch Logs Live Tail and Metrics Insights dashboard in the Lambda console. These features simplify the developer and operator experience for serverless applications built using Lambda. Live Tail enables you to view and analyze Lambda logs in real time, which simplifies and accelerates the author-test-deploy cycle and makes it easy to troubleshoot errors in Lambda functions. On the other hand, Metrics Insights dashboard shows key Lambda metrics like errors, invocations, and duration to reduce the mean time to recover (MTTR) from errors and performance issues for Lambda functions.
For more serverless learning resources, visit Serverless Land.
10/18: This post was updated to reflect the latest user interface.
This post is written by Paul Tran, Senior Specialist SA; Asif Mujawar, Specialist SA Leader; Abdullatif AlRashdan, Specialist SA; and Shivagami Gugan, Enterprise Technologist.
Technology Innovation Institute (TII) has developed Falcon 2 11B foundation model (FM), a next-generation AI model that can be now deployed on Amazon Elastic Compute Cloud (Amazon EC2) c7i instances, which support Intel Advanced Matrix Extensions (Intel AMX). Intel AMX is designed to accelerate matrix operations on a CPU, which is fundamental for deep learning and AI workloads.
This post walks through the concept of model quantization and why quantization is vital for real-time use cases. You will be able to reproduce this process and run the model on a CPU at the end of this post.
Open source developers and customers can now use the EC2 C7i instance family to run their AI-powered applications using the Falcon 2 11B model on a CPU, offering a cost-effective alternative to the traditional GPU route to build cost-efficient solutions. It also unlocks deployment of the large language model (LLM) on widely available hardware that enables deployment of efficient and scalable AI applications.
Falcon 2 11B model Falcon 2 11B is the first FM model from TII’s newly released Falcon 2 series. It is a more efficient and accessible LLM that was trained on a massive dataset of 5.5 trillion tokens consisting of web data from RefinedWeb. The model is built on causal decoder-only architecture with 11 billion trainable parameters, making it powerful for autoregressive tasks. It’s equipped with multilingual capabilities and can seamlessly tackle tasks in English, French, Spanish, German, Portuguese, and other languages for diverse scenarios. The new Falcon 2 Series, trained on Amazon SageMaker, widens the capabilities of Falcon by making it more efficient and multilingual. More detailed information on the previous generation of Falcon models can be found at RefinedWeb, Falcon 40B foundation model from TII available on SageMaker JumpStart, and Falcon 180B foundation model from TII is now available via Amazon SageMaker JumpStart.
Falcon 2 11B is supported by the Amazon SageMaker Text Generation Inference (TGI) Deep Learning Container (DLC), an open source, purpose-built solution for deploying and serving LLMs that enables high performance text generation using tensor parallelism and dynamic batching. The model is available under the TII Falcon License 2.0, the permissive Apache 2.0-based software license, which includes an acceptable use policy that promotes the responsible use of AI. In addition, Falcon 2 11B is now available on Amazon SageMaker JumpStart.
INT8 and INT4 quantization For real-time applications such as Retrieval Augmented Generation (RAG) or code generation, reducing the latency for generating the first token is crucial, and minimizing the time between generating subsequent tokens promotes a seamless experience. These benefits are essential for applications that require real-time interaction, where even minor delays could disrupt the user experience and hinder productivity.
The OpenVINO framework enables INT8 and INT4 quantization and weight compression. This optimizes performance by reducing the model size and computational demands, making generative AI more cost-effective. These optimizations lower inference cost while maintaining high quality outputs.
Intel AMX is a new built-in accelerator that improves the performance of deep learning training and inference on the CPU. It provides significant performance advantages for INT8 and INT4 inferencing by accelerating matrix multiplication for deep learning workloads, which are essential in AI model execution. By using AMX, INT8 and INT4 precision models can run faster and more efficiently, without substantial loss in accuracy, providing for quicker inference and lower power consumption.
Benchmark results summary The C7i.24xlarge instance was used for benchmarking the inference performance of the Falcon 2 11B model. The results showcased the effectiveness of INT8 and INT4 quantization techniques, using the OpenVINO toolkit. The results demonstrate significant improvements in latency and throughput.
The code to reproduce the benchmarks on the c7i instance can be found at openvino.genai. Please note that benchmarking performance varies by use, configuration, and other factors.
Case 1 Quantization technique using INT8 Falcon 2 11B with OpenVINO on c7i.24xlarge.
| Quantization | Batch | Input prompt tokens | Output tokens | First token latency ms/token | Second token latency ms/token | Throughput tokens/s | | INT8 | 1 | 32 | 128 | 148.07 | 82.51 | 12.12 | | INT8 | 1 | 64 | 128 | 189.98 | 79.74 | 12.54 | | INT8 | 1 | 128 | 128 | 283.50 | 80.26 | 12.46 | | INT8 | 1 | 512 | 128 | 1037.25 | 82.03 | 12.19 | | INT8 | 1 | 1024 | 128 | 1961.91 | 84.76 | 11.80 | | INT8 | 1 | 2048 | 128 | 4068.90 | 90.40 | 11.06 |
Table 1: Quantization technique using INT8 Falcon 2 11B with OpenVINO on c7i.24xlarge
Case 2 Quantization technique using INT4 Falcon11B with OpenVINO on c7i.24xlarge.
| Quantization | Batch | Input prompt tokens | Output tokens | First token latency ms/token | Second token latency ms/token | Throughput tokens/s | | INT4 | 1 | 32 | 128 | 142.00 | 59.06 | 16.93 | | INT4 | 1 | 64 | 128 | 195.73 | 82.58 | 12.11 | | INT4 | 1 | 128 | 128 | 274.67 | 80.40 | 12.44 | | INT4 | 1 | 512 | 128 | 991.34 | 82.22 | 12.16 | | INT4 | 1 | 1024 | 128 | 1922.87 | 85.18 | 11.74 | | INT4 | 1 | 2048 | 128 | 4079.58 | 90.11 | 11.10 |
Table 2: Quantization technique using INT4 Falcon11B with OpenVINO on c7i.24xlarge. As these results show, INT8 quantization provides excellent latency and throughput numbers. This demonstrates how suitable inference on a CPU is for real-time use cases such as RAG or code generation. Increased performance can also be obtained with more aggressive quantization, such as INT4.
AWS customers can now explore and deploy Falcon 2 11B models using c7i instances across AWS Regions with dedicated performance improvements using OpenVINO Toolkit.
Quantize Falcon 2 11B using OpenVINO and run inference Developers can use the following approach to quantize Falcon 2 11B and optimize to run on CPU instances. The model is pulled from HuggingFace hub through the OpenVINO framework. A full list of compatible models can be found at AI Models verified for OpenVINO.
For the model quantization, the process requires large RAM memory peaking up to over 116 GB for 11 billion parameters at full precision, hence the choice of running the experiments on c7i.24xlarge equipped with 192 GB of RAM for convenience.
This is shown in the following figure during quantization.
Figure 1: Model quantization
Once quantization is achieved, the converted model weights are stored in the instance disk ready to be consumed for inference.
The inference memory requirement is lower compared to the quantization process because the memory footprint of the quantized model for inference is approximately 12 GB, as illustrated in following figure. Running the inference on the c7i.24xlarge instance allows you to benefit from the increased number of cores, which directly correlates with model speed.
Figure 2: Memory footprint of quantized model for inference
Quantize Falcon 2 11B To quantize Falcon 2 11B using OpenVINO, complete the following steps:
- Create c7i.24xlarge EC2 instance in your AWS account.
- Size the Amazon Elastic Block Store (Amazon EBS) storage depending on the number of models you need to experiment with. For instance, using Falcon 2 11B model weights at full precision requires approximately 24 GB of storage. For comfort, we recommend running with at least 150 GB of storage to experiment with different precisions and models.
- Connect to your EC2 instance. See Connect to your EC2 instance to see the different options you can use to access your EC2 instance.
- Create a virtual environment using the following code example.
python3 -m venv ov-llm-bench-envsource ov-llm-bench-env/bin/activatepip install --upgrade pip
5. Clone repository and navigate to the source directory:
git clone https://github.com/openvinotoolkit/openvino.genai.gitcd openvino.genai/llm_bench/python/
6. Install dependencies:
pip install -r requirements.txt
7. Run model conversion:
python convert.py --model_id tiiuae/falcon-11B --output_dir model_weights/int8/ --compress_weights INT8 4BIT_DEFAULT
This command perform quantization using OpenVINO on Falcon2-11B model. It downloads the model from HuggingFace and output the converted model in the path specified in -output_dir
Test Falcon2-11B for inference OpenVINO provides a convenient interface that allows to use the model with HuggingFace transformers library. Run the following python script on your EC2 instance to test inference:
from transformers import AutoTokenizerfrom optimum.intel.openvino import OVModelForCausalLM if __name__ == '__main__': model_path= "model_weights/int8/pytorch/dldt/compressed_weights/OV_FP32-INT8/" tokenizer = AutoTokenizer.from_pretrained(model_path) model = OVModelForCausalLM.from_pretrained(model_path) inputs = tokenizer("What is OpenVINO?", return_tensors="pt") outputs = model.generate(**inputs, max_length=200) text = tokenizer.batch_decode(outputs)[0] print(text)# Falcon2-11B inference completion
The following screenshot shows a sample generated from the previous code. The output is truncated to generate 200 tokens maximum.
Figure 3: Inference results after running Python script
Conclusion In this post, we showcased Falcon 2 11B quantization and optimized performance using OpenVINO on AMX capable EC2 c7i instances. This enables deployment of LLM-based applications on widely available CPUs with high performance as a cost-effective alternative without sacrificing speed. These optimizations significantly lower inference costs while maintaining high-quality outputs.
For more information, refer to Amazon EC2 C7i and C7i-flex instances, SageMaker JumpStart pre-trained models, Amazon SageMaker JumpStart Foundation Models, OpenVINO, and the reference code for quantization.
Leave your feedback in the comments so we can continue to improve upon this benchmark.
This post is written by Josh Hart, Principal Solutions Architect and Thomas Moore, Senior Solutions Architect
This post explores best practice integration patterns for using large language models (LLMs) in serverless applications. These approaches optimize performance, resource utilization, and resilience when incorporating generative AI capabilities into your serverless architecture.
Overview of serverless, LLMs and example use case Organizations of all shapes and sizes are harnessing LLMs to build generative AI applications to deliver new customer experiences. Serverless technologies such as AWS Lambda, AWS Step Functions and Amazon API Gateway enable you to move from idea to market faster without thinking about servers. The pay-for-use billing model also allows for increased agility at an optimal cost.
The examples in this post leverage Amazon Bedrock, a fully managed service to access foundation models (FMs). The same principles apply to LLMs hosted on other platforms such as Amazon SageMaker. Amazon Bedrock allows developers to consume LLMs via an API without the complexities of infrastructure management. Amazon SageMaker is a fully managed service to build, train and deploy machine learning models.
The example use-case in this post is leveraging LLMs to create compelling marketing content for the launch of a new family SUV. Images of the vehicle were pre-generated using Amazon Titan Image Generator in Amazon Bedrock, which are shown below.
Example use case images generated using Titan Image Generator
As organizations adopt LLMs to power generative AI applications, serverless architectures offer an attractive approach for rapid development and cost-effective scaling. The following sections explore several serverless integration patterns to build cost-effective, performant, and fault-tolerant generative AI applications.
Direct AWS Lambda call Direct call to Amazon Bedrock from AWS Lambda
The simplest serverless integration pattern is directly calling Bedrock in Lambda using the AWS SDK. Below is an example Lambda function using the Python SDK (boto3), calling the Bedrock InvokeModel API.
import jsonimport boto3brt = boto3.client(service_name='bedrock-runtime')def lambda_handler(event, context): body = json.dumps({ "anthropic_version": "bedrock-2023-05-31", "max_tokens": 1000, "messages": [{ "role": "user", "content": [{ "type": "text", "text":"Create a 500 word car advert given these images and the following specification: \n {}".format(event['spec']) }, { "type": "image", "source": { "type": "base64", "media_type": "image/jpeg", "data": event['image'] } }] }] }) modelId = 'anthropic.claude-3-sonnet-20240229-v1:0' accept = 'application/json' contentType = 'application/json' response = brt.invoke_model(body=body, modelId=modelId, accept=accept, contentType=contentType) response_body = json.loads(response.get('body').read()) return { 'statusCode': 200, 'body': response_body["content"][0]["text"] }
The above code requires the Lambda function execution role to have the correct AWS Identity and Access Management (IAM) permissions to Amazon Bedrock, specifically the bedrock:InvokeModel action.
The example uses the Anthropic Claude 3 Sonnet LLM and the Anthropic Claude Messages API for the payload. The InvokeModel call is synchronous and will therefore wait for a response from the LLM. Depending on the model and prompt, the call can take several seconds. Ensure your Lambda function timeout is set appropriately. In most cases it will need to be increased from the default of 3 seconds.
The boto3 client has a default timeout of 60 seconds. Depending on the use case, you may need to increase the boto3 client timeout as shown in the sample code below.
from botocore.config import Config
 # Set the read timeout to 600 seconds (10 minutes)
 config = Config(read_timeout=600)
# Create the Bedrock client with the custom read timeout configuration
 boto3_bedrock = boto3.client(service_name='bedrock-runtime', config=config)
When working with LLMs, the generated text is often substantial, leading to increased response times or even timeouts. Amazon Bedrock provides the ability to stream responses using InvokeModelWithResponseStream which allows you to process and consume the generated text in chunks as it becomes available. This enables a faster response to the client and allows at least a partial response even if a timeout occurs.
When using response streaming with Lambda functions you should set the boto3 read_timeout to a lower value than the function execution timeout, meaning you will have the option to return at least some content. In some situations this is preferred to no response at all. For example, you might set your Lambda function timeout to 2 minutes and your boto3 read timeout to 90 seconds. This gives you 30 seconds to take additional action. Depending on the failure scenario, you might take various actions:
- Transient errors such as rate limiting or service quotas: Consider backing off and retrying the request or load-balancing requests to another region with cross-region inference.
- Timeout errors when the boto3 read timeout is hit: Decide whether to retry the request with a simplified prompt (or a shorter response length) or return a partial response.
Prompt chaining with AWS Step Functions The direct Lambda pattern works well for simple single-prompt inference. Accomplishing complex tasks with LLMs requires a technique called prompt chaining, where tasks are broken down into smaller well-defined subtask prompts and each prompt is fed to the LLM in a defined order.
Prompt chaining inside a single Lambda function can be time consuming, and may exceed the maximum Lambda timeout of 15 minutes in some cases. AWS Step Functions can be used to solve this issue by orchestrating calls to LLMs. Bedrock has an optimized integration for Step Functions which allows you to use Run as Job (.sync). This integration pattern means Step Functions will wait for the InvokeModel request to complete before progressing to the next state. With Step Functions Standard Workflows you only pay for state transitions, which reduces the cost for Lambda idle wait time.
The below example shows prompt chaining with Step Functions using direct integrations only. The example eliminates the need of custom Lambda code.
Prompt chaining using AWS Step Functions
- The user input (vehicle description) is passed to Amazon Bedrock via the Step Functions optimized integration.
- The generated output of the InvokeModel API call is passed via the ResultPath to the next step.
- The state machine sets the input of the next step based on the output of the previous step using the Pass state.
- The output of each inference request continues to be passed between each step in the workflow.
- The last step runs an inference request and the final result is returned as the output of the state machine.
Another advantage to using AWS Step Functions to invoke the LLM is the built-in error handling. Step Functions can be setup to automatically retry on error and allows you to configure a backoff rate and add jitter to help control throttling. No custom coding is required.
Built-in error handling options for an action in an AWS Step Functions workflow
Handling throttling is particularly important when you are approaching the Bedrock service quota limits, such as the number of requests processed per minute for a particular model. Be aware that some limits are hard limits and cannot be adjusted. See the Bedrock service quotas documentation for the latest information.
Parallel prompts with AWS Step Functions The performance of the application can be improved by breaking down tasks into smaller sub-tasks and running them in parallel. This can dramatically decrease the overall response time, especially for larger models and complex prompts. In the following example, parallel processing reduced the total execution time of the state machine from 30.8 seconds to 19.2 seconds, an improvement of 37.7% when compared to the same steps run in sequence.
The below example uses the Step Functions parallel state to perform Bedrock InvokeModel actions in parallel.
Prompt chaining example using parallel state in AWS Step Functions
- The user input (vehicle description) is passed to Amazon Bedrock via the Step Functions optimized integration.
- The Step Functions parallel state allows branching logic to perform multiple steps in parallel.
- Complex inference tasks are run in parallel to reduce end-to-end execution time.
- Shorter tasks can be combined to balance branch execution time with longer running tasks.
- The generated output is combined and the final response returned.
In addition to the parallel state, the Step Functions map state can be used to run the same action multiple times in parallel with different inputs. For example if you wanted to generate marketing materials for 100 vehicles with data stored in Amazon S3 you could run the above workflow nested in a distributed map state.
Result caching Generating text using LLMs can be a computationally intensive and a time-consuming process, especially for complex prompts or long content generation. To improve performance and reduce latency, caching should be used where possible by storing and reusing previously generated responses. This concept is explored in detail in Mastering LLM Caching for Next-Generation AI.
Caching can be implemented at different levels within your application architecture, each with its own advantages and trade-offs. Here are some examples:
- Caching inside the Lambda execution environment: if your Lambda function receives repeated prompts or inputs, you can store these results inside memory or the /tmp directory of a warmed execution environment.
- External caching services: to overcome the limitations of in-memory caching and leverage more robust caching solutions, you can integrate with external services to store previous results like Amazon ElastiCache (for Redis or Memcached) or Amazon DynamoDB.
The example below uses a Step Functions workflow to check for a cached response in DynamoDB before invoking the model. The cache key in this case could be the LLM prompt. This helps to reduce costs whilst improving performance. The example generates custom vehicle descriptions based on a particular persona, for example to focus on safety features and luggage space for a family, or performance specifications for a motorsport enthusiast.
Example AWS Step Functions that uses Amazon DynamoDB to cache LLM responses
When implementing caching, it is crucial to consider factors such as cache invalidation strategies, cache size limitations, and data consistency requirements. For example, if your LLM generates dynamic or personalized content, caching may not be suitable, as the responses could be stale or incorrect for different users or contexts.
Conclusion This post explored integration patterns for consuming LLMs in serverless applications, enabling an efficient and reliable next generation experience for customers. Single-prompt inference can be achieved with AWS Lambda using the AWS SDK.
Responses from LLMs can be large and often leads to manipulating large text responses in memory, especially for Retrieval-Augmented Generation (RAG) use cases. It’s therefore important to select an optimal memory configuration for your function, and the recommended way to do this is using the AWS Lambda Power Tuning.
When more complex prompt chaining is required it’s best practice to explore Step Functions as a way to reduce idle wait time and avoid being limited by the Lambda 15 minute timeout. Step Functions also bring the benefits of an optimized integration for Bedrock, as well as the ability to handle errors and run tasks in parallel.
Remember that model choice is also an important consideration to balance cost, performance and output capabilities. This is discussed further in Choose the best foundational model for your AI applications.
To find more serverless patterns using Amazon Bedrock take a look at Serverless Land.
This post is written by Maximilian Schellhorn, Senior Solutions Architect and Michael Gasch, Senior Product Manager, EventBridge
Amazon EventBridge is a serverless event router that allows you to decouple your applications, using events to communicate important changes between event producers and consumers (targets). With EventBridge, producers publish events through an event bus, where you can configure rules to filter, transform, and route your events to a variety of targets such as AWS Lambda functions, Amazon Kinesis Data Streams, and public HTTPS endpoints (API destinations).
In event-driven architectures, the flow of sending and receiving events is asynchronous. There is no direct feedback to the producer when targets are invoked or if the invocation was successful. Therefore, to make sure business logic executes reliably in event-driven applications, it’s essential to get an understanding of your event delivery behavior with metrics, such as the number of delivery retries, failed delivery attempts, and the time it takes to deliver events. These metrics allow you to monitor the health of your event-driven architectures, and understand and mitigate event delivery issues caused by underperforming, undersized or unresponsive targets.
This post discusses how to monitor event delivery with EventBridge metrics to detect common event delivery issues and increase the reliability of your event-driven architectures on AWS.
Background EventBridge is a multi-tenant system that handles more than 2.6 trillion events per month as of February 2024. EventBridge maintains fairness and availability under high load using mechanisms to detect and isolate noisy neighbors. As part of the AWS shared responsibility model, you are responsible to monitor and respond to target-related issues for reliable event delivery. For example, an underprovisioned Kinesis data stream or throttled API destination as a target will lead to delivery retries, delays, and failures.
Solution overview EventBridge provides a variety of metrics to observe, troubleshoot, and optimize event delivery. For example, counter-based metrics such as InvocationAttempts, SuccessfulInvocationAttempts, RetryInvocationAttempts, and FailedInvocations allow you to observe throttling and calculate error rates. Latency-based metrics such as IngestionToInvocationSuccessLatency provide insights into event delivery and delays.
In the following sections, we demonstrate the behavior of these metrics through an example application and discuss best practices for reliable event delivery. The example is composed of three key components, as numbered in the following architecture:
- An HTTP load generator to simulate different load patterns through Amazon API Gateway.
- An EventBridge event bus and a rule with an API destination target, throttled at 50 requests per second to simulate an under-scaled resource.
- A dead-letter queue (DLQ) that makes sure events are retained in case of invocations that fail permanently.
Example application architecture
The load generator creates varying load over multiple phases. To observe the number of incoming events, use the EventBridge metrics MatchedEvents or TriggeredRules on the rule name dimension, as illustrated in the following graph.
Number of incoming events visualized in CloudWatch Metrics
The following use cases focus on monitoring event delivery. Therefore, cases where event producers are not able to publish events due to permission errors or are experiencing throttling quotas on PutEvents are not covered.
Use case 1: Detecting event delivery issues due to target rate limiting In this use case, event delivery will experience retries due to an under-scaled API destination target. The API processes all requests successfully. The load generator runs in three phases:
- First, it warms up with a low number of requests and slowly increases the load while staying below the API destination rate limit of 50 requests per second
- In the second phase, the load generator increases to 100 requests per second, exceeding the configured invocation rate on the API destination
- Finally, the load generator slows to 50 requests per second, and eventually finishes
The following graph was created via CloudWatch Metrics and illustrates this scenario.
Load pattern of the example application
EventBridge supports new rule name dimensions for selected metrics, making it straightforward to observe invocations (event delivery) per rule. The following metrics are recommended:
- InvocationAttempts – The overall number of times EventBridge attempts to invoke the target, including retries
- SuccessfulInvocationAttempts – The number of invocation attempts that were successful
- RetryInvocationAttempts – The number attempts that originated from retries
The following graph visualizes the metrics within the first phase of the example scenario. In this phase, the load stays below the configured rate limit of the target. When events are delivered successfully without throttling or errors, InvocationAttempts and SuccessfulInvocationAttempts are equivalent and RetryInvocationAttempts is 0 (the metric is only emitted if there are retries).
EventBridge Metrics during the first phase without throttling or errors
In the second phase (06:55), the load generator creates more events than the target can handle, exceeding the API destination invocation rate limit. This is reflected in the graph by InvocationAttempts and MatchedEvents increasing, while SuccessfulInvocationAttempts stays at the configured API destination rate limit. At the beginning of the phase, RetryInvocationAttempts is 0 because retries due to rate limiting from API destinations are not immediately executed, but delayed with exponential backoff. After the delay, RetryInvocationAttempts starts increasing (06:58), as shown in the following graph.
EventBridge Metrics during the ramp-up phase of the load generator
Because InvocationAttempts also includes retries, the overall number of InvocationAttempts is higher than the incoming MatchedEvents.
Lastly, during the cool down period, when the number of incoming events is decreasing significantly (7:03), more retry attempts succeed, and therefore InvocationAttempts and RetryAttempts reduce. Even though there are no more new incoming events (07:05), there are still events being retried that will eventually finish (07:14).
EventBridge Metrics during the cool-down phase of the load generator
Based on the observations during this scenario, we can calculate the overall custom metric SuccessfulInvocationRate. If you consider retries as a first sign of degraded system state, you can calculate this rate as SuccessfulInvocationAttempts/InvocationAttempts. For example, in Amazon CloudWatch, you can use metric math. Depending on your requirements, you can set up CloudWatch alarms to create notifications when a certain threshold is hit.
Custom SuccessfulInvocationRate metric generated with CloudWatch metric math
Although an occasional decrease of SuccessfulInvocationRate due to temporary traffic spikes or invocation errors can be considered normal, a constant mismatch is an indication of a misconfigured target and needs to be addressed as part of the shared responsibility model.
Use case 2: Detecting and handling event delivery failures By default, EventBridge retries delivering an event for 24 hours and up to 185 times. After all retry attempts are exhausted, the event is dropped or sent to a DLQ. See Using dead-letter queues to process undelivered events in EventBridge for more information on how to configure a DLQ with EventBridge. These events can be visualized through the FailedInvocations or InvocationsSentToDlq metrics. Because FailedInvocations doesn’t consider retries that eventually succeed as failed invocations, this metric wasn’t visible in the previous example.
The following graph represents the same application and load pattern, but the EventBridge rule is configured with a maximum of three retries. During the first phase, there are no failed attempts because the load stays below the throttling limit.
EventBridge Metrics with FailedInvocations after maximum retries exceed
In the second phase, you can observe FailedInvocations starting after the initial retries (three) have been exceeded. Because the example application has a DLQ configured, InvocationsSentToDlq can provide the same insight, and can be used for alerting.
If you’re experiencing a large amount of FailedInvocations or InvocationsSentToDlq, it’s recommended to investigate if the target is properly scaled and able to receive the given traffic. For cases where retries are expected, the retry policy should be configured accordingly.
Use case 3: Detecting event delivery delays The metrics outlined in the previous scenarios provided an overview of how to monitor your event delivery by the total number of retries or failures during a given time period. However, EventBridge also provides a metric that lets you observe the end-to-end latency (the time it takes from event ingestion to successful delivery to the target).
This can be achieved with the new IngestionToInvocationSuccessLatency metric. This metric surfaces effects from retries and delayed delivery, for example due to timeouts and slow responses from targets. In the following graph, you can observe 50th and 99th percentiles (p50 and p99) for IngestionToInvocationSuccessLatency on the right Y axis. During the second phase of the load generator, where invocations exceed the number of events the target can process, retries occur. Therefore, the overall time until events are delivered successfully to the target increases to almost 10 minutes (597,621ms, p99).
Combination of counter based metrics and latency based metrics
IngestionToInvocationSuccessLatency includes the time the target takes to successfully respond to event delivery. This allows you to monitor the end-to-end latency between EventBridge and your target, and detect performance variations and degradations of targets, even when there is no target throttling or errors. For example, the following graph displays constant successful invocations while the latency increases due to longer response times of the target over a 5-minute period (starting at 09:07).
Visualization of increased target latency without errors or retries
Conclusion In this post, we explored best practices for observing event delivery with EventBridge. By using key metrics like SuccessfulInvocationAttempts, RetryInvocationAttempts, and FailedInvocations, you can gain visibility and identify issues early. With CloudWatch metric math, you can calculate a SuccessfulInvocationRate metric, allowing you to define thresholds and alerts on a single key metric.
Furthermore, the new IngestionToInvocationSuccessLatency metric provides insights into the end-to-end event delivery latency between EventBridge and your targets, enabling you to detect and respond to performance degradation. It’s recommended to combine these key metrics into a holistic overview, such as using CloudWatch dashboards. By setting up appropriate alarms and taking a proactive approach to observability, you can mitigate event delivery problems and build resilient, scalable, event-driven applications on AWS with EventBridge. Navigate to Monitoring Amazon EventBridge to get an overview of the available metrics and how to get started.
Try these metrics out with your own use case!
To find more serverless patterns, check out Serverless Land.
This blog post is written by Pranav Chachra, Principal Product Manager, AWS.
In 2019, AWS introduced Zone Groups for AWS Local Zones. Today, we’re announcing that we are working on extending the Zone Group construct to Availability Zones (AZs).
Zone Groups were launched to help users of AWS Local Zones identify related groups of Local Zones that reside in the same geography. For example, the two interconnected Local Zones in Los Angeles (us-west-2-lax-1a and us-west-2-lax-1b) make up the us-west-2-lax-1 Zone Group. These Zone Groups are used for opting in to the Local Zones, as shown in the following image.
In October 2024, we will extend the Zone Group construct to AZs with a consistent naming format across all AWS Regions. This update will help you differentiate group of Local Zones and AZs based on their unique GroupName, improving manageability and clarity. For example, the Zone Group of AZs in the US West (Oregon) Region will now be referred to as us-west-2-zg-1, where us-west-2 indicates the Region, and zg-1 indicates it is the group of AZs in the Region. This new identifier (such as us-west-2-zg-1) will replace the current naming (such as us-west-2) for the GroupName available through the DescribeAvailabilityZones API. The names for the Local Zones Groups (such as us-west-2-lax-1) will remain the same as before.
For example, when you list your AZs, you see the current naming (such as us-west-2) for the GroupName of AZs in the US West (Oregon) Region:
The new identifier (such as us-west-2-zg-1) will replace the current naming for the GroupName of AZs, as shown in the following image.
At AWS we remain committed to responding to customer feedback and we continuously improve our services based upon that feedback. If you have questions or need further assistance, contact AWS Support on the community forums and through AWS Support.
This post is written by Olajide Enigbokan, Senior Solutions Architect and Mohammed Atiq, Solutions Architect
In this post you will learn how to evaluate the throughput for Amazon MQ, a managed message broker service for ActiveMQ, by using the ActiveMQ Classic Maven Performance test plugin. This post will provide recommendations for configuring Amazon MQ to optimize throughput when leveraging ActiveMQ as a broker engine.
Overview on benchmarking throughput for Amazon MQ for ActiveMQ To get a good balance of cost and performance while leveraging ActiveMQ on Amazon MQ, AWS recommends that customers benchmark during migration, instance type/size upgrade, or downgrade. Benchmarking can help you choose the correct instance type and size for your workload requirements. For common benchmark scenarios and benchmark figures for different instances types and sizes, see AmazonMQ for ActiveMQ Throughput benchmarks.
Performance of your ActiveMQ workload depends on the specifics of your use-case. For example, if you have a workload where durability is extremely important (meaning that messages cannot be lost), enabling persistence mode ensures that messages are persisted to disk before the broker informs the client that the message send action has completed. The faster the disk I/O capacity and the smaller the message size during these writes, the better the message throughput. For this reason, AWS recommends the mq.m5.* instance types for regular development, testing, and production workloads as described in Amazon MQ for ActiveMQ instance types. The mq.t2.micro and mq.t3.micro instance types are intended for product evaluation and are subject to burst CPU credits and baseline performance. Hence, they are not suitable for applications that require fixed performance. In the situation where a larger broker instance type is selected, AWS also recommends batching transactions for persistent store which allows you to send multiple messages per transaction while achieving an overall higher message throughput.
The next section describes the details of setting up your own benchmark for Amazon MQ using the open-source benchmarking tool: ActiveMQ Classic Maven Performance test plugin. The ActiveMQ Classic Maven Performance test plugin benchmark suite is highly recommended due to the ease in setup and deployment process.
Getting started This walkthrough guides you through the steps for benchmarking your Amazon MQ brokers:
Step 1 – Build and push container image to Amazon ECR Clone the mq-benchmarking-container-image-sample repository and follow the steps in the README file to build and push your image to an Amazon Elastic Container Registry (Amazon ECR) public repository. You will need this container image for Step 2.
Step 2 – Automate Your Benchmarking Setup with AWS CDK Architecture of CDK deployment
To streamline the deployment of an active/standby ActiveMQ broker alongside Amazon Elastic Container Service (Amazon ECS) tasks for this walk-through, follow these steps below to set up the environment leveraging AWS Cloud Development Kit (AWS CDK). This will deploy the resources shown in the architecture diagram above.
2.1. Prerequisites: Ensure the following packages are installed:
- AWS CLI
- Session Manager plugin for the AWS CLI
- Docker
- Python (Python 3.10 or later)
- AWS CDK v2
2.2 Repository Setup: Clone the mq-benchmarking-sample repository. This repository contains all the necessary code and instructions to automate the benchmarking process using the AWS CDK.
2.3 Create a Virtual Environment: Change directory (cd) to the cloned repository directory and create a Python virtual environment by running the following command:
cd mq-benchmarking-samplepython -m venv .venv
2.4 Activate Virtual Environment: Run the following commands to activate your virtual environment:
```
Linuxsource .venv/bin/activate# Windows..venv\Scripts\activate
``` 2.5 Install Dependencies: Install the required Python packages using:
pip install -r requirements.txt
2.6 Customize and Deploy: In this step, deploy the necessary stacks and their resources for benchmarking in your AWS account. The command ‘cdk deploy’ below deploys three stacks with resources for Amazon ECS, MQ and VPC. Deploy your application with AWS CDK using the command:
cdk deploy "*" -c container_repo_url=<YOUR CONTAINER REPO URL> -c container_repo_tag=<YOUR CONTAINER REPO TAG>
This command deploys your application with the specified Docker image. Replace
The deployment of the stacks and their resources happen in three stages. Please select “yes” at each stage to deploy the stated changes as shown below:
Deployed stacks and their resources
Optionally, you can include additional context variables in your command as seen below:
cdk deploy "*" -c vpc_cidr=10.0.0.0/16 -c mq_cidr=10.0.0.0/16 -c broker_instance_type=mq.m5.large -c mq_username=testuser -c tasks=2 -c container_repo_url=<YOUR CONTAINER REPO URL> -c container_repo_tag=<YOUR CONTAINER REPO TAG>
Note: In the example command above, the vpc_cidr specified is the same as mq_cidr. If you decide to use the above command, you will need to ensure that your vpc_cidr range is the same as your mq_cidr range. AWS recommends this as security best practice to ensure that your broker endpoint is only accessible from recognized IP ranges, see Security best practices for Amazon MQ.
More details on the above context variables:
- broker_instance_type: Represents the instance type for the Amazon MQ Broker. You can start with the instance type mq.m5.large.
- vpc_cidr: Allows you to customize the VPC’s CIDR block. The default CIDR is set to 10.42.0.0/16.
- mq_cidr: Allows you set a specific security group CIDR range for the broker. This must be set to the vpc_cidr. From the sample command above, this is set to 10.0.0.0/16. For more flexibility with source IP ranges, you can edit the broker security group of your CDK deployment.
- mq_username: Allows you to specify a username to access the ActiveMQ web console access and broker.
- tasks: Determines the number of ECS tasks (1 or more) to run your Docker image. Since the OpenWire configuration file for both consumers and producers allow you to specify the number of clients that you want, all the clients in one ECS task will share the CPU and memory allocation for that task. You have the option to run multiple ECS tasks (with multiple clients) running the benchmark in parallel.
These adjustments allow for a more customized deployment to fit specific benchmarking needs and scenarios.
2.7 Benchmarking Execution After deployment, you should see an output similar to the following:
Successful deployment of CDK application with output
1. Retrieve the TASK-ARN and access the Container
The above exec command in “outputs:” requires that you supply a
- Run the below command and note down the Task ARN (needed later):
aws ecs list-tasks --cluster <cluster-name> --region <region>
You can also retrieve this value via the Amazon ECS console by going to your ECS Cluster and choosing Tasks.
- Access the running ECS task using the ECS Exec feature with the command that is output from the CDK deployment. The command should look like the following:
aws ecs execute-command --region eu-central-1 --cluster arn:aws:ecs:eu-central-1:XXXXXXXX:cluster/ECS-Stack-ClusterEB0386A7-gRmSxC06y4ay --task <TASK-ARN> --container Benchmarking-Container --command "/bin/bash" --interactive
Before running the above command, replace the placeholder value of
After retrieving the
Directory Structure within ECS Task using ECS Exec
2. Configure the openwire-producer.properties and openwire-consumer.properties files.
Open both files. Shown below is the content of the openwire-producer.properties and openwire-consumer.properties files.
openwire-producer.properties:
sysTest.reportDir=./reports/sysTest.samplers=tpsysTest.spiClass=org.apache.activemq.tool.spi.ActiveMQReflectionSPIsysTest.clientPrefix=JmsProducersysTest.numClients=25producer.destName=queue://PERF.TESTproducer.deliveryMode=persistentproducer.messageSize=1024producer.sendDuration=300000factory.brokerURL=factory.userName=factory.password=
openwire-consumer.properties:
sysTest.reportDir=./reports/sysTest.samplers=tpsysTest.spiClass=org.apache.activemq.tool.spi.ActiveMQReflectionSPIsysTest.destDistro=equalsysTest.clientPrefix=JmsConsumersysTest.numClients=25consumer.destName=queue://PERF.TESTfactory.brokerURL=factory.userName=factory.password=
In both files, provide the brokerURL, username and password as they are required before starting the benchmarking process. The brokerURL and username can be obtained from the Amazon MQ console
Amazon MQ broker
Once you click into the deployed broker, you will find the brokerURL under the Endpoints section for OpenWire.
Endpoints in Amazon MQ console
The endpoint URL for OpenWire should be in this format:
failover:(ssl://b-xxxxxxxx-xxxx-xxxx-xxxx-xxxxxxxxxxxx-1.mq.<aws region>.amazonaws.com:61617,ssl://b-xxxxxxxx-xxxx-xxxx-xxxx-xxxxxxxxxxxx -2.mq.<aws region>.amazonaws.com:61617)
Retrieve username from Amazon MQ console
Since you are using an active/standby broker, the test would only leverage the active broker URL and not both. The failover protocol automatically manages this exchange. The password can be retrieved from the AWS Secrets Manager console or via the CLI.
The following parameters and values can be adjusted in both producer and consumer properties file to suite your use case:
- sendDuration: The sendDuration which represents the time taken for the producer/consumer test to run. Default value is set to 300000ms.
- messageSize: The messageSize which adjusts the size of messages sent is set to 1024KB by default.
- deliveryMode: The deliveryMode is set to persistent by default.
- numClients: numClients sets the number of concurrent consumers, influencing message processing speed. It is set to 25 by default.
- destName: destName represents the name of your destination queue or topic. You can change the name to your preference.
For a more comprehensive guide, refer to the mq-benchmarking-sample documentation.
2.8 Benchmark Results After populating both producer and consumer files with the required parameters, run the following maven commands (one after the other) in separate terminals to start the test:
Maven producer command:
mvn activemq-perf:producer -DsysTest.propsConfigFile=openwire-producer.properties
Maven consumer command:
mvn activemq-perf:consumer -DsysTest.propsConfigFile=openwire-consumer.properties
Once each of the above tests complete, they provide a summary of the tests in stdout as shown below:
```
####################################### SYSTEM THROUGHPUT SUMMARY #############################################System Total Throughput: 562020System Total Clients: 25System Average Throughput: 1873.4000000000003System Average Throughput Excluding Min/Max: 1860.8333333333333System Average Client Throughput: 74.936System Average Client Throughput Excluding Min/Max: 74.43333333333334Min Client Throughput Per Sample: clientName=JmsProducer19, value=2Max Client Throughput Per Sample: clientName=JmsProducer13, value=169Min Client Total Throughput: clientName=JmsProducer0, value=20224Max Client Total Throughput: clientName=JmsProducer5, value=23917Min Average Client Throughput: clientName=JmsProducer0, value=67.41333333333333Max Average Client Throughput: clientName=JmsProducer5, value=79.72333333333333Min Average Client Throughput Excluding Min/Max: clientName=JmsProducer0, value=67.04333333333334Max Average Client Throughput Excluding Min/Max: clientName=JmsProducer8, value=78.91[main] INFO org.apache.activemq.tool.reports.XmlFilePerfReportWriter - Created performance report: /app/activemq-perftest/./reports/JmsProducer_numClients25_numDests1_all.xml[INFO] ------------------------------------------------------------------------[INFO] BUILD SUCCESS[INFO] ------------------------------------------------------------------------[INFO] Total time: 5:05.052s[INFO] Finished at: Mon Apr 29 10:22:01 UTC 2024[INFO] Final Memory: 15M/60M[INFO] ------------------------------------------------------------------------
```
```
####################################### SYSTEM THROUGHPUT SUMMARY #############################################System Total Throughput: 562023System Total Clients: 25System Average Throughput: 1873.4100000000005System Average Throughput Excluding Min/Max: 1864.6599999999996System Average Client Throughput: 74.93640000000002System Average Client Throughput Excluding Min/Max: 74.58639999999998Min Client Throughput Per Sample: clientName=JmsConsumer13, value=0Max Client Throughput Per Sample: clientName=JmsConsumer13, value=105Min Client Total Throughput: clientName=JmsConsumer13, value=22475Max Client Total Throughput: clientName=JmsConsumer14, value=22495Min Average Client Throughput: clientName=JmsConsumer13, value=74.91666666666667Max Average Client Throughput: clientName=JmsConsumer14, value=74.98333333333333Min Average Client Throughput Excluding Min/Max: clientName=JmsConsumer13, value=74.56666666666666Max Average Client Throughput Excluding Min/Max: clientName=JmsConsumer14, value=74.63333333333334[main] INFO org.apache.activemq.tool.reports.XmlFilePerfReportWriter - Created performance report: /app/activemq-perftest/./reports/JmsConsumer_numClients25_numDests1_equal.xml[INFO] ------------------------------------------------------------------------[INFO] BUILD SUCCESS[INFO] ------------------------------------------------------------------------[INFO] Total time: 5:02.434s[INFO] Finished at: Mon Apr 29 10:22:02 UTC 2024[INFO] Final Memory: 14M/68M[INFO] ------------------------------------------------------------------------
``` The above output is from a test performed and shown as sample output.
System Average Throughput and System Total Clients are the most useful metrics.
In the reports directory look for two xml files with more detailed throughput metrics. In the JmsProducer_numClients25_numDests1_all.xml file for example, jmsClientSettings and jmsFactorySettings captures different broker switches.
Each of the report files captures exact test and broker environment. Keeping these files around will allow you to compare performance between different test cases and analyze how a set of configurations have impacted performance.
For this test, the average throughput for a producer is around 1873 messages per second for 25 clients. Keep in mind that the broker instance is an mq.m5.large. You can get higher throughput with more clients and a larger broker instance. This test demonstrates the concept of running fast consumers while producing messages.
More comprehensive information on the test output can be found in performance testing.
By following these guidelines and leveraging ECS Exec for direct access, you can deploy the ActiveMQ Classic Maven Performance test plugin, using AWS CDK. This setup allows you to customize and execute benchmark tests on Amazon MQ within an ECS task, facilitating an automated and efficient deployment and testing workflow.
Amazon MQ benchmarking architecture Amazon MQ for ActiveMQ brokers can be deployed as a single-instance broker or as an active/standby broker. Amazon MQ is architected for high availability (HA) and durability. For HA and broker benchmarking, AWS recommends using the active/standby deployment. After a message is sent to Amazon MQ in persistent mode, the message is written to the highly durable message store which replicates the data across multiple nodes and Availability Zones.
Cleanup To avoid incurring future charges for the resources deployed in this walkthrough, run the following command and follow the prompts to delete the CloudFormation stacks launched in 2.6 Customize and Deploy:
cdk destroy "*"
Conclusion This post provides a detailed guide on performing benchmarking for Amazon MQ for ActiveMQ brokers leveraging the ActiveMQ Classic Maven Performance test plugin. Benchmarking plays a crucial role for customers migrating to Amazon MQ, as it offers insights into the broker’s performance under conditions that mirror their existing setup. This process enables customers to fine-tune their configurations and choose the appropriate instance type that aligns with their specific use case, ensuring optimal handling of their workloads’ throughput.
Get started with Amazon MQ by using the AWS Management Console, AWS CLI, AWS Software Development Kit (SDK), or AWS CloudFormation. For information on cost, see Amazon MQ pricing.
This post is written by Anton Aleksandrov, Principal Solutions Architect, AWS Serverless
Efficient message processing is crucial when handling large data volumes. By employing batching, distribution, and parallelization techniques, you can optimize the utilization of resources allocated to your AWS Lambda function. This post will demonstrate how to implement parallel data processing within the Lambda function handler, maximizing resource utilization and potentially reducing invocation duration and function concurrency requirements.
Overview AWS Lambda integrates with various event sources, such as Amazon SQS, Apache Kafka, or Amazon Kinesis, using event-source mappings. When you configure an event-source mapping, Lambda continuously polls the event source and automatically invokes your function to process the retrieved data. Lambda makes more invocations of your function as the number of messages it reads from the event source increases. This can increase the utilized function concurrency and consume the available concurrency in your account. Click the links to learn more about how Lambda consumes messages from SQS queues and Kinesis streams.
To improve the data processing throughput, you can configure event-source mapping batch window and batch size. These settings ensure that your function is invoked only when a sufficient number of messages have accumulated in the event source. For example, if you configure a batch size of 100 messages and a batch window of 10 seconds, Lambda will invoke your function when either 100 messages have accumulated or 10 seconds have elapsed, whichever happens first.
Event source mapping event batching
By processing messages in batches, rather than individually, you can improve throughput and optimize costs by reducing the number of polling requests to event sources and the number of function invocations. For instance, processing a million messages without batching would require one million function invocations, but configuring a batch size of 100 messages can reduce the number of invocations to 10,000.
Optimizing batch processing within the Lambda execution environment Each Lambda execution environment processes one event per invocation. With batching enabled, the event object Lambda sends to the function handler contains an array of messages retrieved and batched by the event-source mapping. Once an execution environment starts processing an event object containing a batch of messages, it won’t handle additional invocations until the current one is complete. However, simply iterating over the array of messages and processing them one by one may not fully utilize the allocated compute resources. This can lead to underutilized or idle compute resources, like CPU capacity, and hence longer overall processing times.
Underutilized Lambda environments
Underutilization of compute resources can be generally caused by two things – non-CPU-intensive blocking tasks, such as sending HTTP requests and waiting for responses, and single-threaded processing when you have more than one vCPU core. To address these concerns and maximize resource utilization, you can implement your functions to process data in parallel. This allows more efficient utilization of the allocated compute capacity, reducing invocation duration, time spent idle, and the total concurrency required. In addition, when you allocate more than 1.8GB of memory to your function, it also gets more than one vCPU, which allows threads to land on separate cores for even better performance and true parallel processing.
Improved concurrency in Lambda environment
When processing messages sequentially with a low compute utilization rate, reducing memory allocation may seem intuitive to save costs. This, however, can result in slower performance due to less CPU capacity being allocated. When your function is parallelizing data processing within the execution environment, you’re getting a higher compute utilization rate, and since raising the memory allocation also provides additional CPU capacity, it can lead to better performance. Use the Lambda Power Tuning tool to find the optimal memory configuration, balancing cost with performance.
Understanding the Lambda execution environment lifecycle After processing an invocation, the Lambda execution environment is “frozen” by the Lambda service. Lambda runtime considers the invocation complete and “freezes” the execution environment when your function handler returns.
When the Lambda service is looking for an execution environment to process a new incoming invocation, it will first try to “thaw” and use any available execution environments that were previously “frozen”. This cycle repeats until the execution environment is eventually shut down.
Lambda worker lifecycle over time
Implementing parallel processing within the Lambda execution environment You can implement parallel processing by running multiple threads in your function handler, but if those threads are still running when the handler returns, then they will be “frozen” together with the execution environment until the next invocation. This can lead to unexpected behavior, where the execution environment is “thawed” to process a new invocation, however, it still has background threads running and processing data from previous invocations. If you do not handle this properly, the behavior can cascade across multiple invocations, leading to delayed or unfinished processing and complicated debugging.
Threads frozen before finishing
To address this concern, you need to ensure that the background threads you spawn in the function handler are done processing data before returning from the handler. All threads spawned within a particular invocation must complete within the same invocation in order not to spill over to subsequent invocations. This is illustrated in the following diagram. You can see threads start and end within the same invocation, and only once all threads have finished, the function handler returns.
Threads returning before end of invoke
Sample code Programming languages offer diverse techniques and terminology for parallel and concurrent processing. Java employs multi-threading and thread pools. Node.js, though single-threaded, provides event loop and promises (for async programming), as well as child processes and worker threads (for actual multi-threading). Python supports both multi-threading (subject to Global Interpreter Lock) and multi-processing. Concurrent routines is another technique gaining attention.
The following sample is provided for illustration purposes only and is based on Node.js promises running concurrently. The sample code uses a language-agnostic term “worker” to denote a unit of parallel processing. Your specific parallelization implementation depends on your choice of runtime language and frameworks. AWS recommends you use battle-tested frameworks like Powertools for AWS Lambda that implement concurrent batch processing when possible. Regardless of the programming language, it is crucial to ensure all background threads/workers/promises/routines/tasks spawned by the function handler are completed within the same invocation before the handler returns.
Sample implementation with Node.js
const NUMBER_OF_WORKERS = 4;export const handler = async (event) => { const workers = []; const messages = event.Records; // For handling partial batch processing errors const batchItemFailures = []; for (let i=0; i<NUMBER_OF_WORKERS;i++){ // No await here! The waiting will happen later const worker = spawnWorker(i, messages, batchItemFailures); workers.push(worker); } // This line is crucial. This is where the handler // waits for all workers to complete their tasks const processingResults = await Promise.allSettled(workers); console.log('All done!'); // Return messageIds of all messages that failed // to process in order to retry return {batchItemFailures};};async function spawnWorker(id, messages, batchItemFailures){ console.log(`worker.id=${id} spawning`); while (messages.length>0){ const msg = messages.shift(); console.log(`worker.id=${id} processing message`); try { // A blocking, but not CPU-intensive operation await processMessage(msg); } catch (err){ // If message processing failed, add it to // the list of batch item failures batchItemFailures.push({ itemIdentifier: msg.messageId}); } }}
See the sample code and AWS Cloud Development Kit (CDK) stack at github.com.
Testing results The following chart illustrates a Lambda function processing messages using an SQS event-source mapping. After enabling message processing with 4 workers, the invocation duration and concurrent executions dropped to 1/4th of the previous value, while still processing the same number of messages per second. Thanks to parallelization, the new function is faster and requires less concurrency.
Function performance dashboard
Looking at the invocation log, you can see that the function handler has spawned four workers, and all of them were completed before the handler returned the result. You can also see that although the handler received 20 items, with each item taking 200ms to process, the overall duration is only 1000ms. This is because items were processed in parallel (20 items * 200ms / 4 workers = 1000ms total processing time).
START RequestId: (redacted) Version: $LATEST2024-06-18T03:18:03.049Z INFO Got messages from SQS2024-06-18T03:18:03.049Z INFO messages.length=202024-06-18T03:18:03.049Z INFO worker.id=0 spawning2024-06-18T03:18:03.049Z INFO worker.id=0 processing message2024-06-18T03:18:03.049Z INFO worker.id=1 spawning2024-06-18T03:18:03.049Z INFO worker.id=1 processing message2024-06-18T03:18:03.050Z INFO worker.id=2 spawning2024-06-18T03:18:03.050Z INFO worker.id=2 processing message2024-06-18T03:18:03.050Z INFO worker.id=3 spawning2024-06-18T03:18:03.050Z INFO worker.id=3 processing message2024-06-18T03:18:03.250Z INFO worker.id=0 processing message2024-06-18T03:18:03.250Z INFO worker.id=1 processing message(redacted for brevity)2024-06-18T03:18:03.852Z INFO worker.id=1 processing message2024-06-18T03:18:03.852Z INFO worker.id=2 processing message2024-06-18T03:18:03.852Z INFO worker.id=3 processing message2024-06-18T03:18:04.052Z INFO All done!END RequestId: (redacted)REPORT RequestId: (redacted) Duration: 1004.48 ms
Considerations * The technique and samples described in this post assume unordered message processing. In case you use ordered event sources, such as SQS FIFO Queues, and require preserving message order, you will need to address that in your implementation code. One technique might be creating a separate thread for each messageGroupId.
* While providing performance and cost benefits, multi-threading and parallel processing is an advanced technique that requires proper error handling. Lambda supports partial batch responses, where you can report back to the event source that specific messages from the batch failed to be processed so they can be retried. You can collect failed message IDs from each thread and return them as your function handler response. This is illustrated in the sample above. See Handling errors for an SQS event source in Lambda and Best Practices for implementing partial batch responses for additional details.
Conclusion Efficiently processing large volumes of data implies efficient resource utilization. When processing batches of messages from event sources, validate whether your function would benefit from parallel or concurrent processing within the function handler thus increasing the compute capacity utilization rate. With a high compute capacity utilization rate, you can allocate more memory to your function, thus getting more CPU allocated as well, for faster and more efficient processing. Use frameworks like Powertools for AWS Lambda that implement concurrent batch processing when possible, and use the Lambda Power Tuning tool to find the best memory configuration for your functions, balancing performance and cost.
For more serverless learning resources, visit Serverless Land.
This post is written by Craig Warburton, Senior Solutions Architect, Hybrid. Sedji Gaouaou, Senior Solutions Architect, Hybrid. Brian Daugherty, Principal Solutions Architect, Hybrid.
Migrating workloads to AWS Outposts rack offers you the opportunity to gain the benefits of cloud computing while keeping your data and applications on premises.
For organizations with strict data residency requirements, by deploying AWS infrastructure and services on premises, you can keep sensitive data and mission-critical applications within your own data centers or facilities, helping ensure compliance with data sovereignty laws and regulatory frameworks.
On the other hand, if your organization does not have stringent data residency requirements, you may opt for a hybrid approach, using both Outposts rack and the AWS Regions. With this flexibility, you can process and store data in the most appropriate location based on factors such as latency, cost optimization, and application requirements.
In this post, we cover the best options to migrate your workloads to Outposts rack, taking into account your specific data residency requirements. We explore strategies, tools, and best practices to enable a successful migration tailored to your organization’s needs.
Overview AWS has a number of services to help you migrate and rehost workloads, including AWS Migration Hub, AWS Application Migration Service, AWS Elastic Disaster Recovery. Alternatively, you can use backup and recovery solutions provided by AWS partners.
At AWS, we use the 7 Rs framework to help organizations evaluate and choose the appropriate migration strategy for moving applications and workloads to the AWS Cloud. The 7 Rs represent:
- Rehosting (rehost or lift and shift)
- Replatforming (lift, tinker, and shift)
- Repurchasing (republish or re-vendor)
- Refactoring (re-architecting)
- Retiring
- Retaining (revisit)
- Relocating (remigrate).
This post focuses on rehosting and the services available to help rehost on-premises applications to Outposts rack.
Before getting started with any migration, AWS recommends a three-phase approach to migrating workloads to the cloud (AWS Region or Outposts rack). The three phases are assess, mobilize, and migrate and modernize.
Figure 1: Diagram showing the three migration phases of assess, mobilize, and migrate and modernize
This post describes the steps that you can take in the migrate and modernize phase. However, the assess and mobilize phases are also critical to allow you to understand what applications will be migrated, the dependencies between them, and the planning associated with how and when migration will occur.
AWS Migration Hub is a cloud migration service provided by AWS that helps organizations accelerate and simplify the process of migrating workloads to AWS. It provides a unified location to track the progress of application migrations across multiple AWS and partner services. This service can be used to help work through all three phases of migration, and we recommend that you start with this service and complete each phase accordingly. The assess phase should help you identify any applications that require consideration when migrating (including any data residency requirements), and the mobilize phase defines the approach to take.
Workload migration to AWS Outposts rack: With staging environment in an AWS Region After deploying an Outpost rack to your desired on-premises location, you can perform migrations of on-premises systems and virtual machines using either Application Migration Service or third-party backup and recovery services. Both scenarios are described in the following sections.
Scenario 1: Using AWS Application Migration Service Application Migration Service is able to lift and shift a large number of physical or virtual servers without compatibility issues, performance disruption, or long cutover windows.
In this scenario, at least one Outpost rack is deployed on premises with the following prerequisites:
- At least one Outpost rack installed and activated
- The Outposts rack must be in Direct VPC Routing (DVR) mode
- VPC in Region containing subnet for staging resources
- VPC extended to the Outposts rack containing subnet for target resources
- An AWS Replication Agent installed on each source server
The following diagram shows the solution architecture and includes the on-premises servers that will be migrated from the local network to the Outposts rack. It also includes the staging VPC in Region used to deploy the replication servers, Amazon S3 to store the Amazon EBS snapshots and the target VPC extended to Outposts rack.
Figure 2: Architecture diagram showing migration with Application Migration Service
Step 1: Outposts rack configuration
You can work with AWS specialists to size your Outpost for your workload and application requirements. In this scenario, you don’t need additional Outposts rack capacity for the migration because the staging area will be deployed in the Region (see 1 in Figure 2).
Step 2: Prepare Application Migration service
Set up Application Migration Service from the console in the Region your Outposts rack is anchored to. If this is your first setup, choose Get started on the AWS Application Migration Service console. When creating the replication settings template, make sure your staging area is using subnets in the parent Region (see 2 in Figure 2).
Step 3: Install the AWS Replication Agent to the source servers or machines
For large migrations, source servers may have a wide variety of operating system versions and may be distributed across multiple data centers. AWS Application Migration Service offers the MGN connector, a feature that allows you to automate running commands on your source environment. Finally, ensure that communication is possible between the agent and Application Migration Service (see 3 in Figure 2).
In the following image, there is an example of deploying the AWS Replication Agent providing the required parameters (Region, AWS access key and AWS secret access key).
Once the AWS Replication Agent is installed, the server will be added to the AWS Application Migration Service console. Next, it will undergo the initial sync process, which will be completed when showing the Ready for testing lifecycle state in the Application Migration Service console.
Step 4: Configure launch settings
Prior to testing or cutting over an instance, you must configure the launch settings by creating Amazon Elastic Compute Cloud (Amazon EC2) launch templates, ensuring that you select your extended virtual private cloud (VPC) and subnet deployed on Outposts rack and using an appropriate, available instance type (see 4 in Figure 2).
To identify EC2 instances configured on your Outpost, you can use the following AWS Command Line Interface (AWS CLI):
Outposts get-outpost-instance-types \
--outpost-id op-abcdefgh123456789
The output of this command lists the instance types and sizes configured on your Outpost:
InstanceTypes:
- InstanceType: c5.xlarge
- InstanceType: c5.4xlarge
- InstanceType: r5.2xlarge
- InstanceType: r5.4xlarge
With knowledge of the instance types configured, you can now determine how many of each are available. For example, the following AWS CLI command, which is run on the account that owns the Outpost, lists the number of c5.xlarge instances available for use:
aws cloudwatch get-metric-statistics \
--namespace AWS/Outposts \
--metric-name AvailableInstanceType_Count \
--statistics Average --period 3600 \
--start-time $(date -u -Iminutes -d '-1hour') \
--end-time $(date -u -Iminutes) \
--dimensions \
Name=OutpostId,Value=op-abcdefgh123456789 \
Name=InstanceType,Value=c5.xlarge
This command returns:
Datapoints:
- Average: 10.0
Timestamp: '2024-04-10T10:39:00+00:00'
Unit: Count
Label: AvailableInstanceType_Count
The output indicates that there were (on average) 10 c5.xlarge instances available in the specified time period (1 hour). Using the same command for the other instance types, you discover that there are also 20 c5.4xlarge, 10 r5.2xlarge, and 6 r5.4xlarge available for use in completing the required EC2 launch templates.
Step 5: Install AWS Systems Manager Agent in your on your target instances
Once the launch settings are defined, you must activate the post-launch actions for either a specific server or all the servers. You must leave the Install the Systems Manager agent and allow executing actions on launched servers option toggled on in order for post-launch actions to work. Untoggling the option would disallow Application Migration Service to install the AWS Systems Manager Agent (SSM Agent) on your servers, and post-launch actions would no longer be executed on them (see 5 in Figure 2).
Figure 3: Post-launch actions on the Application Migration Service console
Step 6: Testing and cutover
Once you have configured the launch settings for each source server, you are ready to launch the servers as test instances. Best practice is to test instances before cutover.
Figure 4: Application Migration Service console ready to launch test instances
Finally, after completing the testing of all the source servers, you are ready for cutover (see 6 on Figure 2). Prior to launching cutover instances, check that the source servers are listed as Ready for cutover under Migration lifecycle and Healthy under Data replication status.
Figure 5: Application Migration Console ready for cutover
To launch the cutover instances, select the instances you want to cutover and then select Launch cutover instances under Cutover (see Figure 5). The AWS Application Migration Service console will indicate Cutover finalized when the cutover has completed successfully, the selected source servers’ Migration lifecycle column will show the Cutover complete status, the Data replication status column will show Disconnected, and the Next step column will show Mark as archived. The source servers have now been successfully migrated into AWS. You can now archive your source servers that have launched cutover instances.
Scenario 2: Using partner backup and replication solutions You may already be using a third-party or AWS Partner solution to create on-premises backups of bare-metal or virtualized systems. These solutions often use local disk-arrays or object stores to create tiered backups of systems covering restore-points going back years, days, or just a few hours or minutes.
These solutions may also have inherent capabilities to restore from these backups directly to the AWS, enabling migration of on-premises systems to EC2 instances deployed to Outposts rack.
In the scenario illustrated in Figure 6, the partner backup and replication service (BR) creates backups (see 1 in Figure 6) of virtual machines to on-premises disk or object storage repositories. Using the service’s AWS integration, virtual machines can be restored (see 2 in Figure 6) to an EC2 instance deployed on Outposts rack, which is also on premises. The restoration may follow a process that uses helper instances and volumes (see 3 in Figure 6) during intermediate steps to create Amazon Elastic Block Store (Amazon EBS) snapshots (see 4 in Figure 6) and then Amazon Machine Images (AMIs) of the systems being migrated (see 5 in Figure 6), which are ultimately deployed (see 6 in Figure 6) to Outposts rack.
Figure 6: Architecture diagram of the partner backup and replication scenario
When performing this type of migration, there will typically be a stage where you are asked to specify parameters defining the target VPC and subnets. These should be the VPC being extended to the Outpost and a subnet that has been created in that VPC on the Outpost. You will also need to specify an EC2 instance type that is available on the Outpost, which can be discovered using the process described in the previous section.
Workload migration to AWS Outposts rack: With staging environment on an AWS Outpost rack Data residency can be a critical consideration for organizations that collect and store sensitive information, such as personally identifiable information (PII), financial data or medical records. AWS Elastic Disaster Recovery, supported on Outposts rack, helps enable seamless replication of on-premises data to Outposts rack and addresses data residency concerns by keeping data within your on-premises environment, using Amazon EBS and Amazon S3 on Outposts.
In this scenario, an Outpost rack is deployed on premises with the following prerequisites:
- At least one Outpost rack installed and activated
- The Outposts rack must be in Direct VPC Routing (DVR) mode
- VPC extended to the Outposts rack containing subnets for staging and target resources
- Amazon S3 on Outposts (required for all Elastic Disaster Recovery replication destinations)
- An AWS Replication Agent installed on each source server.
The following diagram shows the solution architecture and includes the on-premises servers that will be migrated from the local network to the Outposts rack. It also includes the staging VPC used to deploy the replication servers on Outposts rack, Amazon S3 on Outposts to store the local Amazon EBS snapshots and the target VPC extended to Outposts rack.
Figure 7: Architecture diagram for workflow migration to AWS Outposts rack
Step 1: Outposts rack configuration
To use Elastic Disaster Recovery on Outposts rack, you need to configure both Amazon EBS and Amazon S3 on Outposts to support nearly continuous replication and point-in-time recovery for your workload needs (see 1 in Figure 7). Specifically, you need to size Amazon EBS and Amazon S3 on Outposts capacity according to your workload capacity requirements and application interdependencies. To do this, you can define dependency groups–each dependency group is a collection of applications and their underlying infrastructure with technical or non-technical dependencies. A 2:1 ratio is recommended for the EBS volumes to be used for near-continuous replication; a 1:1 ratio is recommended for the Amazon S3 on Outposts ratio for EBS snapshots. For example, to migrate 40 terabytes (TB) of workloads, you need to plan for 80TB of EBS volumes and 40TB of S3 on Outposts capacity.
Step 2: Extend VPC to your Outposts rack
Once your Outpost has been provisioned and is available, extend the required Amazon Virtual Private Cloud (Amazon VPC) connection to the Outpost from the Region by creating the desired staging and target subnets (see 2 in Figure 7).
Step 3: Prepare AWS Elastic Disaster Recovery service
Prepare the AWS Elastic Disaster Recovery service from the AWS console to set the default replication and launch settings. When defining these settings, make sure that the Outposts resources available are chosen for staging and target subnets and instance and storage type (see 3 in Figure 7).
Step 4: Install the AWS Replication Agent to the source servers or machines
The next phase will be to install the AWS Replication Agent to the source servers and to ensure that communication is possible between the replication agent and your Outposts replication subnet through the Outposts local gateway to ensure that replication traffic uses the local network (see 4 in Figure 7).
Step 5: Continuous block-level replication
Staging area resources are automatically created and managed by Elastic Disaster Recovery. Once the AWS Replication Agent has been deployed, continuous block-level replication (compressed and encrypted in transit) will occur (see 5 in Figure 7) over the local network.
Step 6: Launch Outposts rack resources
Finally, migrated instances can now be launched using Outposts rack resources based on the launch settings defined previously (see 6 in Figure 7).
Conclusion In this post, you have learned how to migrate your workloads from your on-premises environment to Outposts rack based on your specific data residency requirements. When you have the flexibility of using Regional services, AWS migration services or partner solutions can be used with infrastructure already in place. If your data must stay on-premises, using AWS Elastic Disaster Recovery allows you to migrate your data without using Regional services, allowing you to migrate to Outposts rack without your data leaving the boundary of a certain geographic location.
To learn more about an end-to-end migration and modernization journey, visit AWS Migration Hub.
This post is written by Dhiraj Mahapatro, AWS Principal Specialist SA, Serverless.
AWS Step Functions provides enhanced security with a customer-managed AWS KMS key. This allows organizations to maintain complete control over the encryption keys used to protect their data in Step Functions, ensuring that only allowed principals (IAM role, user, or a group) have access to the sensitive information that is processed in a state machine. This post explores the details of this feature and the new console experience of executing Step Functions workflows when a customer-managed KMS key is used.
Step Functions is a serverless orchestration service that enables you to coordinate multiple AWS services, microservices, and third-party integrations into business-critical applications. Step Functions is widely used for orchestrating complex workflows, such as loan processing, fraud detection, risk management, and compliance processes. By breaking down these processes into a series of steps, Step Functions provides a clear overview and control of the entire workflow. This ensures that it executes each stage correctly and in the right order. One of the critical aspects of using Step Functions in regulated industries is the importance of security and data protection. Step Functions manages sensitive customer data, including PII and financial records, and require protection against unauthorized access and data breaches. Enabling a customer-managed KMS key further strengthens the data security in a state machine.
Using customer-managed AWS KMS keys With this launch, Step Functions enable encryption of the state machine definition and execution details, including event history using customer-managed symmetric KMS keys. As part of this feature, you also have the option to encrypt Step Functions activities using customer-managed key.
This post uses a sample application to show the implementation details of this new feature. See user guide for a detailed explanation of this feature.
The sample application shows a basic stock trading example where the state machine buys or sells a stock if the price of the stock is above or below 50 and finally saves the transaction.
Example workflow
The Step Functions Cloudformation resource of the state machine has a new property EncryptionConfiguration as shown in the following:
StockTradingStateMachine: Type: AWS::StepFunctions::StateMachine Properties: StateMachineName: !FindInMap ['StateMachine', 'Name', 'Value'] RoleArn: !GetAtt StockTradingStateMachineExecutionRole.Arn EncryptionConfiguration: KmsKeyId: !Ref StocksKmsKey KmsDataKeyReusePeriodSeconds: 100 Type: CUSTOMER_MANAGED_KMS_KEY Definition: . . .
Within EncryptionConfiguration, you specify the KmsKeyId and the Type. This sample application uses a CUSTOMER_MANAGED_KMS_KEY key type. The Type is a required field and it will be AWS_OWNED_KEY if it is not a customer managed key. The state machine also allows to specify the KmsDataKeyReusePeriodSeconds property to a value between 60 and 900 seconds (default: 300), which signifies the maximum duration for which the state machine reuses the data keys. When the period expires, Step Functions will call GenerateDataKey API on AWS KMS. Therefore, besides kms:Decrypt, Step Functions needs access to kms:GenerateDataKey action.
The sample application also creates a customer-managed KMS key with a condition to force the stock trading state machine to only use the key.
Security controls Within an AWS Organization setup, the best practices guidance is to have a dedicated security organizational unit responsible for managing and enforcing security standards, including ownership of KMS keys. The security account provides cross-account access for the key usage. You grant admin access only to the root of the security account, while external or member accounts can access it for various purposes like decryption, encryption, description, and data key generation. This can be done through an IAM Role, User, or Group in the member account. The standard approach for cross-account access involves combining KMS key policies in the security account and IAM policies to the identity that gives permission for the service in the member account.
Cross account access
For Step Functions, you can go a step further to restrict access to the caller’s role in the member account and provide a condition. The condition forces Step Functions service to only use the key. For example, with a security account (id: 1111111111) and a member account (id: 1234567890), the KMS key policy can use a kms:ViaService condition to restrict access to Step Functions state machines present in us-east-1 region only:
{ "Sid": "Allow access to member account via Step Functions service", "Effect": "Allow", "Principal": { "AWS": "arn:aws:iam::1234567890:role/MemberAccountRole" }, "Action": ["kms:Decrypt", "kms:GenerateDataKey"], "Resource": "*", "Condition": { "StringEquals": { "kms:ViaService": "states.us-east-1.amazonaws.com" } }}
Constantly updating the key policy for every new Step Functions workflow in member accounts is cumbersome. Therefore, a combination of KMS key policy and IAM roles grants fine-grained and least-privilege access to key actions. For organizations that do not have a security account or security organizational unit, the member account owns the KMS key, as shown below. The key policy must be more restrictive to the Step Functions execution role and the Step Functions ARN that will use the key.
Member account ownership
For example, a member account with an account id 1234567890 sets the Step Functions execution role sfn-execution-role as the Principal and restricts the key usage to a specific Step Functions ARN in the same account by using kms:EncryptionContext:aws:states:stateMachineArn condition as shown in the following:
{ "Effect": "Allow", "Principal": { "AWS": "arn:aws:iam::1234567890:role/sfn-execution-role" }, "Action": ["kms:Decrypt", "kms:GenerateDataKey"], "Resource": "*", "Condition": { "StringEquals": { "kms:EncryptionContext:aws:states:stateMachineArn": "arn:aws:states:us-east-1:1234567890:stateMachine:MyStateMachine" } }}
Testing To setup the application in your AWS account, you need the following tools:
- AWS CLI
- AWS SAM CLI
- Install Node.js 20, including the NPM package management tool
Clone the git repository. To build and deploy your application for the first time, run the following in your shell from the repository home directory:
sam build && sam deploy –guided
You can find the State Machine’s ARN in the output values displayed after deployment.
Once deployed, run the application using the AWS CLI. Run the following command after replacing the state machine ARN from the output of the deployment and the region where you have the state machine:
aws stepfunctions start-execution \ --state-machine-arn <state-machine-arn> \ --region <region>
You get a successful response in the CLI. You can also see a corresponding execution listed in the AWS Console as RUNNING:
Running workflow
However, opening the execution details will show an “Access Denied” error as expected:
Access denied error
You get the same error while visualizing the Step Functions definition or editing the state machine. The sample application restricts the decryption by the KMS key to only the Step Functions workflow’s execution role. Therefore, any other entity cannot decrypt the state machine’s workflow execution details and the state machine’s definition. This secures the exposure of information, including the payload passed to Step Functions or the payload passed in between state transitions to external entities. This new feature will securely allow personally identifiable information (PII), credit card information (PCI), and other similar sensitive information in Step Functions. Existing sensitive workloads are now unlocked for Step Functions, therefore easing, making them AWS cloud native.
You can integrate Amazon CloudWatch Logs with Step Functions for logging and monitoring capabilities. To send logs, you must provide access for log delivery to decrypt your logs. In your State Machine customer-managed key policy, you must grant kms:decrypt permission to the principal delivery.logs.amazonaws.com. Logging a workflow will not work without above grant. You encrypted data is sent to CloudWatch logs with the same or different customer managed KMS key. See CloudWatch logs documentation to learn how to set permissions on the KMS key for your log group.
Cleanup To delete the sample application, use the latest version of the AWS SAM CLI and run:
sam delete
Conclusion Customer-managed AWS KMS keys in Step Functions allows for access contorol sensitive data. KMS key policy and IAM identity policies determine who decrypts and access various aspects of the state machine, including the definition, execution details, and input/output payload transitions for each task. This is an essential feature for highly regulated industries like financial services. Apply these security guardrails using customer-managed AWS KMS keys at the organizational unit, business unit, or at the individual account level.
The sample application shows a way of using the customer managed KMS key in Step Functions resource in CloudFormation. The user guide provides additional details. Support for this feature is available in AWS CDK now while Terraform support will fast follow. Dive deeper into additional details from the Step Functions user guide.
For more serverless learning resources, visit Serverless Land.
This post is written by Vignesh Selvam (Senior Product Manager – Amazon MQ), Simon Unge (Senior software development engineer – Amazon MQ).
Amazon MQ for RabbitMQ announced support for quorum queues, a type of replicated queue designed for higher availability and data safety. This post presents an overview of this queue type, describes when you should use it, and best practices you can follow. The post also describes how Amazon MQ has also improved quorum queues in the open-source RabbitMQ community.
Overview of quorum queues A quorum queue is a replicated first in, first out queue type offered by open-source RabbitMQ that uses the Raft consensus algorithm to maintain data consistency. Each quorum queue has a leader and multiple followers (replicas), which ensure that messages are replicated and persisted across a majority of nodes, thus providing resilience against node failures. Quorum queues only need a majority of member nodes (a quorum) to make decisions about data. If a RabbitMQ node hosting a leader becomes unavailable, another node hosting one of the followers is automatically elected as the leader. Once the node becomes available again, the node will become a follower for the quorum queue and catch up or synchronize with the new leader. Quorum queues can detect network failures faster and recover quicker than classic mirrored queues, thus improving the resiliency of the message broker as a whole.
Quorum queues share most of the fundamental features that are key to RabbitMQ replicated queue types such as consumption, consumer acknowledgements, cancelling consumers, purging and deletion. Poison message handling is a unique feature of quorum queues which help developers manage unprocessed messages more efficiently. A poison message is a message that cannot be processed and ends up being repeatedly requeued. Quorum queues keep track of the number of unsuccessful delivery attempts and expose it in the ‘x-delivery-count’ header that is included with any redelivered message. A delivery limit can be set using a policy argument for ’delivery-limit’. If the limit is reached, the message can be dropped or put in a dead-letter queue. This feature further improves the data reliability of a quorum queue.
You can get started with quorum queues by explicitly specifying the ‘x-queue-type’ parameter as ’quorum’ on a RabbitMQ broker running version 3.13 and above. We recommend that you change the default vhost queue type to ’quorum’ to ensure that all queues are created as quorum queues by default inside a vhost.
RabbitMQ queues console
When should you use quorum queues? You should use quorum queues when you need higher availability and consistency for their messaging infrastructure. Quorum queues are ideal for scenarios where data durability and fault tolerance are critical, such as financial transaction systems, e-commerce data processing systems, or any application requiring high reliability. They are particularly beneficial in environments where node failures are more likely or where maintaining data consistency across distributed systems is essential.
When should you NOT use quorum queues? Quorum queues are not meant to be temporary. They do not support transient or exclusive queues and are not meant to be used in scenarios with high queue churn (declaration and deletion rates). They are also not recommended for unreplicated queues.
Best practices for quorum queues Quorum queues perform better when the queues are short. You can set the maximum queue length using a policy or queue arguments to limit the total memory usage by queues (max-length, max-length-bytes).
Add a new queue dialog
Amazon MQ recommends publishers to use publisher confirms and consumers to use manual acknowledgements on quorum queues. Publisher confirms will only be issued once a published message has been successfully replicated to a quorum of nodes and is considered safe within the context of the system. Publisher confirms can also serve as a form of back pressure and protect the availability of the broker during periods of high workload. Manual acknowledgements are used to ensure messages that are not processed can be returned to the queue for reprocessing.
Open-source improvements by Amazon MQ Amazon MQ contributed multiple improvements to the open-source RabbitMQ community to improve quorum queues for operators and users.
Automatic membership reconciliation
Quorum queues depend on a majority of replicas being available for the Raft consensus algorithm. Amazon MQ identified that many users and operators would prefer to maintain a certain minimal number of replicas (generally 3 or 5) at all times to ensure a majority always exists. The quorum queue replica management was also initially available only via CLI tools. Amazon MQ engineers introduced automatic membership reconciliation to improve this experience. Now, RabbitMQ can be configured to identify any queues that are below a target group member size, and automatically grow or add a node to the queue members. Thus ensuring a certain minimum number of replicas always exist.
Voter status
RabbitMQ considers a quorum queue member node to be a full member even if the member has not caught up or fully synced to the quorum. The CLI command rabbitmq-queues check_if_node_is_ quorum_critical can provide a false positive, and indicate a node is safe to remove, even though another node has queue members that are still synchronizing to the quorum. Amazon MQ introduced a new ‘non-voter’ state for a queue member node to indicate a member that is still catching up or synchronizing to the quorum. If a queue has a member in this state, it is not considered a full member. Once the member is fully synchronized, it is automatically promoted to the voter status, and is considered a full member. The command rabbitmq-queues check_if_node_is_quorum_critical now takes this into account and correctly reports if a node can be safely terminated without any queues becoming unavailable due to a loss of majority.
Inconsistent state management When a broker is overloaded, a quorum queue can end up in an inconsistent state, where the quorum queue membership state stored in the Raft state machine differs from the RabbitMQ internal state for the queue. Amazon MQ introduced a periodic check per quorum queue that identifies if a queue has an inconsistent state and takes action to fix it.
Default queue type
The default queue type for a RabbitMQ broker vhost was classic queues. You could declare a different queue type by explicitly stating the ’x-queue-type’ as a queue creation argument. Amazon MQ introduced a global default queue type in the configuration file (rabbit.conf) that provides the ability to define a default queue type at the broker level. Now, an operator can change the default queue type to quorum queues if not specified during creation.
Membership management permissions
RabbitMQ users are able to configure the quorum queue membership using the management API. This can interfere with automatic membership reconciliation. Amazon MQ introduced the ability for an operator to turn off the membership management permissions available through the management API. Thus, preventing customers from accidentally affecting their broker.
Conclusion Quorum queues on RabbitMQ provide a robust solution for scenarios requiring high availability and resilience. By leveraging the Raft consensus protocol, quorum queues ensure that messages are safely stored and replicated across a quorum of nodes, making them an excellent choice for modern, distributed message queuing systems.
Amazon MQ recommends that you adopt quorum queues as the preferred replicated queue type on RabbitMQ 3.13 brokers. For more details, see Amazon MQ documentation. To know more about the open-source feature, see quorum queues.
Get started with quorum queues on Amazon MQ for RabbitMQ 3.13 with a few clicks.
This post is written by Marcos Ortiz, Principal AWS Solutions Architect and Khubyar Behramsha, Sr. AWS Solutions Architect.
In this post, you learn how organizations can evolve from a single-Region architecture API Gateway to a multi-Region one, using a reliable failover mechanism without dependencies on AWS control plane operations. An AWS Well-Architected best practice is to rely on the data plane and not the control plane during recovery. Failover controls should work with no dependencies on the primary Region. This pattern shows how to independently failover discrete services deployed behind a shared public API. Additionally, there is a walkthrough on how to deploy and test the proposed architecture, using our open-source code available on GitHub.
For many organizations, running services behind a Regional Amazon API Gateway endpoint aligned to AWS Well-Architected best practices, offers the right balance of resilience, simplicity, and affordability. However, depending on business criticality, regulatory requirements, or disaster recovery objectives, some organizations must deploy their APIs using a multi-Region architecture.
When dealing with business-critical applications, organizations often want full control over how and when to trigger a failover. A manually triggered failover allows for dependencies to be failed over in a specific order. Failover actions follow the chain of approvals needed, which helps prevent failing over to an unprepared replica or other flapping issues caused by intermittent disruptions. While the failover action or trigger has a human-in-the-loop component, the recommendation is for all subsequent actions to be automated as much as possible. This approach gives application owners control over the failover process, including the ability to trigger the failover in cases of intermittent issues.
Overview One common approach for customers is to deploy a public Regional API with a custom domain name, providing more intuitive URLs for their users. The backend uses API mappings to connect multiple API stages to a custom domain. This approach allows service owners to deploy their services independently while sharing the same top-level API domain name. Here is a typical architecture that follows this pattern:
Regional endpoint with mapping
However, when trying to evolve this to a multi-Region architecture, organizations often struggle to fail over each service independently. If the preceding architecture is deployed in two Regions as-is, it becomes an all-or-nothing scenario, where organizations must either fail over all the services behind API Gateway or none.
Evolving to a multi-Region architecture To enable each team to manage and failover their services independently, you can implement this new approach for a multi-Region architecture. Each service has its own subdomain, using API Gateway HTTP integrations to route the request to a given service. This allows the service APIs the flexibility to be independently failed over, or all at once, with the shared public API.
Multi-Region architecture
This is the request flow:
- Users access a specific service through the public shared API domain name using a URL suffix. For instance, to access service1, the end user would send a request to http://example.com/service1.
- Amazon Route 53 has the top-level domain, example.com, registered with a primary and a secondary failover record. It routes the request to the API Gateway external API endpoint in the primary Region (us-east-1).
- API Gateway uses an HTTP integration to forward the request to service1 at https://service1.example.com.
- Amazon Route 53, has the domain service1.example.com registered with a primary and a secondary failover record. It routes the request to the API Gateway service1 API Regional endpoint in the primary Region (us-east-1) when healthy and routes to the service1 API Regional endpoint in the secondary Region (us-west-2) when unhealthy.
- Represents the primary route for service1 configured in Amazon Route 53.
- Represents the secondary route for service1 configured in Amazon Route 53.
This solution requires deploying each service API in both the primary (us-east-1) and secondary (us-west-2) Regions. Both Regions use the same custom domain configuration. For the primary Region, primary DNS records for each service point to the Regional API Gateway distribution endpoint. In the secondary Region, secondary DNS records for each service point to the Regional API Gateway distribution endpoint in the secondary Region.
Route 53 records
Active-passive manual failover The example provided here enables a reliable failover mechanism that does not rely on the Amazon Route 53 control plane. It uses Amazon Route 53 Application Recovery Controller (Route 53 ARC), which provides a cluster with five Regional endpoints across five different AWS Regions. The failover process uses these endpoints, instead of manually editing Amazon Route 53 DNS records, which is a control plane operation. The routing controls in Route 53 ARC failover traffic from the primary Region to the secondary one.
Route 53 ARC routing controls
Routing controls are on-off switches that enable you to redirect client traffic from one instance of your workload to another. Traffic re-routing is the result of setting associated DNS health checks as healthy or unhealthy.
Route 53 ARC toggles
Deploying the sample application Pre-requisites 1. A public domain (example.com) registered with Amazon Route 53. Follow the instructions here on how to register a domain and the instructions here to configure Amazon Route 53 as your DNS service. 2. An AWS Certificate Manager certificate (*.example.com) for your domain name on both the primary and secondary Regions you plan to deploy the sample APIs.
Deploy the Amazon Route 53 ARC stack Deploy the Amazon Route 53 ARC stack first, which creates a cluster and the routing controls that enable you to fail over the APIs.
Follow the detailed instructions here to deploy the Amazon Route 53 Application Recovery Controller (ARC) stack.
Deploy the Service1 API both in the primary and secondary Regions This deploys an API Gateway Regional endpoint in each Region, which calls an AWS Lambda function to return the service name and the current AWS Region serving the request:
{"service": "service1", "region": "us-east-1"}
This is the code for the Lambda function:
import jsonimport osdef lambda_handler(event, context): return {"statusCode": 200,"body": json.dumps({ "service": "service1", "region": os.environ['AWS_REGION']}),}
Follow the detailed instructions here to deploy the service1 stack.
Deploy the Service2 API both in the primary and secondary Regions This stack is similar to service1, but has a different domain name and returns service2 as the service name:
{"service": "service2", "region": "us-east-1"}
Follow the detailed instructions here to deploy the service2 stack.
Deploy the shared public API both in the primary and secondary Regions This step configures HTTP endpoints so that when you call example.com/service1 or example.com/service2, it routes the request to the respective public DNS records you have set up for service1 and service2.
Follow the detailed instructions here to deploy the external API stack.
Failover tests To test the deployed example, modify then run the provided test script:
- Update lines 3–5 in the test.sh file to reference the domain name you configured for your APIs.
- Provide execute permissions and run the script:
chmod +x ./test/sh./test.sh
This script sends an HTTP request to each one of your three endpoints every 5 seconds. You can then use Amazon Route 53 ARC to fail over your services independently and see the responses served from different Regions.
Initially, all services are routing traffic to the us-east-1 Region:
Initial routing
With the following command, you update two routing controls for service1, setting the primary Region (us-east-1) health check state to off, and the secondary Region (us-west-2) health check state to on:
aws route53-recovery-cluster update-routing-control-states \ --update-routing-control-state-entries \ '[{"RoutingControlArn":"arn:aws:route53-recovery-control::111122223333:controlpanel/0123456bbbbbbb0123456bbbbbb0123456/routingcontrol/abcdefg1234567","RoutingControlState":"On"},{"RoutingControlArn":"arn:aws:route53-recovery-control:: 111122223333:controlpanel/0123456bbbbbbb0123456bbbbbb0123456/routingcontrol/hijklmnop987654321","RoutingControlState":"Off"}]' \ --region ap-southeast-2 \ --endpoint-url https://abcd1234.route53-recovery-cluster.ap-southeast-2.amazonaws.com/v1
After a few seconds, the script terminal shows that service1 is now routing traffic to us-west-2, while the other services are still routing traffic to the us-east-1 Region.
Flipping service1 to backup Region
To fail back service1 to the us-east-1 Region, run this command, now setting the service1 primary Region (us-east-1) health check state to on, and the secondary Region (us-west-2) health check state to off:
aws route53-recovery-cluster update-routing-control-states \ --update-routing-control-state-entries \ '[{"RoutingControlArn":"arn:aws:route53-recovery-control::111122223333:controlpanel/0123456bbbbbbb0123456bbbbbb0123456/routingcontrol/abcdefg1234567","RoutingControlState":"Off"},{"RoutingControlArn":"arn:aws:route53-recovery-control:: 111122223333:controlpanel/0123456bbbbbbb0123456bbbbbb0123456/routingcontrol/hijklmnop987654321","RoutingControlState":"On"}]' \ --region ap-southeast-2 \ --endpoint-url https:// abcd1234.route53-recovery-cluster.ap-southeast-2.amazonaws.com/v1
After a few seconds, the script terminal shows that service1 is now routing traffic to the us-east-1 Region again, like the other services.
Routing recovery
Cleaning up After you are finished, follow the cleanup instructions on GitHub.
Conclusion This solution helps put the control back in the hands of the teams managing critical workloads using API Gateway. By decoupling the frontend and backend, this solution gives organizations granular control over failover at the service level using Amazon Route 53 ARC to remove dependencies on control plane actions.
The pattern outlined also reduces the impact to consumers of the service as it allows you to use the same public API and top-level domain when moving from a single-Region to a multi-Region architecture.
For more resilience learning, visit AWS Architecture Blog – Resilience.
For more serverless learning, visit Serverless Land.
Welcome to the 26th edition of the AWS Serverless ICYMI (in case you missed it) quarterly recap. Every quarter, we share all the most recent product launches, feature enhancements, blog posts, webinars, live streams, and other interesting things that you might have missed!
In case you missed our last ICYMI, check out what happened last quarter here.
Calendar
EDA Day – London 2024 The AWS Serverless DA team hosted the third Event-Driven Architecture (EDA) Day in London on May 14th. This event brought together prominent figures in the event-driven architecture community, AWS, and customer speakers.
EDA Day covered 13 sessions, 2 workshops, and a Q&A panel. David Boyne was the keynote speaker with a talk “Complexity is the Gotcha of Event-Driven Architecture”. There were AWS speakers including Matthew Meckes, Natasha Wright, Julian Wood, Gillian Amstrong, Josh Kahn, Veda Ramen, and Uma Ramadoss. There was also an impressive lineup of guest speakers, Daniele Frasca, David Anderson, Ryan Cormack, Sarah Hamilton, Sheen Brisals, Marcin Sodkiewicz, and Ben Ellerby.
Videos are available on YouTube
EDA Day London
The future of Serverless There has been a lot of talk about the future of serverless, with this year being the 10th anniversary of AWS Lambda. Eric Johnson addresses the topic in his ServerlessDays Milan keynote, “Now serverless is all grown up, what’s next”.
AWS Lambda AWS launched support for the latest release of Ruby 3.3 is based on the new Amazon Linux 2023 runtime. The Ruby 3.3 runtime also provides access to the latest Ruby language features.
There is a new guide on how to retrieve data about Lambda functions that use a deprecated runtime.
Learn how to run code after returning a response from an AWS Lambda function. This post shows how to return a synchronous function response as soon as possible, yet also perform additional asynchronous work after you send the response. For example, you may store data in a database or send information to a logging system.
See how you can use the circuit-breaker pattern with Lambda extensions and Amazon DynamoDB. The circuit breaker pattern can help prevent cascading failures and improve overall system stability.
Circuit-breaker pattern
Lambda functions now scale up to 12X faster in the AWS GovCloud (US) Regions.
Powertools for AWS Lambda (Python) adds support for Agents for Amazon Bedrock.
The AWS SDK for JavaScript v2 enters maintenance mode on September 8, 2024 and reaches end-of-support on September 8, 2025.
Amazon CloudWatch Logs introduced Live Tail streaming CLI support.
Amazon ECS and AWS Fargate You can now secure Amazon Elastic Container Service (Amazon ECS) workloads on AWS Fargate with customer managed keys (CMKs). Once you add your keys to AWS Key Management Service (AWS KMS), you can use these to encrypt the underlying ephemeral storage of an Amazon ECS task on AWS Fargate.
Windows containers on AWS Fargate now start faster, up to 42% for Windows Server 2022 Core. AWS has optimized the Windows Server AMIs, introduced EC2 fast launch with pre-provisioned snapshots, and reduced network latency.
Amazon ECS Service Connect is a networking capability to simplify service discovery, connectivity, and traffic observability for Amazon ECS. You can now proactively scale Amazon ECS services by using custom metrics.
ECS Service Connect custom metrics
AWS Step Functions The AWS Step Functions TestState API allows you to test individual states independently and to integrate testing into your preferred development workflows. Learn how to accelerate workflow development to iterate faster.
Step Functions TestState API
Amazon EventBridge Amazon EventBridge Pipes now supports event delivery through AWS PrivateLink. You can send events from an event source located in an Amazon Virtual Private Cloud (VPC) to a Pipes target without traversing the public internet.
Amazon Timestream for LiveAnalytics is now an EventBridge Pipes target. Timestream for LiveAnalytics is a fast, scalable, purpose-built time series database that makes it easy to store and analyze trillions of time series data points per day.
EventBridge has a new console dashboard which provides a centralized view of your resources, metrics, and quotas. The console has an improved Learn page and other console enhancements. When using the CloudFormation template export for Pipes, you can also generate the IAM role. There is a new Rules tab in the Event Bus detail page, and the monitoring tab in the Rule detail page now includes additional metrics.
EventBridge Scheduler has some new API request metrics for improved observability.
Generative AI Amazon Bedrock is a fully managed Generative AI service that offers a choice of high-performing foundation models (FMs) from leading AI companies through a single API. Bedrock now supports new models, including Anthropic’s Claude 3.5, AI21 Labs’ Jamba-Instruct, Amazon Titan Text Premier.
The new Bedrock Converse API provides a consistent way to invoke Amazon Bedrock models and simplifies multi-turn conversations. There is also a JavaScript tutorial to walk you through sending requests to the Converse API using the Javascript SDK.
Amazon Q Developer is now generally available. Amazon Q Developer, part of the Amazon Q family, is a generative AI–powered assistant for software development. Amazon Q is available in the AWS Management Console and as an integrated development environment (IDE) extension for Visual Studio Code, Visual Studio, and JetBrains IDEs. Amazon Q Developer has knowledge of your AWS account resources and can help understand your costs.
Amazon Q list Lambda functions
You can use Amazon Q Developer to develop code features and transform code to upgrade Java applications. Amazon Q Developer also offers inline completions in the command line. For more information, see Reimagining software development with the Amazon Q Developer Agent.
Amazon Q code features
Knowledge Bases for Amazon Bedrock now let you configure Guardrails, configure inference parameters, and offers observability logs.
Storage and data Amazon S3 no longer charges for several HTTP error codes if initiated from outside your individual AWS account or AWS Organization.
You can automatically detect malware in new object uploads to S3 with Amazon GuardDuty.
Amazon Elastic File System (Amazon EFS) now support up to 1.5 GiB/s of throughput per client, a 3x increase over the previous limit of 500 MiB/s.
Discover architectural patterns for real-time analytics using Amazon Kinesis Data Streams in part 1 and part 2 and see how to optimize write throughput.
Amazon API Gateway Amazon API Gateway now allows you to increase the integration timeout beyond the prior limit of 29 seconds. You can raise the integration timeout for Regional and private REST APIs, but this might require a reduction in your account-level throttle quota limit. This launch can help with workloads that require longer timeouts, such as Generative AI use cases with Large Language Models (LLMs).
You can also now use Amazon Verified Permissions to secure API Gateway REST APIs when using an Open ID connect (OIDC) compliant identity provider. You can now control access based on user attributes and group memberships, without writing code.
AWS AppSync You can now invoke your AWS AppSync data sources in an event-driven manner. Previously, you could only invoke Lambda functions synchronously from AWS AppSync. AWS AppSync can now trigger Lambda functions in Event mode, asynchronously decoupling the API response from the Lambda invocation, which helps with long-running operations.
AWS AppSync now passes application request headers to Lambda custom authorizer functions. You can make authorization decisions based on the value of the authorization header, and the value of other headers that were sent with the request from the application client.
Learn best practices for AWS AppSync GraphQL APIs. See how to how to optimize the security, performance, coding standards, and deployment of your AWS AppSync API. AWS AppSync also has increase quotas, and new metrics
AWS Amplify AWS Amplify Gen 2 is now generally available. This now provides a code-first developer experience for building full-stack apps using TypeScript. Amplify Gen 2 allows you to express app requirements like the data models, business logic, and authorization rules in TypeScript.
AWS Amplify Gen2
Amplify has a new experience for file storage. This post explores using Lambda to create serverless functions for Amplify using TypeScript. There are also new team environment workflows.
Serverless blog posts April * Architecting for Disaster Recovery on AWS Outposts Racks with AWS Elastic Disaster Recovery * Accelerating workflow development with the TestState API in AWS Step Functions
May * Running code after returning a response from an AWS Lambda function * Using the circuit-breaker pattern with AWS Lambda extensions and Amazon DynamoDB
June * Securing Amazon ECS workloads on AWS Fargate with customer managed keys
Serverless container blog posts April * Unlocking AWS Fargate feature for attaching Amazon EBS Volumes to ECS Tasks * Dynamically create repositories upon image push to Amazon ECR * Applying Generative AI to CVE remediation – early vulnerability patching in Continuous Integration Pipelines
May * Windows Containers on AWS Fargate: Launch time improvements
June * Proactive scaling of Amazon ECS services using Amazon ECS Service Connect Metrics
Serverless Office Hours Serverless Office Hours
April
- Apr 2 – Building Serverless Applications with Terraform
- Apr 9 – Developing with Wing Cloud
- Apr 16 – Combining serverless messaging services
- Apr 23 – Real-time web and mobile backends
- Apr 30 – Connecting Confluent to AWS
May
- May 7 – Develop and test locally with LocalStack
- May 14 – Building a personalized GenAI webapp
- May 21 – Serverless GenAI using Bedrock Claude 3
- May 28 – Serverless Platform Engineering
June
- June 4 – Simplifying serverless with the CDK
- June 11 – Learn Serverless with Educloud Academy
- June 18 – Integrating time-series databases
- June 25 – Deploy frontends with the CloudFront Hosting Toolkit
Containers from the Couch Containers from the Couch
April
- Apr 11 – Using Amazon Q to build and operate your ECS workloads
- April 25 Containers in AWS Lambda
May
- May 9 – OPA on AWS
FooBar Serverless April * Apr 4 – How to integrate with any service or manual processes with Step Functions? * Apr 11 – Automating video dubbing with AWS Step Functions and Artificial Intelligence * Apr 18 – The Future of Solutions Architect: How Generative AI will impact their work? * Apr 25 – Unveiling the Role of AWS Solutions Architect
February * May 2 – Understanding the SAGA pattern with AWS Step Functions – With Demo * May 9 – Working in the cloud – New series! * May 16 – What does a Software Engineer in the Cloud actually do? | Working in the cloud * May 23 – How did you get your first job working with cloud computing? | Working in the cloud * May 30 – From Junior Developer to Cloud Expert | Working in the cloud
June * Jun 6 – What is your cloud job about? | Working in the cloud * Jun 13 – Journey to the Cloud | Working in the cloud * June 27 – Pathways to Cloud Excellence: Insights from Top Industry Experts | Working in the cloud
Still looking for more? The Serverless landing page has more information. The Lambda resources page contains case studies, webinars, whitepapers, customer stories, reference architectures, and even more Getting Started tutorials.
You can also follow the Serverless Developer Advocacy team on X (formerly Twitter) to see the latest news, follow conversations, and interact with the team.
- Eric Johnson: @edjgeek
- Julian Wood: @julian_wood
- Marcia Villalba: @mavi888uy
- Olly Pomeroy @oliver-p
- Romain Jourdan: @rjourdan_net
And finally, visit the Serverless Land and Containers on AWS websites for all your serverless and serverless container needs.
As Amazon CTO Werner Vogels said, “Encryption is the tool we have to make sure that nobody else has access to your data. Amazon Web Services (AWS) built encryption into nearly all of its 165 cloud services. Make use of it. Dance like nobody is watching. Encrypt like everyone is.”
Security is the top priority at AWS, underpinning everything we do. With AWS Fargate, every Amazon Elastic Container Service (Amazon ECS) task is launched on to a new single use, single tenant unit of compute. The ephemeral storage for this compute is always encrypted, and the AWS Key Management Service (AWS KMS) encryption key used for this encryption is managed by AWS Fargate.
Today, AWS is announcing that you can bring your own customer managed keys (CMKs). Once added to AWS KMS, you can use these to encrypt the underlying ephemeral storage of an Amazon ECS task on AWS Fargate. With this new capability, customers operating in heavily regulated environments can now have more control and visibility into their task’s ephemeral storage encryption.
This post dives into AWS Fargate task ephemeral storage and shows how the new customer managed key (CMK) feature can be enabled and audited.
Overview AWS Fargate is a serverless compute engine for containerized workloads running on Amazon ECS and Amazon Elastic Kubernetes Service (Amazon EKS). Each time a new piece of work is scheduled on to AWS Fargate, as an Amazon ECS task or an Amazon EKS Pod, this workload is placed on a single use, single-tenant instance of compute.
For Amazon ECS tasks, that unit of compute has 20GiBs of ephemeral storage attached. This can be increased up to 200GiB by specifying the ephemeralStorage parameter in your task definition. This ephemeral storage is bound to the lifecycle of the Amazon ECS task, and once the Amazon ECS task has stopped, along with the underlying compute, this ephemeral storage is deleted.
If you are using AWS Fargate platform version 1.4.0 or higher, this ephemeral storage volume is encrypted by default. It is encrypted using an AWS Key Management Service (KMS) key with the AES-256 encryption algorithm. The key, and its lifecycle, is owned by the AWS Fargate service. You can learn more about Fargate-managed ephemeral storage encryption in the AWS Fargate Security Whitepaper.
With today’s launch, as an alternative to the Fargate-managed encryption, you can choose to encrypt the ephemeral storage with customer managed keys (CMKs). This helps regulation-sensitive customers meet their internal security policies and regulatory requirements.
Customers can import their own existing keys into AWS KMS or create a new CMK to encrypt the ephemeral storage. CMKs used by AWS Fargate can be managed through the normal AWS KMS lifecycle actions such as being rotated, disabled, and deleted. See the Amazon ECS documentation for more details on managing the KMS key. Additionally, all access from AWS Fargate to the KMS key can be audited in AWS CloudTrail Logs.
In January 2024, AWS announced that additional Amazon Elastic Block Store (Amazon EBS) volumes can now be attached to Amazon ECS tasks running on AWS Fargate. These EBS volumes unlock additional use cases for AWS Fargate customers, using higher capacity and high-performance volumes for use in their tasks alongside the ephemeral storage. These additional EBS volumes are managed differently to the ephemeral storage, and these volumes can already be encrypted with customer managed KMS keys (CMKs).
AWS Fargate falls under the scope of the following compliance programs regarding AWS’s side of the shared responsibility model. The compliance programs covered by AWS Fargate include:
- C5
- CCCS
- CISPE
- DESC CSP
- DOD CC SRG
- FedRAMP
- FINMA
- HITRUST CSF
- ISMAP
- ISO and CSA STAR certificates
- K-ISMS
- MTCS
- PCI
- PiTuKri
- SOC
- SNI 27001
You can download third-party audit reports using AWS Artifact. For more information, see Downloading Reports in AWS Artifact. Many of these compliance programs require customers to encrypt their data at rest within their Amazon ECS on AWS Fargate resources.
Customers also have additional internal risk management policies for key handling, where they must generate their own keys, have backups for these keys off-cloud, and manage the lifecycle of these keys. Until today, these customers could not use AWS Fargate’s default encryption solution for the workloads subject to their internal security policies.
Enabling CMK for ephemeral storage on an Amazon ECS Cluster Following today’s launch a single KMS key can now be attached to a new or existing Amazon ECS Cluster. Once a key has been attached, all new tasks launched on to AWS Fargate use this KMS key. If you have existing tasks running in the Amazon ECS cluster, they must be redeployed to use the new encryption key. If these tasks are part of an Amazon ECS service, passing the –force-new-deployment flag to an amazon ecs update-service command forces all tasks to be redeployed with the new KMS key (while respecting the minimumHealthyPercent of the service).
To attach a KMS key to a new or existing cluster, specify the KeyId to the new managedStorageConfiguration field:
aws ecs create-cluster \ --cluster clusterName \ --configuration '{"managedStorageConfiguration":{"fargateEphemeralStorageKmsKeyId":"arn:aws:kms:us-west-2:012345678901:key/a1b2c3d4-5678-90ab-cdef-EXAMPLE11111"}}'
Here is an example of the output of a DescribeClusters API request to an Amazon ECS cluster with a customer managed key:
aws ecs describe-clusters --clusters ecs-fargate-self-managed-key-cluster --region us-west-2 --include CONFIGURATIONS
Aside from auditing CloudTrail Logs for encryption events, you can also verify that an ECS task is using the KMS key by using the DescribeTask API on an existing task:
{ "tasks": [ { .... "clusterArn": "arn:aws:ecs:us-west-2:1234567890:cluster/mycluster", "taskArn": "arn:aws:ecs:us-west-2:1234567890:task/11223342-1111-4fde-b6ca-273c5cfc00a1]", "fargateEphemeralStorage": { "sizeInGiB": 20, "**kmsKeyId**": "**arn:aws:kms:us-west-2:1234567890:key/082222a1-1111-4fde-b6ca-273c5cfc00a1**" } } ]}
Enforcing encryption with customer managed keys The new AWS Identity and Access Management (IAM) condition key ensures that your Amazon ECS clusters are created with a customer managed key. This can be applied as Service Control Policy in your AWS Organization or as part of your IAM permissions.
Here is an IAM policy example snippet that ensures a cluster can only be created when a specific AWS KMS key is used:
{ "Version": "2012-10-17", "Statement": [ { "Effect": "Allow", "Action": [ "ecs:CreateCluster" ], "Resource": "*", "Condition": { "StringEquals": { "**ecs:fargate-ephemeral-storage-kms-key": "arn:aws:kms:us-east-1:123456789012:key/1234abcd-12ab-34cd-56ef-1234567890ab**" } } } ]}
Audit encryption events Encryption events are logged in AWS CloudTrail. The following is an example of a CloudTrail event that includes the volume ID, cluster name, and AWS Account ID of the operation. You can find more details about the type of events that are logged in Managing AWS KMS keys for Fargate ephemeral storage.
{ "eventVersion": "1.08", "userIdentity": { "type": "AWSService", "invokedBy": "ec2-frontend-api.amazonaws.com" }, "eventTime": "2024-04-23T18:08:13Z", "eventSource": "kms.amazonaws.com", "eventName": "CreateGrant", "awsRegion": "us-west-2", "sourceIPAddress": "ec2-frontend-api.amazonaws.com", "userAgent": "ec2-frontend-api.amazonaws.com", "requestParameters": { "keyId": "arn:aws:kms:us-west-2:123456789012:key/9b52b885-3f4d-40af-9843-d6b24b735559", "granteePrincipal": "fargate.us-west-2.amazonaws.com", "operations": [ "Decrypt" ], "constraints": { "encryptionContextSubset": { "**aws:ecs:clusterAccount": "123456789012"**, **"aws:ebs:id": "vol-01234567890abcdef"**, **"aws:ecs:clusterName": "ecs-fargate-self-managed-key-cluster"** } }, "retiringPrincipal": "ec2.us-west-2.amazonaws.com" }, "responseElements": { "grantId": "e3b0c44298fc1c149afbf4c8996fb92427ae41e4649b934ca495991b7852b855", "keyId": "arn:aws:kms:us-west-2:123456789012:key/9b52b885-3f4d-40af-9843-d6b24b735559" }, "requestID": "be4d1a4e4730e0dceca51f87ee7454d5db76400d80e22bfbf3c4ca01e893b60c", "eventID": "bf36027c-86bd-40f2-a561-960cbe148c4c", "readOnly": false, "resources": [ { "accountId": "AWS Internal", "type": "AWS::KMS::Key", "ARN": "arn:aws:kms:us-west-2:123456789012:key/9b52b885-3f4d-40af-9843-d6b24b735559" } ], "eventType": "AwsApiCall", "managementEvent": true, "recipientAccountId": "123456789012", "sharedEventID": "bf36027c-86bd-40f2-a561-960cbe148c4c", "eventCategory": "Management"}
Conclusion With the use of AWS KMS customer managed keys, you can now meet your security requirements for your data inside your Amazon ECS workloads running on AWS Fargate.
To learn more about compliance on your Amazon ECS workloads you can reference the FSI Services Spotlight: Amazon Elastic Container Service (ECS) with AWS Fargate blog post or the security overview of AWS Fargate whitepaper. To learn more about the use of customer managed keys in AWS Fargate, refer to the AWS documentation. This feature was requested by our customers on the AWS Containers roadmap.
This blog post is written by Brian Daugherty, Principal Solutions Architect. Enrico Liguori, Solution Architect, Networking. Sedji Gaouaou, Senior Solution Architect, Hybrid Cloud.
Network traffic inspection on AWS Outposts rack is a crucial aspect of making sure of security and compliance within your on-premises environment. With network traffic inspection, you can gain visibility into the data flowing in and out of your Outposts rack environment, enabling you to detect and mitigate potential threats proactively.
By deploying AWS partner solutions on Outposts rack, you can take advantage of their expertise and specialized capabilities to gain insights into network traffic patterns, identify and mitigate threats, and help ensure compliance with industry-specific regulations and standards. This includes advanced network traffic inspection capabilities, such as deep packet inspection, intrusion detection and prevention, application-level firewalling, and advanced threat detection.
This post presents an example architecture of deploying a firewall appliance on an Outposts rack to perform on-premises to Virtual Private Cloud (VPC) and VPC-to-VPC inline traffic inspection.
Architecture The example traffic inspection architecture illustrated in the following diagram is built using a common Outposts rack deployment pattern.
In this example, an Outpost rack is deployed on premises to support:
- Manufacturing/operational technologies (OT) applications that need low latency between OT servers and devices
- Information technology (IT) applications that are subject to strict data residency and data protection policies
Separate VPCs, that can be owned by different AWS accounts, and subnets are created for the IT and OT departments’ instances (see 1 and 2 in the diagram).
Organizational security policies require that traffic flowing to and from the Outpost and the site, and between VPCs on the Outpost, be inspected, controlled, and logged using a centralized firewall.
In an AWS Region it is possible to implement a centralized traffic inspection architecture using routing services such as AWS Transit Gateways (TGW) or Gateway Load Balancers (GWLB) to route traffic to a central firewall, but these services are not available on Outposts.
On Outposts, some use the Local Gateway (LGW) to implement a distributed traffic inspection architecture with firewalls deployed in each VPC, but this can be operationally complex and cost prohibitive.
In this post, you will learn how to use a recently introduced feature – Multi-VPC Elastic Network Interface (ENI) Attachments – to create a centralized traffic inspection architecture on Outposts. Using Multi-VPC Attached ENIs you can attach ENIs created in subnets that are owned and managed by other VPCs (even VPCs in different accounts) to an Amazon Elastic Compute Cloud (EC2) instance.
Specifically, you can create ENIs in the IT and OT subnets that can be shared with a centralized firewall (see 3 and 4).
Because it’s a best practice to minimize the attack surface of a centralized firewall through isolation, the example includes a VPC and subnet created solely for the firewall instance (see 5).
To protect traffic flowing to and from the IT, OT, and firewall VPCs and on-site networks, another ‘Exposed’ VPC, subnet (see 6), and ENI (see 7) are created. These are the only resources associated with the Outposts Local Gateway (LGW) and ‘exposed’ to on-site networks.
In the example, traffic is routed from the IT and OT VPCs using a default route that points to the ENI used by the firewall (see 8 and 9). The firewall can route traffic back to the IT and OT VPCs, as allowed by policy, through its directly connected interfaces.
The firewall uses a route for the on-site network (192.168.30.0/24) – or a default route – pointing to the gateway associated with the exposed ENI (eni11, 172.16.2.1 – see 10).
To complete the routing between the IT, OT, and firewall VPCs and the on-site networks, static routes are added to the LGW route table pointing to the firewall’s exposed ENI as the next hop (see 11).
Once these static routes are inserted, the Outposts Ingress Routing feature will trigger the routes to be advertised toward the on-site layer-3 switch using BGP.
Likewise, the on-site layer-3 switch will advertise a route (see 12) for 192.168.30.0/24 (or a default route) over BGP to the LGW, completing end-to-end routing between on-site networks and the IT and OT VPCs through the centralized firewall.
The following diagram shows an example of packet flow between an on-site OT device and the OT server, inspected by the firewall:
Implementation on AWS Outposts rack The following implementation details are essential for our example traffic inspection on the Outposts rack architecture.
Prerequisites The following prerequisites are required:
- Deployment of an Outpost on premises;
- Creation of four VPCs – Exposed, firewall, IT, and OT;
- Creation of private subnets in each of the four VPCs where ENIs and instances can be created;
- Creation of ENIs in each of the four private subnets for attachment to the firewall instance (keep track of the ENI IDs);
- If needed, sharing the subnets and ENIs with the firewall account, using AWS Resource Access Manager (AWS RAM);
- Association of the Exposed VPC to the LGW.
Firewall selection and sizing Although in this post a basic Linux instance is deployed and configured as the firewall, in the Network Security section of the AWS Marketplace, you can find several sophisticated, powerful, and manageable AWS Partner solutions that perform deep packet inspection.
Most network security marketplace offerings provide guidance on capabilities and expected performance and pricing for specific appliance instance sizes.
Firewall instance selection Currently, an Outpost rack can be configured with EC2 instances in the M5, C5, R5, and G4dn families. As a user, you can select the size and number of instances available on an Outpost to match your requirements.
When selecting an EC2 instance for use as a centralized firewall it is important to consider the following:
- Performance recommendations for instance types and sizes made by the firewall appliance partner;
- The number of VPCs that are inspected by the firewall appliance;
- The availability of instances on the Outpost.
For example, after evaluating the partner recommendations you may determine that an instance size of c5.large, r5.large, or larger provide the required performance.
Next, you can use the following AWS Command Line Interface (AWS CLI) command to identify the EC2 instances configured on an Outpost:
Outposts get-outpost-instance-types \--outpost-id op-abcdefgh123456789
The output of this command lists the instance types and sizes configured on your Outpost:
InstanceTypes:- InstanceType: c5.xlarge- InstanceType: c5.4xlarge- InstanceType: r5.2xlarge- InstanceType: r5.4xlarge
With knowledge of the instance types and sizes installed on your Outpost, you can now determine if any of these are available. The following AWS CLI command – one for each of the preceding instance types – lists the number of each instance type and size available for use. For example:
aws cloudwatch get-metric-statistics \--namespace AWS/Outposts \--metric-name AvailableInstanceType_Count \--statistics Average --period 3600 \--start-time $(date -u -Iminutes -d '-1hour') \--end-time $(date -u -Iminutes) \--dimensions \Name=OutpostId,Value=op-abcdefgh123456789 \Name=InstanceType,Value=c5.xlarge
This command returns:
Datapoints:- Average: 2.0 Timestamp: '2024-04-10T10:39:00+00:00' Unit: CountLabel: AvailableInstanceType_Count
The output indicates that there are (on average) two c5.xlarge instances available on this Outpost in the specified time period (1 hour). The same steps for the other instance type suggest that there are also two c5.4xlarge, two r5.2xlarge, and no r5.4xlarge available.
Next, consider the number of VPCs to be connected to the firewall and determine if the instances available support the required number of ENIs.
The firewall requires an ENI in its own VPC, in the Exposed VPC, and one for each additional VPC. In this post, because there is a VPC for IT and for OT, you need an EC2 instance that supports four interfaces in total:
To determine the number of supported interfaces for each available instance type and size, let’s use the AWS CLI:
aws ec2 describe-instance-types \--instance-types c5.xlarge c5.4xlarge r5.2xlarge \--query 'InstanceTypes[].[InstanceType,NetworkInfo.NetworkCards]'
This returns:
- - r5.2xlarge - - BaselineBandwidthInGbps: 2.5 MaximumNetworkInterfaces: 4 NetworkCardIndex: 0 NetworkPerformance: Up to 10 Gigabit PeakBandwidthInGbps: 10.0- - c5.xlarge - - BaselineBandwidthInGbps: 1.25 MaximumNetworkInterfaces: 4 NetworkCardIndex: 0 NetworkPerformance: Up to 10 Gigabit PeakBandwidthInGbps: 10.0- - c5.4xlarge - - BaselineBandwidthInGbps: 5.0 MaximumNetworkInterfaces: 8 NetworkCardIndex: 0 NetworkPerformance: Up to 10 Gigabit PeakBandwidthInGbps: 10.0
The output suggests that the three available EC2 instances (r5.2xlarge, c5.xlarge and c5.4xlarge) can support four network interfaces. The output also suggests that the c5.4xlarge instance, for example, supports up to 8 network interfaces and a maximum bandwidth of 10Gb/s. This helps you plan for the potential growth in network requirements.
Attaching remote ENIs to the firewall instance With the firewall instance deployed in the firewall VPC, the next step is to attach the remote ENIs created previously in the Exposed, OT, and IT subnets. Using the firewall instance ID and the Network Interface IDs for each of the remote ENIs, you can create the Multi-VPC Attached ENIs to connect the firewall to the other VPCs. Each attached interface needs a unique device-index greater than ‘0’ which is the primary instance interface.
For example, to connect the Exposed VPC ENI:
aws ec2 attach-network-interface --device-index 1 \--instance-id i-0e47e6eb9873d1234 \--network-interface-id eni-012a3b4cd5efghijk \--region us-west-2
Attach the OT and IT ENIs while incrementing the device-index and using the respective unique ENI IDs:
aws ec2 attach-network-interface --device-index 2 \--instance-id i-0e47e6eb9873d1234 \--network-interface-id eni-0bbe1543fb0bdabff \--region us-west-2aws ec2 attach-network-interface --device-index 3 \--instance-id i-0e47e6eb9873d1234 \--network-interface-id eni-0bbe1a123b0bdabde \--region us-west-2
After attaching each remote ENI, the firewall instance now has an interface and IP address in each VPC used in this example architecture:
ubuntu@firewall:~$ ip addressens5: <BROADCAST,MULTICAST,UP,LOWER_UP> mtu 9001 qdisc mq state UP group default qlen 1000 inet 10.240.4.10/24 metric 100 brd 10.240.4.255 scope global dynamic ens5ens6: <BROADCAST,MULTICAST,UP,LOWER_UP> mtu 9001 qdisc mq state UP group default qlen 1000 inet 10.242.0.50/24 metric 100 brd 10.242.0.255 scope global dynamic ens6ens7: <BROADCAST,MULTICAST,UP,LOWER_UP> mtu 9001 qdisc mq state UP group default qlen 1000 inet 10.244.76.51/16 metric 100 brd 10.244.255.255 scope global dynamic ens7ens11: <BROADCAST,MULTICAST,UP,LOWER_UP> mtu 9001 qdisc mq state UP group default qlen 1000 inet 172.16.2.7/24 metric 100 brd 172.16.2.255 scope global dynamic ens11
Updating the VPC/subnet route tables You can now add the routes needed to allow traffic to be inspected to flow through the firewall.
For example, the OT subnet (10.242.0.0/24) uses a route table with the ID rtb- abcdefgh123456789. To send the traffic through the firewall, you need to add a default route with the target being the ENI (eni-07957a9f294fdbf5d) that is now attached to the firewall:
aws ec2 create-route --route-table-id rtb-abcdefgh123456789 \--destination-cidr-block 0.0.0.0/0 \--network-interface-id eni-07957a9f294fdbf5d
You can follow the same process is used to add a default route to the IT VPC/subnet.
With routing established from the IT and OT VPCs to the firewall, you need to make sure that the firewall uses the Exposed VPC to route traffic toward the on-premises network 192.168.30.0/24. This is done by adding a route within the firewall OS using the VPC gateway as a next hop.
The ENI attached to the firewall from the Exposed VPC is in subnet 172.16.2.0/28, and the gateway used by this subnet is, by Amazon Virtual Private Cloud (VPC) convention, the first address in the subnet – 172.16.2.1. This is used when updating the firewall OS route table:
sudo ip route add 192.168.30.0/24 via 172.16.2.1
You can now confirm that the firewall OS has routes to each attached subnet and to the on-premises subnet:
ubuntu@firewall:~$ ip routedefault via 10.240.4.1 dev ens5 proto dhcp src 10.240.4.10 metric 10010.240.0.2 via 10.240.4.1 dev ens5 proto dhcp src 10.240.4.10 metric 10010.240.4.0/24 dev ens5 proto kernel scope link src 10.240.4.10 metric 10010.240.4.1 dev ens5 proto dhcp scope link src 10.240.4.10 metric 10010.242.0.0/24 dev ens6 proto kernel scope link src 10.242.0.50 metric 10010.242.0.2 dev ens6 proto dhcp scope link src 10.242.0.50 metric 10010.244.0.0/16 dev ens7 proto kernel scope link src 10.244.76.51 metric 10010.244.0.2 dev ens7 proto dhcp scope link src 10.244.76.51 metric 100172.16.2.0/24 dev ens11 proto kernel scope link src 172.16.2.7 metric 100172.16.2.2 dev ens11 proto dhcp scope link src 172.16.2.7 metric 100192.168.30.0/24 via 172.16.2.1 dev ens11
The final step in establishing end-to-end routing is to make sure that the LGW route table contains static routes for the firewall, IT, and OT VPCs. These routes target the ENIs used by the firewall in the Exposed VPC.
After gathering the LGW Route Table ID and the firewall’s Exposed ENI ID used by the firewall, you can now add routes toward the firewall VPC:
aws ec2 create-local-gateway-route \ --local-gateway-route-table-id lgw-rtb-abcdefgh123456789 \ --network-interface-id eni-0a2e4f68f323022c3 \ --destination-cidr-block 10.240.0.0/16
Repeat this command for the OT and IT VPC CIDRs – 10.242.0.0/16 and 10.244.0.0/16, respectively.
You can query the LGW route table to make sure that each of the static routes was inserted:
aws ec2 search-local-gateway-routes \ --local-gateway-route-table-id lgw-rtb-abcdefgh123456789 \ --filters "Name=type,Values=static"
This returns:
Routes:- DestinationCidrBlock: 10.240.0.0/16 LocalGatewayRouteTableId: lgw-rtb-abcdefgh123456789 NetworkInterfaceId: eni-0a2e4f68f323022c3 State: active Type: static- DestinationCidrBlock: 10.242.0.0/16 LocalGatewayRouteTableId: lgw-rtb-abcdefgh123456789 NetworkInterfaceId: eni-0a2e4f68f323022c3 State: active Type: static- DestinationCidrBlock: 10.244.0.0/16 LocalGatewayRouteTableId: lgw-rtb-abcdefgh123456789 NetworkInterfaceId: eni-0a2e4f68f323022c3 State: active Type: static
With the addition of these static routes the LGW begins to advertise reachability to the firewall, OT, and IT Classless Inter-Domain Routing (CIDR) blocks over the BGP neighborship. The CIDR for the Exposed VPC is already advertised because it is associated directly to the LGW.
The firewall now has full visibility of the traffic and can apply the monitoring, inspection, and security profiles defined by your organization.
Other considerations * It is important to follow the best practices specified by the Firewall Appliance Partner to fully secure the appliance. In the example architecture, access to the firewall console is restricted to AWS Session Manager. * The commands used previously to create/update the Outpost/LGW route tables need an account with full privileges to administer the Outpost.
Fault tolerance As a crucial component of the infrastructure, the firewall instance needs a mechanism for automatic recovery from failures. One effective approach is to deploy the firewall instances within an Auto Scaling group, which can automatically replace unhealthy instances with new, healthy ones. In addition, using host or rack level spread placement group makes sure that your instances are deployed on distinct underlying hardware. This enables high availability and minimizes downtime. Furthermore, this approach based on Auto Scaling can be implemented regardless of the specific third-party product used.
To ensure a seamless transition when Auto Scaling replaces an unhealthy firewall instance, it is essential that the multi-VPC ENIs responsible for receiving and forwarding traffic are automatically attached to the new instance. When re-using the same multi-VPC ENIs, make sure that no changes are required in the subnets and LGW route tables.
To re-attach the same multi-VPC ENIs to the new instance, you can do this using Auto Scaling lifecycle hooks, with which you can pause the instance replacement process and perform custom actions.
After re-attaching the multi-VPC ENIs to the instance, the last step is to restore the configuration of the firewall from a backup.
Conclusion In this post, you have learned how to implement on-premises to VPC and VPC-to-VPC inline traffic inspection on Outposts rack with a centralized firewall deployment. This architecture requires a VPC for the firewall instance itself, an Exposed VPC connecting to your on-premises network, and one or more VPCs for your workloads running on the Outpost. You can either use a basic Linux instance as a router, or choose from the advanced AWS Partner solutions in the Network Security section of the AWS Marketplace and follow the respective guidance on firewall instance selection. With multi-VPC ENI attachments, you can create network traffic routing between VPCs and forward traffic to the centralized firewall for inspection. In addition, you can use Auto Scaling groups, spread placement groups, and Auto Scaling lifecycle hooks to enable high availability and fault tolerance for your firewall instance.
If you want to learn more about network security on AWS, visit: Network Security on AWS.
This post is written by Alan Oberto Jimenez, Senior Cloud Application Architect, and Tobias Drees, Cloud Application Architect.
Modern software systems frequently rely on remote calls to other systems across networks. When failures occur, they can cascade across multiple services causing service disruptions. One technique for mitigating this risk is the circuit breaker pattern, which can detect and isolate failures in a distributed system. The circuit breaker pattern can help prevent cascading failures and improve overall system stability.
The pattern isolates the failing service and thus prevents cascading failures. It improves the overall responsiveness by preventing long waiting times for timeout periods. Furthermore, it also increases the fault tolerance of the system since it lets the system interact with the affected service again once it is available again.
This blog post presents an example application, showing how AWS Lambda extensions integrate with Amazon DynamoDB to implement the circuit breaker pattern.
Using Lambda extensions to implement the circuit breaker pattern AWS Lambda extensions provide a way to integrate monitoring, observability, security, and governance tools into the Lambda execution environment without complex installation or configuration management. You can run extensions both as part of the runtime process with an internal extension or as a separate process in the execution environment with an external extension.
Lambda extensions enable the circuit breaker pattern without modifying the core function code. An external extension checks in a separate runtime whether a certain service is reachable or not. This approach decouples the business logic in the Lambda function from failure detection, allowing for the reuse of this Lambda extension across different Lambda functions. Both decoupling of code with different purposes and code reuse is in line with the best practices for building Lambda functions.
Pinging a microservice at each Lambda invocation increases network traffic and latency. Circuit breaker implementations benefit from a caching layer to store the state of the microservices. The Lambda extension fetches the status of a microservice from a database and stores the result in memory for a specified time avoiding a disk write. The Lambda function checks the extension cache before pinging the microservice reducing network traffic. Lambda extensions are an ideal tool to build a caching layer for Lambda functions since its in-memory cache makes it more secure, easier to manage, and more performant due to higher availability compared to calling a network resource instead.
Overview 1. The main function process handles the event after every AWS Lambda invocation. Before performing any external call against the external components, it listens for HTTP POST events from the Lambda extension process to fetch the last status of the circuits. 2. The extension process provides the circuit state to the main process via HTTP POST. 1. The extension checks its internal cache and returns a valid value if available, otherwise reads the state of the circuits from the DynamoDB table and updates the cache. 2. Finally, the extension process returns the state of the circuits to the main function via an API call response. 3. Because of the Lambda extensions lifecycle, this process occurs periodically to keep the local cache updated until the execution environment is terminated. 3. If the circuit is in the OPEN state, the main function process executes calls against the external microservices, otherwise the process returns a local response. 4. An Amazon EventBridge event periodically invokes a Lambda responsible for updating the circuit states. 5. This Lambda function performs the validations needed to determine the status of the different remote microservices (circuits) with an Amazon API Gateway entrypoint. 6. The Lambda function writes the result of the verification process to the DynamoDB table.
Walkthrough The following prerequisites are required to complete the walkthrough:
- An active AWS account
- AWS CLI 2.15.17 or later
- AWS SAM CLI 1.116.0 or later
- Git 2.39.3 or later
- Python 3.12
Initial setup 1. Clone the code from GitHub onto a local machine:
git clone https://github.com/aws-samples/implementing-the-circuit-breaker-pattern-with-lambda-extensions-and-dynamodb.git
2. To install the packages, utilize a virtual environment:
python -m venv circuit_breaker_venv && source circuit_breaker_venv/bin/activate
3. To prepare the services for deployment, execute the following AWS Serverless Application Model (SAM) command:
sam build
4. To deploy the services, use this command specifying the AWS CLI profile (in the config file in the .aws folder) for the AWS account to deploy the services in:
sam deploy --guided --profile <AWSProfile>
Answer the question prompts as appropriate.
5. You can deploy subsequent local changes in the code with:
sam build sam deploy
Testing and adjusting the solution The Lambda function updating the state in DynamoDB runs every minute as specified by the template. After the function has run for the first time after 1 minute, the DynamoDB entry containing the status (“OPEN” or “CLOSED”) is ready. Since the mock API is part of the stack, the status is “OPEN”.
You can invoke the My Microservice Lambda function manually to see:
The Lambda function updating the state in DynamoDB is invoked with an EventBridge rule that specifies the URL and the ID of the service to be monitored. By creating a new EventBridge rule with the correct URL and a new ID, you can use the AWS SAM template for monitoring multiple services.
To add a new EventBridge rule, add this to the template:
NewEventRule: Type: AWS::Events::Rule Properties: Description: Event rule to trigger the Lambda function with a JSON payload ScheduleExpression: rate(1 minute) State: ENABLED Targets: - Arn: !GetAtt UpdatingStateLambda.Arn Id: TargetFunction Input: '{ "URL": "https://aws.amazon.com/", "ID": "NewMicroservice"}' # Add the JSON payload here MyPermissionForNewEventRule: Type: AWS::Lambda::Permission Properties: FunctionName: !Ref UpdatingStateLambda Action: lambda:InvokeFunction Principal: events.amazonaws.com SourceArn: !GetAtt NewEventRule.Arn
In the Lambda function that contains the business logic, add the following environment variables. However, for more complex cases with multiple microservices to be monitored, it’s recommended to use AWS Config. Using AWS Config, configurations for Lambda functions can be stored to enable more granular control than with environment variables.
Environment: Variables: service_name: "NewMicroservice"
You can adjust the logic of this Lambda function by changing the code in my-microservice/lambda-handler.py or directly in the Lambda section of the AWS Management Console.
If you end up using your own Lambda function to use the circuit breaker Lambda extension, include the circuit breaker extension as a layer:
BusinessLogicMicroservice: Type: AWS::Serverless::Function Properties: CodeUri: business-logic-microservice/ Handler: lambda_function.lambda_handler MemorySize: 128 Policies: - DynamoDBCrudPolicy: TableName: !Ref CircuitBreakerStateTable Timeout: 100 Runtime: python3.8 Layers: - !Ref CircuitBreakerExtensionLayer
Circuit breaker in closed state So far, the sample application only features an open circuit breaker state signaling a functioning microservice. This section simulates an unresponsive microservice to test the behavior of the system with a closed-circuit breaker state.
- Edit the environment variables of the MyMicroservice Lambda function in line 47 of the template.yaml file and the URL of the input to the Lambda updating the state in the event rule in line 107 to a domain that times out such as ”https://aws.amazon.com:81/“.
API_URL: "https://aws.amazon.com:81/"Input: '{ "URL": "https://aws.amazon.com:81/", "ID": "MyMicroservice"}' - Deploy these changes:
sam buildsam deploy
The event rule invokes the Lambda function, updating the state every minute. To see the output of this Lambda function, invoke it manually:
This Lambda function changes the DynamoDB entry for this URL to:
The MyMicroservice Lambda function receives the DynamoDB entries for the status over HTTP from the Circuit Breaker Lambda extension and proceeds with the logic following a closed state. The output of invoking the Lambda manually is:
This shows the circuit breaker pattern working as intended. In the Lambda updating state, the time it takes for the Lambda function to throw a timeout exception is defined as 4 seconds and can be adjusted to the use case.
requests.get(API_URL, headers=headers, timeout=4)
Clean-up To delete all resources from this stack, run:
sam delete --stack-name new-circuit-breaker-sam-stack
Security The provided AWS SAM template does not provide an Amazon Virtual Private Cloud (VPC) in which to host the resources. Integrate the resources into an appropriate networking configuration if you are using it in production applications.
The solution has auditability characteristics, as calls to the circuit breaker and to the microservices are logged to the Amazon CloudWatch log group. The audit log is encrypted using AWS Key Management Service.
To monitor the security of your account with the solution, use Amazon GuardDuty, AWS CloudTrail, AWS Config, and AWS WAF for API Gateway.
Conclusion The circuit breaker pattern is a powerful tool for helping to ensure the resiliency and stability of serverless applications. Lambda extensions are a good fit for its implementation, as demonstrated in this example. With the provided Lambda extension and code, you can incorporate the circuit breaker pattern into your applications and customize it to suit your specific requirements, helping to ensure a robust and reliable system.
For more serverless learning resources, visit Serverless Land.
This post is written by Uri Segev, Principal Serverless Specialist SA.
When you invoke an AWS Lambda function synchronously, you expect the function to return a response. For example, this is the case when a client invokes a Lambda function through Amazon API Gateway or from AWS Step Functions. As the client is waiting for the response, you should return the response as soon as possible.
However, there may be instances where you must perform additional work that does not affect the response and you can do it asynchronously, after you send the response. For example, you may store data in a database or send information to a logging system.
Once you send the response from the function, the Lambda service freezes the runtime environment, and the function cannot run additional code. Even if you create a thread for running a task in the background, the Lambda service freezes the runtime environment once the handler returns, causing the thread to freeze until the next invocation. While you can delay returning the response to the client until all work is complete, this approach can negatively impact the user experience.
This blog explores ways to run a task that may start before the function returns but continues running after the function returns the response to the client.
Invoking an asynchronous Lambda function The first option is to break the code into two functions. The first function runs the synchronous code; the second function runs the asynchronous code. Before the synchronous function returns, it invokes the second function asynchronously, either directly, using the Invoke API, or indirectly, for example, by sending a message to Amazon SQS to trigger the second function.
This Python code demonstrates how to implement this:
import jsonimport timeimport osimport boto3from aws_lambda_powertools import Loggerlogger = Logger()client = boto3.client('lambda')def calc_response(event): logger.info(f"[Function] Calculating response") time.sleep(1) # Simulate sync work return { "message": "hello from async" }def submit_async_task(response): # Invoke async function to continue logger.info(f"[Function] Invoking async task in async function") client.invoke_async(FunctionName=os.getenv('ASYNC_FUNCTION'), InvokeArgs=json.dumps(response))def handler(event, context): logger.info(f"[Function] Received event: {json.dumps(event)}") response = calc_response(event) # Done calculating response, submit async task submit_async_task(response) # Return response to client logger.info(f"[Function] Returning response to client") return { "statusCode": 200, "body": json.dumps(response) }
The following is the Lambda function that performs the asynchronous work:
import jsonimport timefrom aws_lambda_powertools import Loggerlogger = Logger()def handler(event, context): logger.info(f"[Async task] Starting async task: {json.dumps(event)}") time.sleep(3) # Simulate async work logger.info(f"[Async task] Done")
Use Lambda response streaming Response streaming enables developers to start streaming the response as soon as they have the first byte of the response, without waiting for the entire response. You usually use response streaming when you must minimize the Time to First Byte (TTFB) or when you must send a response that is larger than 6 MB (the Lambda response payload size limit).
Using this method, the function can send the response using the response streaming mechanism and can continue running code even after sending the last byte of the response. This way, the client receives the response, and the Lambda function can continue running.
This Node.js code demonstrates how to implement this:
import { Logger } from '@aws-lambda-powertools/logger';const logger = new Logger();export const handler = awslambda.streamifyResponse(async (event, responseStream, _context) => { logger.info("[Function] Received event: ", event); // Do some stuff with event let response = await calc_response(event); // Return response to client logger.info("[Function] Returning response to client"); responseStream.setContentType('application/json'); responseStream.write(response); responseStream.end(); await async_task(response); });const calc_response = async (event) => { logger.info("[Function] Calculating response"); await sleep(1); // Simulate sync work return { message: "hello from streaming" };};const async_task = async (response) => { logger.info("[Async task] Starting async task"); await sleep(3); // Simulate async work logger.info("[Async task] Done");};const sleep = async (sec) => { return new Promise((resolve) => { setTimeout(resolve, sec * 1000); });};
Use Lambda extensions Lambda extensions can augment Lambda functions to integrate with your preferred monitoring, observability, security, and governance tools. You can also use an extension to run your own code in the background so that it continues running after your function returns the response to the client.
There are two types of Lambda extensions: external extensions and internal extensions. External extensions run as separate processes in the same execution environment. The Lambda function can communicate with the extension using files in the /tmp folder or using a local network, for example, via HTTP requests. You must package external extensions as a Lambda layer.
Internal extensions run as separate threads within the same process that runs the handler. The handler can communicate with the extension using any in-process mechanism, such as internal queues. This example shows an internal extension, which is a dedicated thread within the handler process.
When the Lambda service invokes a function, it also notifies all the extensions of the invocation. The Lambda service only freezes the execution environment when the Lambda function returns a response and all the extensions signal to the runtime that they are finished. With this approach, the function has the extension run the task independently from the function itself and the extension notifies the Lambda runtime when it is done processing the task. This way, the execution environment stays active until the task is done.
The following Python code example isolates the extension code into its own file and the handler imports and uses it to run the background task:
import jsonimport timeimport async_processor as apfrom aws_lambda_powertools import Loggerlogger = Logger()def calc_response(event): logger.info(f"[Function] Calculating response") time.sleep(1) # Simulate sync work return { "message": "hello from extension" }# This function is performed after the handler code calls submit_async_task # and it can continue running after the function returnsdef async_task(response): logger.info(f"[Async task] Starting async task: {json.dumps(response)}") time.sleep(3) # Simulate async work logger.info(f"[Async task] Done")def handler(event, context): logger.info(f"[Function] Received event: {json.dumps(event)}") # Calculate response response = calc_response(event) # Done calculating response # call async processor to continue logger.info(f"[Function] Invoking async task in extension") ap.start_async_task(async_task, response) # Return response to client logger.info(f"[Function] Returning response to client") return { "statusCode": 200, "body": json.dumps(response) }
The following Python code demonstrates how to implement the extension that runs the background task:
import osimport requestsimport threadingimport queuefrom aws_lambda_powertools import Loggerlogger = Logger()LAMBDA_EXTENSION_NAME = "AsyncProcessor"# An internal queue used by the handler to notify the extension that it can# start processing the async task.async_tasks_queue = queue.Queue()def start_async_processor(): # Register internal extension logger.debug(f"[{LAMBDA_EXTENSION_NAME}] Registering with Lambda service...") response = requests.post( url=f"http://{os.environ['AWS_LAMBDA_RUNTIME_API']}/2020-01-01/extension/register", json={'events': ['INVOKE']}, headers={'Lambda-Extension-Name': LAMBDA_EXTENSION_NAME} ) ext_id = response.headers['Lambda-Extension-Identifier'] logger.debug(f"[{LAMBDA_EXTENSION_NAME}] Registered with ID: {ext_id}") def process_tasks(): while True: # Call /next to get notified when there is a new invocation and let # Lambda know that we are done processing the previous task. logger.debug(f"[{LAMBDA_EXTENSION_NAME}] Waiting for invocation...") response = requests.get( url=f"http://{os.environ['AWS_LAMBDA_RUNTIME_API']}/2020-01-01/extension/event/next", headers={'Lambda-Extension-Identifier': ext_id}, timeout=None ) # Get next task from internal queue logger.debug(f"[{LAMBDA_EXTENSION_NAME}] Wok up, waiting for async task from handler") async_task, args = async_tasks_queue.get() if async_task is None: # No task to run this invocation logger.debug(f"[{LAMBDA_EXTENSION_NAME}] Received null task. Ignoring.") else: # Invoke task logger.debug(f"[{LAMBDA_EXTENSION_NAME}] Received async task from handler. Starting task.") async_task(args) logger.debug(f"[{LAMBDA_EXTENSION_NAME}] Finished processing task") # Start processing extension events in a separate thread threading.Thread(target=process_tasks, daemon=True, name='AsyncProcessor').start()# Used by the function to indicate that there is work that needs to be # performed by the async task processordef start_async_task(async_task=None, args=None): async_tasks_queue.put((async_task, args))# Starts the async task processorstart_async_processor()
Use a custom runtime Lambda supports several runtimes out of the box: Python, Node.js, Java, Dotnet, and Ruby. Lambda also supports custom runtimes, which lets you develop Lambda functions in any other programming language that you need to.
When you invoke a Lambda function that uses a custom runtime, the Lambda service invokes a process called ‘bootstrap’ that contains your custom code. The custom code needs to interact with the Lambda Runtime API. It calls the /next endpoint to obtain information about the next invocation. This API call is blocking and it waits until a request arrives. When the function is done processing the request, it must call the /response endpoint to send the response back to the client and then it must call the /next endpoint again to wait for the next invocation. Lambda freezes the execution environment after you call /next, until a request arrives.
Using this approach, you can run the asynchronous task after calling /response, and sending the response back to the client, and before calling /next, indicating that the processing is done.
The following Python code example isolates the custom runtime code into its own file and the function imports and uses it to interact with the runtime API:
import timeimport jsonimport runtime_interface as rtfrom aws_lambda_powertools import Loggerlogger = Logger()def calc_response(event): logger.info(f"[Function] Calculating response") time.sleep(1) # Simulate sync work return { "message": "hello from custom" }def async_task(response): logger.info(f"[Async task] Starting async task: {json.dumps(response)}") time.sleep(3) # Simulate async work logger.info(f"[Async task] Done")def main(): # You can add initialization code here # The following loop runs forever waiting for the next invocation # and sending the response back to the client while True: # Call /next to wait for next request (and indicate # that we are done processing the previous request) requestId, event = rt.get_next() # The code from here to send_response() is the code # that usually goes inside the Lambda handler() logger.info(f"[Function] Received event: {json.dumps(event)}") # Calculate response response = calc_response(event) # Done calculating response, send response to client logger.info(f"[Function] Returning response to client") rt.send_response(requestId, { "statusCode": 200, "body": json.dumps(response) }) logger.info(f"[Function] Invoking async task") async_task(response)main()
This Python code demonstrates how to interact with the runtime API:
import requestsimport osfrom aws_lambda_powertools import Loggerlogger = Logger()run_time_endpoint = os.environ['AWS_LAMBDA_RUNTIME_API']def get_next(): logger.debug("[Custom runtime] Waiting for invocation...") request = requests.get( url=f"http://{run_time_endpoint}/2018-06-01/runtime/invocation/next", timeout=None ) event = request.json() requestId = request.headers["Lambda-Runtime-Aws-Request-Id"] return requestId, eventdef send_response(requestId, response): logger.debug("[Custom runtime] Sending response") requests.post( url=f"http://{run_time_endpoint}/2018-06-01/runtime/invocation/{requestId}/response", json = response, timeout=None )
Conclusion This blog shows four ways of combining synchronous and asynchronous tasks in a Lambda function, allowing you to run tasks that continue running after the function returns a response to the client. The following table summarizes the pros and cons of each solution:
Function URLs, cannot be used with API Gateway, always public
| Asynchronous invocation | Response streaming | Lambda extensions | Custom runtime | | Complexity | Easier to implement | Easiest to implement | The most complex solution to implement as it requires interacting with the extensions API and a dedicated thread | Medium as it interacts with the runtime API | | Deployment | Need two artifacts: the synchronous function and the asynchronous function | A single deployment artifact that contains all code | A single deployment artifact that contains all code | A single deployment artifact, requires packaging all needed runtime files | | Cost | Most expensive as it incurs additional invocation cost as well as the overall duration of both functions is higher than having it in one | Least expensive | Least expensive | Least expensive | | Starting the async task | Before returning from handler | Anytime during the handler invocation | Anytime during the handler invocation | After returning the response to the client, unless you use a dedicated thread | | Limitations | Payload sent to the asynchronous function cannot exceed 256 KB | Only supported with Node.js and custom runtimes. Requires Lambda Function URLs, cannot be used with API Gateway, always public | – | – | | Additional benefits | Better decoupling between synchronous and asynchronous code | Ability to send response in stages. Supports payloads larger than 6 MB (at additional cost) | The asynchronous task runs in its own thread, which can reduce overall duration and cost | – | | Retries in case of failure in async code | Managed by the Lambda service | Responsibility of the developer | Responsibility of the developer | Responsibility of the developer |
Choosing the right approach depends on your use case. If you write your function in Node.js and you invoke it using Lambda Function URLs, use response streaming. This is the easiest way to implement, and it is the most cost effective.
If there is a chance for a failure in the asynchronous task (for example, a database is not accessible), and you must ensure that the task completes, use the asynchronous Lambda invocation method. The Lambda service retries your asynchronous function until it succeeds. Eventually, if all retries fail, it invokes a Lambda destination so you can take action.
If you need a custom runtime because you need to use a programming language that Lambda does not natively support, use the custom runtime option. Otherwise, use the Lambda extensions option. It is more complex to implement, but it is cost effective. This allows you to package the code in a single artifact and start processing the asynchronous task before you send the response to the client.
For more serverless learning resources, visit Serverless Land.
This post is written by Ben Freiberg, Senior Solutions Architect.
Developers often choose AWS Step Functions to orchestrate the services that comprise their applications. Step Functions is a visual workflow service that makes it easier for developers to build distributed applications, automate processes, orchestrate microservices, and create data and machine learning (ML) pipelines. Step Functions integrates with over 220 AWS services and any publicly accessible HTTP endpoint. Step Functions provides many features that help developers build, such as built-in error handling, real-time and auditable workflow execution history, and large-scale parallel processing.
Several areas can be time consuming for developers when testing Step Functions workflows. For example, authentication with external services, input/output processing, AWS IAM permission, or intrinsic functions. To simplify and speed up resolving these issues, Step Functions released a new capability last year to test individual states: the TestState API. This feature allows you to test states independently from the execution of your workflow. You can change the input and test different scenarios without the need to deploy your workflow or execute the whole state machine. This feature is available for all task, choice, and pass states.
Since developers spend significant time in IDEs and terminals, TestState is also available via an API. This allows you to iterate over changes for an individual state and lets you refine the input/output processing or conditional logic in a choice state without leaving your IDE. In this post, you’ll learn how the TestState API can speed up your testing and development.
Getting started with TestState Suppose that you are developing a payment processing workflow that consists of three states. First, a Choice state that checks the type of payment based on the input data. Depending on the type, it calls either an AWS Lambda function or an external endpoint. The task state that invokes the Lambda function includes some input/output processing.
To get started with the TestState API, you must create an IAM role that the service can assume. The role must contain the required IAM permissions for the resources your state is accessing. For information about the permissions a state might need, see IAM permissions to test a state. The following snippet shows the minimal necessary permissions:
{ "Version": "2012-10-17", "Statement": [ { "Effect": "Allow", "Action": [ "states:TestState", "iam:PassRole" ], "Resource": "*" } ]}
Next, you must provide the definition of the state being tested. The choice state is configured to check the type of payment and if the voucherId is present, in case of a voucher. The following snippet shows the state definition:
{ "Type": "Choice", "Choices": [ { "And": [ { "Variable": "$.payment.type", "IsPresent": true }, { "Variable": "$.payment.type", "StringEquals": "voucher" } ], "Next": "Process voucher" }, { "Variable": "$.payment.type", "StringEquals": "credit", "Next": "Call payment provider" } ], "Default": "Fail"}
Using the role and state definition, you can now test it if an input results in the expected next state:
aws stepfunctions test-state --definition file://choice.json --role-arn "arn:aws:iam::<account-id>:role/StepFunctions-TestState-Role" --input '{"payment":{"type":"voucher"}}'
The response shows that the test did not encounter any errors and that the next state would be invoking the Lambda function to process the voucher as expected.
{ "output": "{\"payment\":{\"type\":\"voucher\"}}", "nextState": "Process voucher", "status": "SUCCEEDED"}
Similarly, with a payment type of credit as input, the next state is invoking the third-party endpoint:
aws stepfunctions test-state--definition file://choice.json--role-arn "arn:aws:iam::<account-id>:role/StepFunctions-TestState-Role"--input '{"payment":{"type":"credit"}}'
{ "output": "{\"payment\":{\"type\":\"credit\"}}", "nextState": "Call payment provider", "status": "SUCCEEDED"}
Because the TestState API takes the state definition as an argument, you do not have to redeploy the state machine when changing the state definition. Instead, you can iterate and test your settings by passing the modified state definition to the TestState API.
Using inspection levels For each state, you can specify the amount of detail you want to view in the test results. These details provide additional information about the state that you are testing. For example, if you’ve used any input and output data processing filters, such as InputPath or ResultPath in a state, you can view the intermediate and final data processing results. Step Functions provides the following levels to specify the details you want to view, INFO, DEBUG, and TRACE. All these levels return the status and nextState fields.
Next, the Lambda Invoke state is tested. In this scenario, the state includes input/output processing. The output from the function is transformed by renaming and restructuring the field and then merged with the original input. This is the relevant part of the task definition:
"Process voucher": { "Type": "Task", "Resource": "arn:aws:states:::lambda:invoke", "Parameters": {...}, "Retry": [...], "Next": "Success", "ResultPath": "$.voucherProcessed", "ResultSelector": { "status.$": "$.Payload.result", "workflowId.$": "$.Payload.workflow" }}
This time test using the Step Functions console, which can make it easier to understand the input/output processing steps. To get started, open the state machine in Workflow Studio and select the state, and then choose Test State. Make sure to select DEBUG as the inspection level. After testing the state, switch to the Input/output processing tab to check the intermediate steps.
When you call the TestState API and set the inspectionLevel parameter to DEBUG, the API response includes an object called inspectionData. This object contains fields to help you inspect how data was filtered or manipulated within the state when it was executed. This data is shown in the Input/output processing tab in the console.
Being able to see all the processing steps easily in one place allows developers to spot issues and iterate more quickly, saving time.
Testing third-party endpoint integrations Applications might call third-party endpoints that require authentication. Step Functions offers the HTTPS endpoint resource to connect to third-party HTTP targets outside of the AWS Cloud.
HTTPS endpoints use Amazon EventBridge connections to manage the authentication credentials for the target. This defines the authorization type used, which can be a basic authentication with a username and password, an API key, or OAuth. EventBridge connections use AWS Secrets Manager to store the secret. This keeps the secrets out of the state machine, reducing the risks of accidentally exposing your secrets in logs or in the state machine definition.
Getting the authentication configuration right might involve several time-consuming iterations. With the TRACE inspection level, developers can see the raw HTTP request and response, which is useful for verifying headers, query parameters, and other API-specific details. This option is only available for the HTTP Task. You can also view the secrets included in the EventBridge connection. To do this, you must set the revealSecrets parameter to true in the TestState API. This can help verifying that the correct authentication parameters are used.
To get started, ensure that the execution role used for testing has the necessary permissions, as shown here:
{ "Version": "2012-10-17", "Statement": [ { "Effect": "Allow", "Action": [ "secretsmanager:GetSecretValue", "secretsmanager:DescribeSecret" ], "Resource": "arn:aws:secretsmanager:<your-region>:<account-id>:secret:events!connection/<your-connection-id>" } ]}{ "Version": "2012-10-17", "Statement": [ { "Sid": "RetrieveConnectionCredentials", "Effect": "Allow", "Action": [ "events:RetrieveConnectionCredentials" ], "Resource": [ "arn:aws:events:<your-region>:<account-id>:connection/<your-connection-id>" ] } ]}{ "Version": "2012-10-17", "Statement": [ { "Sid": "InvokeHTTPEndpoint", "Effect": "Allow", "Action": [ "states:InvokeHTTPEndpoint" ], "Resource": [ "arn:aws:states:<your-region>:<account-id>:stateMachine:<your-statemachine>" ] } ]}
When you test the HTTP task, make sure to set the inspection level to TRACE. Then use the HTTP request and response tab to check the details. This capability saves you time when debugging complex authentication issues.
Automating testing Testing is not only a manual activity to get the configuration right. Most often, tests are run as part of a suite of tests, which are automatically performed to validate the correct behavior. It also prevents regressions when making changes. The TestState API can easily be integrated in such tests as well.
The following snippet shows a test using the Jest framework in JavaScript. The test checks if the correct next state is produced given a definition and input. The definition resides in a different file, which can also be used for infrastructure as code (IaC) to create the state machine.
const { SFNClient, TestStateCommand } = require("@aws-sdk/client-sfn");// Import the state definition const definition = require("./definition.json");const client = new SFNClient({});describe("Step Functions", () => { test("that next state is correct", async () => { const command = new TestStateCommand({ definition: JSON.stringify(definition), roleArn: "arn:aws:iam::<account-id>:role/<role-with-sufficient-permissions>", input: "{}" # Adjust as necessary }); const data = await client.send(command); expect(data.status).toBe("SUCCEEDED"); expect(data.nextState).toBe("Success"); # Adjust as necessary });});
With automated tests, you can safely change your workflow definitions without the need for manual efforts. That way, you are immediately alerted if a change would result in an incompatibility.
With TestState you can increase your test coverage with less effort because you can test states directly. This is especially helpful for complex workflows and states that require a specific set of circumstances to reach them. It makes it easier to validate the correctness of your error-handling as well. You can now test the potentially many combinations of your configured Retriers and Catchers much easier.
Conclusion The TestState API helps developers to iterate faster, resolve issues efficiently, and deliver high-quality applications with greater confidence. By enabling developers to test individual states independently and integrating testing into their preferred development workflows, it simplifies the debugging process and reduces context switches. Whether testing input/output processing, authentication with external services, or third-party endpoint integrations, the TestState API can be a useful tool for testing.
This blog post is written by Brianna Rosentrater, Hybrid Edge Specialist SA.
AWS Elastic Disaster Recovery Service (AWS DRS) now supports disaster recovery (DR) architectures that include on-premises Windows and Linux workloads running on AWS Outposts. AWS DRS minimizes downtime and data loss with fast, reliable recovery of on-premises and cloud-based applications using affordable storage, minimal compute, and point-in-time recovery. Both services are billed and managed from your AWS Management Console.
Like workloads running in AWS Regions, it’s critical to plan for failures. Outposts are designed with resiliency in mind, providing redundant power, networking, and are available to order with N+M active compute instance capacity. In other words, for every physical N compute servers, you have the option of including M redundant hosts capable of handling the workload during a failure. When leveraging AWS DRS with Outpost, you can plan for larger-scale failure modes, such as data center outages, by replicating mission-critical workloads to other remote data center locations or the AWS Region.
In this post, you’ll learn how AWS DRS can be used with Outpost rack to architect for disaster recovery in the event of a site failure. The post will examine several different architectures enabled by AWS DRS that provide DR for Outpost, and the benefits of each method described.
Prerequisites Each of these architectures described below need the following:
- At least one Outpost rack
- Outpost(s) must be in Direct VPC Routing (DVR) mode
- Amazon S3 on Outposts (required for all AWS DRS replication destinations)
- An AWS Replication Agent installed on each source server
Public internet access isn’t needed, AWS PrivateLink and AWS Direct Connect are supported for replication and failback which is a significant security benefit.
Planning for failure Disasters come in many forms and are often unplanned and unexpected events. Regardless of whether your workload resides on premises, in a colocation facility, or in an AWS Region, it’s critical to define the Recovery Time Objective (RTO) and Recovery Point Objective (RPO) which are often workload-specific. These two metrics profile how long a service can be down during recovery and quantify the acceptable amount of data loss. RTO and RPO guide you in choosing the appropriate strategy such as backup and recovery, pilot light, warm standby, or a multi-site (active-active) approach.
With AWS DRS, while failing back to a test machine (not the original source server), replication of the source server continues. This allows failback drills without impacting RPO, and non-disruptive failback drills are an important part of disaster planning to validate your recovery plan meets your expected RPO/RTO as per your business requirements.
How AWS DRS integrates with Outpost AWS DRS uses an AWS Replication Agent at the source to capture the workload and transfer it to a lightweight staging area, which resides on an Outpost equipped with Amazon S3 on Outposts. This method also provides the ability to perform low-effort, non-disruptive DR drills before making the final cutover. The AWS Replication Agent doesn’t need a reboot nor does it impact your applications during installation.
When an Outpost’s subnet is selected as the target for replication or launch, all associated AWS DRS components remain within the Outpost, including the AWS DRS server conversion technology. These conversion servers convert source disks of servers being migrated so that they can boot and run in the target infrastructure, Amazon EBS volumes, snapshots, and replication servers. The replication servers replicate the disks to the target infrastructure. With AWS DRS you can control the data replication path using private connectivity options such as a virtual private network (VPN), AWS Direct Connect, VPC peering, or another private connection. Learn more about using a private IP for data replication.
AWS DRS provides nearly continuous replication for mission-critical workloads and supports deployment patterns including on-premises to Outpost, Outpost to Region, Region to Outpost, and between two logical Outposts through local networks. To leverage Outpost with AWS DRS, simply select the Outpost subnet as your target or source for replication when configuring AWS DRS for your workload. If you are currently using CloudEndure DR for disaster recovery with Outpost, see these detailed instructions for migrating to AWS DRS from CloudEndure DR.
DR from on-premises to Outpost Outpost can be used as a DR target for on-premises workloads. By deploying an Outpost in a remote data center or colocation a significant distance from the source within the same geo-political boundary, you can replicate workloads across great distances and increase resiliency of the data while ensuring adherence to data residency policies or legislation.
Figure 1 – DR from on-premises to Outposts
In Figure 1, on premises sources replicate traffic from a LAN to a staging area residing in an Outpost subnet via the local gateway. This allows workloads to failover from their on-premises environment to an Outpost in a different physical location during a disaster.
The staging areas and replication servers run on Amazon Elastic Compute Cloud (Amazon EC2) with Amazon EBS volumes and require Amazon S3 on Outposts where the Amazon EBS snapshots reside.
The replication agent is responsible for providing nearly continuous, block-level replication from your LAN using TCP/1500 with traffic routing to Amazon EC2 instances using the Outposts local gateway.
DR from Outpost to Region Since its initial release, Outpost has supported Amazon EBS snapshots written to Amazon S3 located in the AWS Region. Backup to an AWS Region is one of the most cost-effective and easiest-to-configure DR approaches, enabling data redundancy outside of your Outpost and data center.
This method also offers flexibility for restoration within an AWS Region if the original deployment is irrecoverable. However, depending on the frequency of the snapshots and the timing of the failure, backup, and recovery to the Region has the potential to have an RPO/RTO spanning hours depending on the throughput of the service link.
For critical workloads, AWS DRS can reduce RTO to minutes and RPO in the sub-second range. After creating an initial replication of workloads that reside on the Outpost, AWS DRS provides nearly continuous, block-level replication in the Region. Just like replication from non-AWS virtual machines or bare metal servers, AWS DRS resources, including Replication Servers, Conversion Servers, Amazon EBS Volumes, and Snapshots reside in the Region.
Figure 2 – DR from Outpost to Region
In Figure 2, data replication is performed over the service link from Amazon EC2 instances running locally on an Outpost to an AWS Region. The service link traverses either public Region connectivity or AWS Direct Connect.
AWS Direct Connect is the recommended option because it provides low latency and consistent bandwidth for the service link back to a Region, which also improves the reliability of transmission for AWS DRS replication traffic.
The service link is comprised of redundant, encrypted VPN tunnels. Replication traffic can also be sent privately without traversing the public internet by leveraging Private Virtual Interfaces with Direct Connect for the service link.
With this architecture in place, you can mitigate disasters and reduce downtime by failing over to the AWS Region using AWS DRS.
DR from Region to Outpost AWS provides multiple Availability Zones (AZs) within a Region and isolated AWS Regions globally for the greatest possible fault tolerance and stability. The reliability pillar of AWS’s Well-Architected Framework encourages distributing workloads across AZs and replicating data between Regions when the need for distances exceeds those of AZs.
AWS DRS supports nearly continuous replication of workloads from a Region to an Outpost within your data center or colocation facility for DR. This deployment model provides increased durability from a source AWS Region to an Outpost anchored to a different Region.
In this model, AWS DRS components remain on-premises within the Outpost, but data charges are applicable as data egresses from the Region back to the data center and Amazon S3 on Outposts is required on the destination Outpost.
Figure 3 – DR from Region to Outpost
Implementing the preceding architecture diagram enables failover of critical workloads from the Region to on-premises Outposts seamlessly. Keep in mind that AWS Regions provide the management and control plane for Outpost, making it critical to consider probability and frequency of service link interruptions as a part of your DR planning. Scenarios such as warm standby with pre-allocated Amazon EC2 and Amazon EBS resources may prove more resilient during service link disruptions.
DR between two Outposts Each logical Outpost is comprised of one or more physical racks. Logical Outposts are in independent colocations of one another, and support deployments in disparate data centers or colocation facilities. You can elect to have multiple logical Outposts anchored to different Availability Zones or Regions. AWS DRS unlocks options for replication between two logical Outposts, leading to increased resiliency and reducing the impact of your data center as a single point of failure. In the following architecture, nearly continuous replication captured from a single Outpost source is applied at a second logical Outpost.
Figure 4 – DR between two Outposts
Supporting both directional and bidirectional replication between Outposts can minimize disruption caused by events that take down a data center, Availability Zone, or even the entire Region result in minimal disruption. In the following architecture diagram, bidirectional data replication occurs between the Outposts by routing traffic via the local gateways, minimizing outbound data charges from the Region and allowing for more direct routing between deployment sites that could potentially span significant distances. AWS DRS cannot communicate with resources directly utilizing a customer-owned IP address pool (CoIP pool).
Figure 5 – DR between two Outposts – bidirectional
Architecture Considerations When planning an Outpost deployment leveraging AWS DRS, it’s critical to consider the impact on storage. As a general best practice, AWS recommends planning for a 2:1 ratio consisting of EBS volumes used for nearly continuous replication and Amazon EBS snapshots on Amazon S3 for point-in-time recovery. While it’s unlikely that all servers would need recovery simultaneously, it’s also important to allocate a reserve of EBS volume capacity, which will launch at the time of recovery. Amazon S3 on Outpost is needed for each Outpost used as a replication destination, and the recommendation is to plan for a 1:1 ratio consisting of S3 on Outposts storage, plus the rate of data change. For example, if your data change rate is 10%, you’d want to plan for 110% S3 on Outpost use with AWS DRS.
Amazon CloudWatch has integrated metrics for EC2, Amazon EBS, and Amazon S3 capacity on Outposts, making it easy to create custom tailored dashboards and integrate with Simple Notification Service (Amazon SNS) for alerts at defined thresholds. Monitoring these metrics is critical in making sure that proper free space is available for data replication to occur unimpeded. CloudWatch has metrics available for AWS DRS as well. You can also use the AWS DRS service page in the AWS Console to monitor the status of your recovery instances.
Consider taking advantage of Recovery Plans within AWS DRS to make sure that related services are recovered in a particular order. For example, during a disaster, it might be critical to first bring up a database before recovering application tiers. Recovery plans provide the ability to group related services and apply wait times to individual targets.
Conclusion AWS Outpost enables low latency, data residency, or data gravity-constrained workloads by supplying managed cloud compute and storage services within your data center or colocation. When coupled with AWS DRS, you can decrease RPO and RTO through a variety of flexible deployment models with sources and destinations ranging from on-premises, the Region, or another AWS Outpost.
Welcome to the 25th edition of the AWS Serverless ICYMI (in case you missed it) quarterly recap. Every quarter, we share all the most recent product launches, feature enhancements, blog posts, webinars, live streams, and other interesting things that you might have missed!
In case you missed our last ICYMI, check out what happened last quarter here.
2024 Q1 calendar
Adobe Summit At the Adobe Summit, the AWS Serverless Developer Advocacy team showcased a solution developed for the NFL using AWS serverless technologies and Adobe Photoshop APIs. The system automates image processing tasks, including background removal and dynamic resizing, by integrating AWS Step Functions, AWS Lambda, Amazon EventBridge, and AI/ML capabilities via Amazon Rekognition. This solution reduced image processing time from weeks to minutes and saved the NFL significant costs. Combining cloud-based serverless architectures with advanced machine learning and API technologies can optimize digital workflows for cost-effective and agile digital asset management.
Adobe Summit ServerlessVideo
ServerlessVideo is a demo application to stream live videos and also perform advanced post-video processing. It uses several AWS services, including Step Functions, Lambda, EventBridge, Amazon ECS, and Amazon Bedrock in a serverless architecture that makes it fast, flexible, and cost-effective. The team used ServerlessVideo to interview attendees about the conference experience and Adobe and partners about how they use Adobe. Learn more about the project and watch videos from Adobe Summit 2024 at video.serverlessland.com.
AWS Lambda AWS launched support for the latest long-term support release of .NET 8, which includes API enhancements, improved Native Ahead of Time (Native AOT) support, and improved performance.
AWS Lambda .NET 8
Learn how to compare design approaches for building serverless microservices. This post covers the trade-offs to consider with various application architectures. See how you can apply single responsibility, Lambda-lith, and read and write functions.
The AWS Serverless Java Container has been updated. This makes it easier to modernize a legacy Java application written with frameworks such as Spring, Spring Boot, or JAX-RS/Jersey in Lambda with minimal code changes.
AWS Serverless Java Container
Lambda has improved the responsiveness for configuring Event Source Mappings (ESMs) and Amazon EventBridge Pipes with event sources such as self-managed Apache Kafka, Amazon Managed Streaming for Apache Kafka (MSK), Amazon DocumentDB, and Amazon MQ.
Chaos engineering is a popular practice for building confidence in system resilience. However, many existing tools assume the ability to alter infrastructure configurations, and cannot be easily applied to the serverless application paradigm. You can use the AWS Fault Injection Service (FIS) to automate and manage chaos experiments across different Lambda functions to provide a reusable testing method.
Amazon ECS and AWS Fargate Amazon Elastic Container Service (Amazon ECS) now provides managed instance draining as a built-in feature of Amazon ECS capacity providers. This allows Amazon ECS to safely and automatically drain tasks from Amazon Elastic Compute Cloud (Amazon EC2) instances that are part of an Amazon EC2 Auto Scaling Group associated with an Amazon ECS capacity provider. This simplification allows you to remove custom lifecycle hooks previously used to drain Amazon EC2 instances. You can now perform infrastructure updates such as rolling out a new version of the ECS agent by seamlessly using Auto Scaling Group instance refresh, with Amazon ECS ensuring workloads are not interrupted.
Credentials Fetcher makes it easier to run containers that depend on Windows authentication when using Amazon EC2. Credentials Fetcher now integrates with Amazon ECS, using either the Amazon EC2 launch type, or AWS Fargate serverless compute launch type.
Amazon ECS Service Connect is a networking capability to simplify service discovery, connectivity, and traffic observability for Amazon ECS. You can now more easily integrate certificate management to encrypt service-to-service communication using Transport Layer Security (TLS). You do not need to modify your application code, add additional network infrastructure, or operate service mesh solutions.
Amazon ECS Service Connect
Running distributed machine learning (ML) workloads on Amazon ECS allows ML teams to focus on creating, training and deploying models, rather than spending time managing the container orchestration engine. Amazon ECS provides a great environment to run ML projects as it supports workloads that use NVIDIA GPUs and provides optimized images with pre-installed NVIDIA Kernel drivers and Docker runtime.
See how to build preview environments for Amazon ECS applications with AWS Copilot. AWS Copilot is an open source command line interface that makes it easier to build, release, and operate production ready containerized applications.
Learn techniques for automatic scaling of your Amazon Elastic Container Service (Amazon ECS) container workloads to enhance the end user experience. This post explains how to use AWS Application Auto Scaling which helps you configure automatic scaling of your Amazon ECS service. You can also use Amazon ECS Service Connect and AWS Distro for OpenTelemetry (ADOT) in Application Auto Scaling.
AWS Step Functions AWS workloads sometimes require access to data stored in on-premises databases and storage locations. Traditional solutions to establish connectivity to the on-premises resources require inbound rules to firewalls, a VPN tunnel, or public endpoints. Discover how to use the MQTT protocol (AWS IoT Core) with AWS Step Functions to dispatch jobs to on-premises workers to access or retrieve data stored on-premises.
You can use Step Functions to orchestrate many business processes. Many industries are required to provide audit trails for decision and transactional systems. Learn how to build a serverless pipeline to create a reliable, performant, traceable, and durable pipeline for audit processing.
Amazon EventBridge Amazon EventBridge now supports publishing events to AWS AppSync GraphQL APIs as native targets. The new integration allows you to publish events easily to a wider variety of consumers and simplifies updating clients with near real-time data.
Amazon EventBridge publishing events to AWS AppSync
Discover how to send and receive CloudEvents with EventBridge. CloudEvents is an open-source specification for describing event data in a common way. You can publish CloudEvents directly to EventBridge, filter and route them, and use input transformers and API Destinations to send CloudEvents to downstream AWS services and third-party APIs.
AWS Application Composer AWS Application Composer lets you create infrastructure as code templates by dragging and dropping cards on a virtual canvas. These represent CloudFormation resources, which you can wire together to create permissions and references. Application Composer has now expanded to the VS Code IDE as part of the AWS Toolkit. This now includes a generative AI partner that helps you write infrastructure as code (IaC) for all 1100+ AWS CloudFormation resources that Application Composer now supports.
AWS AppComposer generate suggestions
Amazon API Gateway Learn how to consume private Amazon API Gateway APIs using mutual TLS (mTLS). mTLS helps prevent man-in-the-middle attacks and protects against threats such as impersonation attempts, data interception, and tampering.
Serverless at AWS re:Invent Serverless at AWS reInvent
Visit the Serverless Land YouTube channel to find a list of serverless and serverless container sessions from reinvent 2023. Hear from experts like Chris Munns and Julian Wood in their popular session, Best practices for serverless developers, or Nathan Peck and Jessica Deen in Deploying multi-tenant SaaS applications on Amazon ECS and AWS Fargate.
Serverless blog posts January * Using generative infrastructure as code with Application Composer * Consuming private Amazon API Gateway APIs using mutual TLS * Invoking on-premises resources interactively using AWS Step Functions and MQTT * Build real-time applications with Amazon EventBridge and AWS AppSync
February * Re-platforming Java applications using the updated AWS Serverless Java Container * Introducing the .NET 8 runtime for AWS Lambda
March * Comparing design approaches for building serverless microservices * Sending and receiving CloudEvents with Amazon EventBridge * Automating chaos experiments with AWS Fault Injection Service and AWS Lambda
Serverless container blog posts January * Signing and Validating OCI Artifacts with AWS Signer * Amazon ECS enables easier EC2 capacity management, with managed instance draining * Secure Amazon Elastic Container Service workloads with Amazon ECS Service Connect * Build preview environments for Amazon ECS applications with AWS Copilot
February * How Perry Street Software Implemented Resilient Deployment Strategies with Amazon ECS * Distributed machine learning with Amazon ECS
December * Windows authentication with gMSA on Linux containers on Amazon ECS with AWS Fargate * Scale your Amazon ECS using different AWS native services!
Serverless Office Hours Serverless Office Hours
January
- Jan 9 – Introducing ServerlessVideo
- Jan 16 – Serverless Containers
- Jan 23 – API Gateway private integrations
- Jan 30 – Connecting to Salesforce using EventBridge
February
- Feb 6 – Comparing Apache Airflow and Step Functions
- Feb 13 – Refactoring Java applications to serverless
- Feb 20 – Lambda performance tuning
- Feb 27 – Building well architected API Gateway APIs
March
- Mar 5 – Using the new .NET 8 runtime in Lambda
- Mar 12 – Combining Kafka and EventBridge
- Mar 19 – Java AI/ML on Lambda with Human Graphics
- Mar 26 – Lambda low latency runtime
Containers from the Couch Containers from the Couch
January
- Jan 4 – A deep dive into autoscaling on Amazon ECS
- Jan 25 – Optimize workloads for speed and cost
February
- Feb 8 – Building your containers on Windows with Finch
- Feb 15 – ECS Builder Series with Autodesk
- Feb 29 – Amazon GuardDuty ECS Runtime Monitoring
March
- Mar 21 – Accelerating modern application development with Amazon ECS
FooBar Serverless FooBar Serverless
January * Jan 11 – Bedrock Agents and Knowledge bases from a developer perspective with Demo! * Jan 18 – What’s new in AppComposer? Integration with Visual Studio Code and Step Functions Workflow Studio! * Jan 24 – Step Functions optimized integration with Amazon Bedrock
February * Feb 1 – Introduction to AWS Step Functions – what is this service for? Use cases? Benefits? * Feb 8 – Must know concepts to work with Step Functions | State types, data management, and workflow types * Feb 15 – Create your AWS Step Functions workflows with AWS SAM * Feb 22 – Create your AWS Step Functions workflows with AWS CDK * Feb 29 – Step Functions Service Integration Patterns
March * Mar 7 – Step Functions Error Handling Mechanisms * Mar 14 – Mastering AWS Step Functions: Cost Analysis and Optimization Techniques with Ben Smith * Mar 21 – Advanced Step Functions Patterns with Ben Smith * Mar 28 – Run a long execution job with no hassle and for free with Step Functions
Still looking for more? The Serverless landing page has more information. The Lambda resources page contains case studies, webinars, whitepapers, customer stories, reference architectures, and even more Getting Started tutorials.
You can also follow the Serverless Developer Advocacy team on Twitter to see the latest news, follow conversations, and interact with the team.
| * James Beswick: @jbesw * Eric Johnson: @edjgeek * Ben Smith: @benjamin_l_s * Julian Wood: @julian_wood | * Marcia Villalba: @mavi888uy * David Boyne: @boyney123 * Maish Saidel-Keesing @maishsk * Olly Pomeroy @oliver-p |
And finally, visit the Serverless Land and Containers on AWS websites for all your serverless and serverless container needs.
This post is written by Robert Northard – AWS Container Specialist Solutions Architect, and Carlos Manzanedo Rueda – AWS WW SA Leader for Efficient Compute
Karpenter is an open source node lifecycle management project built for Kubernetes. In this post, you will learn how to use the new Spot-to-Spot consolidation functionality released in Karpenter v0.34.0, which helps further optimize your cluster. Amazon Elastic Compute Cloud (Amazon EC2) Spot Instances are spare Amazon EC2 capacity available for up to 90% off compared to On-Demand prices. One difference between On-Demand and Spot is that Spot Instances can be interrupted by Amazon EC2 when the capacity is needed back. Karpenter’s built-in support for Spot Instances allows users to seamlessly implement Spot best practices and helps users optimize the cost of stateless, fault tolerant workloads. For example, when Karpenter observes a Spot interruption, it automatically starts a new node in response.
Karpenter provisions nodes in response to unschedulable pods based on aggregated CPU, memory, volume requests, and other scheduling constraints. Over time, Karpenter has added functionality to simplify instance lifecycle configuration, providing a termination controller, instance expiration, and drift detection. Karpenter also helps optimize Kubernetes clusters by selecting the optimal instances while still respecting Kubernetes pod-to-node placement nuances, such as nodeSelector, affinity and anti-affinity, taints and tolerations, and topology spread constraints.
The Kubernetes scheduler assigns pods to nodes based on their scheduling constraints. Over time, as workloads are scaled out and scaled in or as new instances join and leave, the cluster placement and instance load might end up not being optimal. In many cases, it results in unnecessary extra costs. Karpenter has a consolidation feature that improves cluster placement by identifying and taking action in situations such as:
- when a node is empty
- when a node can be removed as the pods that are running on it can be rescheduled into other existing nodes
- when the number of pods in a node has gone down and the node can now be replaced with a lower-priced and rightsized variant (which is shown in the following figure)
Karpenter consolidation, replacing one 2xlarge Amazon EC2 Instance with an xlarge Amazon EC2 Instance.
Karpenter versions prior to v0.34.0 only supported consolidation for Amazon EC2 On-Demand Instances. On-Demand consolidation allowed consolidating from On-Demand into Spot Instances and to lower-priced On-Demand Instances. However, once a pod was placed on a Spot Instance, Spot nodes were only removed when the nodes were empty. In v0.34.0, you can enable the feature gate to use Spot-to-Spot consolidation.
Solution overview When launching Spot Instances, Karpenter uses the price-capacity-optimized allocation strategy when calling the Amazon EC2 instant Fleet API (shown in the following figure) and passes in a selection of compute instance types based on the Karpenter NodePool configuration. The Amazon EC2 Fleet API in instant mode is a synchronous API call that immediately returns a list of instances that launched and any instance that could not be launched. For any instances that could not be launched, Karpenter might request alternative capacity or remove any soft Kubernetes scheduling constraints for the workload.
Karpenter instance orchestration
Spot-to-Spot consolidation needed an approach that was different from On-Demand consolidation. For On-Demand consolidation, rightsizing and lowest price are the main metrics used. For Spot-to-Spot consolidation to take place, Karpenter requires a diversified instance configuration (see the example NodePool defined in the walkthrough) with at least 15 instances types. Without this constraint, there would be a risk of Karpenter selecting an instance that has lower availability and, therefore, higher frequency of interruption.
Prerequisites The following prerequisites are required to complete the walkthrough:
- Install an Amazon Elastic Kubernetes Service (Amazon EKS) cluster (version 1.29 or higher) with Karpenter (v0.34.0 or higher). The Karpenter Getting Started Guide provides steps for setting up an Amazon EKS cluster and adding Karpenter.
- Enable replacement with Spot consolidation through the SpotToSpotConsolidation feature gate. This can be enabled during a helm install of the Karpenter chart by adding –-set settings.featureGates.spotToSpotConsolidation=true argument.
- Install kubectl, the Kubernetes command line tool for communicating with the Kubernetes control plane API, and kubectl context configured with Cluster Operator and Cluster Developer permissions.
Walkthrough The following walkthrough guides you through the steps for simulating Spot-to-Spot consolidation.
1. Create a Karpenter NodePool and EC2NodeClass Create a Karpenter NodePool and EC2NodeClass. Replace the following with your own values. If you used the Karpenter Getting Started Guide to create your installation, then the value would be your cluster name.
- Replace
with your subnet tag for Karpenter subnet and security group auto-discovery. - Replace
with the name of the AWS Identity and Access Management (IAM) role for node identity.
cat <<EOF > nodepool.yamlapiVersion: karpenter.sh/v1beta1kind: NodePoolmetadata: name: defaultspec: template: metadata: labels: intent: apps spec: nodeClassRef: name: default requirements: - key: karpenter.sh/capacity-type operator: In values: ["spot"] - key: karpenter.k8s.aws/instance-category operator: In values: ["c","m","r"] - key: karpenter.k8s.aws/instance-size operator: NotIn values: ["nano","micro","small","medium"] - key: karpenter.k8s.aws/instance-hypervisor operator: In values: ["nitro"] limits: cpu: 100 memory: 100Gi disruption: consolidationPolicy: WhenUnderutilized---apiVersion: karpenter.k8s.aws/v1beta1kind: EC2NodeClassmetadata: name: defaultspec: amiFamily: Bottlerocket subnetSelectorTerms: - tags: karpenter.sh/discovery: "<karpenter-discovery-tag-value>" securityGroupSelectorTerms: - tags: karpenter.sh/discovery: "<karpenter-discovery-tag-value>" role: "<role-name>" tags: Name: karpenter.sh/nodepool/default IntentLabel: "apps"EOFkubectl apply -f nodepool.yaml
The NodePool definition demonstrates a flexible configuration with instances from the C, M, or R EC2 instance families. The configuration is restricted to use smaller instance sizes but is still diversified as much as possible. For example, this might be needed in scenarios where you deploy observability DaemonSets. If your workload has specific requirements, then see the supported well-known labels in the Karpenter documentation.
2. Deploy a sample workload Deploy a sample workload by running the following command. This command creates a Deployment with five pod replicas using the pause container image:
cat <<EOF > inflate.yamlapiVersion: apps/v1kind: Deploymentmetadata: name: inflatespec: replicas: 5 selector: matchLabels: app: inflate template: metadata: labels: app: inflate spec: nodeSelector: intent: apps containers: - name: inflate image: public.ecr.aws/eks-distro/kubernetes/pause:3.2 resources: requests: cpu: 1 memory: 1.5GiEOFkubectl apply -f inflate.yaml
Next, check the Kubernetes nodes by running a kubectl get nodes CLI command. The capacity pool (instance type and Availability Zone) selected depends on any Kubernetes scheduling constraints and spare capacity size. Therefore, it might differ from this example in the walkthrough. You can see Karpenter launched a new node of instance type c6g.2xlarge, an AWS Graviton2-based instance, in the eu-west-1c Region:
$ kubectl get nodes -L karpenter.sh/nodepool -L node.kubernetes.io/instance-type -L topology.kubernetes.io/zone -L karpenter.sh/capacity-typeNAME STATUS ROLES AGE VERSION NODEPOOL INSTANCE-TYPE ZONE CAPACITY-TYPEip-10-0-12-17.eu-west-1.compute.internal Ready <none> 80s v1.29.0-eks-a5ec690 default c6g.2xlarge eu-west-1c spot
3. Scale in a sample workload to observe consolidation To invoke a Karpenter consolidation event scale, inflate the deployment to 1. Run the following command:
kubectl scale --replicas=1 deployment/inflate
Tail the Karpenter logs by running the following command. If you installed Karpenter in a different Kubernetes namespace, then replace the name for the -n argument in the command:
kubectl -n karpenter logs -l app.kubernetes.io/name=karpenter --all-containers=true -f --tail=20
After a few seconds, you should see the following disruption via consolidation message in the Karpenter logs. The message indicates the c6g.2xlarge Spot node has been targeted for replacement and Karpenter has passed the following 15 instance types—m6gd.xlarge, m5dn.large, c7a.xlarge, r6g.large, r6a.xlarge and 10 other(s)—to the Amazon EC2 Fleet API:
{"level":"INFO","time":"2024-02-19T12:09:50.299Z","logger":"controller.disruption","message":"disrupting via consolidation replace, terminating 1 candidates ip-10-0-12-181.eu-west-1.compute.internal/c6g.2xlarge/spot and replacing with spot node from types m6gd.xlarge, m5dn.large, c7a.xlarge, r6g.large, r6a.xlarge and 10 other(s)","commit":"17d6c05","command-id":"60f27cb5-98fa-40fb-8231-05b31fd41892"}
Check the Kubernetes nodes by running the following kubectl get nodes CLI command. You can see that Karpenter launched a new node of instance type c6g.large:
$ kubectl get nodes -L karpenter.sh/nodepool -L node.kubernetes.io/instance-type -L topology.kubernetes.io/zone -L karpenter.sh/capacity-typeNAME STATUS ROLES AGE VERSION NODEPOOL INSTANCE-TYPE ZONE CAPACITY-TYPEip-10-0-12-156.eu-west-1.compute.internal Ready <none> 2m1s v1.29.0-eks-a5ec690 default c6g.large eu-west-1c spot
Use kubectl get nodeclaims to list all objects of type NodeClaim and then describe the NodeClaim Kubernetes resource using kubectl get nodeclaim/
apiVersion: karpenter.sh/v1beta1kind: NodeClaim...spec: nodeClassRef: name: default requirements: ... - key: node.kubernetes.io/instance-type operator: In values: - c5.large - c5ad.large - c6g.large - c6gn.large - c6i.large - c6id.large - c7a.large - c7g.large - c7gd.large - m6a.large - m6g.large - m6gd.large - m7g.large - m7i-flex.large - r6g.large...
What would happen if a Spot node could not be consolidated? If a Spot node cannot be consolidated because there are not 15 instance types in the compute selection, then the following message will appear in the events for the NodeClaim object. You might get this event if you overly constrained your instance type selection:
Normal Unconsolidatable 31s karpenter SpotToSpotConsolidation requires 15 cheaper instance type options than the current candidate to consolidate, got 1
Spot best practices with Karpenter The following are some best practices to consider when using Spot Instances with Karpenter.
- Avoid overly constraining instance type selection: Karpenter selects Spot Instances using the price-capacity-optimized allocation strategy, which balances the price and availability of AWS spare capacity. Although a minimum of 15 instances are needed, you should avoid constraining instance types as much as possible. By not constraining instance types, there is a higher chance of acquiring Spot capacity at large scales with a lower frequency of Spot Instance interruptions at a lower cost.
- Gracefully handle Spot interruptions and consolidation actions: Karpenter natively handles Spot interruption notifications by consuming events from an Amazon Simple Queue Service (Amazon SQS) queue, which is populated with Spot interruption notifications through Amazon EventBridge. As soon as Karpenter receives a Spot interruption notification, it gracefully drains the interrupted node of any running pods while also provisioning a new node for which those pods can schedule. With Spot Instances, this process needs to complete within 2 minutes. For a pod with a termination period longer than 2 minutes, the old node will be interrupted prior to those pods being rescheduled. To test a replacement node, AWS Fault Injection Service (FIS) can be used to simulate Spot interruptions.
- Carefully configure resource requests and limits for workloads: Rightsizing and optimizing your cluster is a shared responsibility. Karpenter effectively optimizes and scales infrastructure, but the end result depends on how well you have rightsized your pod requests and any other Kubernetes scheduling constraints. Karpenter does not consider limits or resource utilization. For most workloads with non-compressible resources, such as memory, it is generally recommended to set requests==limits because if a workload tries to burst beyond the available memory of the host, an out-of-memory (OOM) error occurs. Karpenter consolidation can increase the probability of this as it proactively tries to reduce total allocatable resources for a Kubernetes cluster. For help with rightsizing your Kubernetes pods, consider exploring Kubecost, Vertical Pod Autoscaler configured in recommendation mode, or an open source tool such as Goldilocks.
- Configure metrics for Karpenter: Karpenter emits metrics in the Prometheus format, so consider using Amazon Managed Service for Prometheus to track interruptions caused by Karpenter Drift, consolidation, Spot interruptions, or other Amazon EC2 maintenance events. These metrics can be used to confirm that interruptions are not having a significant impact on your service’s availability and monitor NodePool usage and pod lifecycles. The Karpenter Getting Started Guide contains an example Grafana dashboard configuration.
You can learn more about other application best practices in the Reliability section of the Amazon EKS Best Practices Guide.
Cleanup To avoid incurring future charges, delete any resources you created as part of this walkthrough. If you followed the Karpenter Getting Started Guide to set up a cluster and add Karpenter, follow the clean-up instructions in the Karpenter documentation to delete the cluster. Alternatively, if you already had a cluster with Karpenter, delete the resources created as part of this walkthrough:
kubectl delete -f inflate.yamlkubectl delete -f nodepool.yaml
Conclusion In this post, you learned how Karpenter can actively replace a Spot node with another more cost-efficient Spot node. Karpenter can consolidate Spot nodes that have the right balance between lower price and low-frequency interruptions when there are at least 15 selectable instances to balance price and availability.
To get started, check out the Karpenter documentation as well as Karpenter Blueprints, which is a repository including common workload scenarios following the best practices.
You can share your feedback on this feature by a raising a GitHub Issue.
This post is written by André Stoll, Solution Architect.
Chaos engineering is a popular practice for building confidence in system resilience. However, many existing tools assume the ability to alter infrastructure configurations, and cannot be easily applied to the serverless application paradigm. Due to the stateless, ephemeral, and distributed nature of serverless architectures, you must evolve the traditional technique when running chaos experiments on these systems.
This blog post explains a technique for running chaos engineering experiments on AWS Lambda functions. The approach uses Lambda extensions to induce failures in a runtime-agnostic way requiring no function code changes. It shows how you can use the AWS Fault Injection Service (FIS) to automate and manage chaos experiments across different Lambda functions to provide a reusable testing method.
Overview Chaos experiments are commonly applied to cloud applications to uncover latent issues and prevent service disruptions. IT teams use chaos experiments to build confidence in the robustness of their systems. However, the traditional methods used in server-based chaos engineering do not easily translate to the serverless world since many existing tools are based on altering the underlying infrastructure configurations, such as cluster nodes or server instances of your applications.
In serverless applications, AWS handles the undifferentiated heavy lifting of managing infrastructure, so you can focus on delivering business value. But this also means that engineering teams have limited control over the infrastructure, and must rely on application-level tooling to run chaos experiments. Two techniques commonly used in the serverless community for conducting chaos experiments on Lambda functions are modifying the function configuration or using runtime-specific libraries.
Changing the configuration of a Lambda function allows you to induce rudimentary failures. For example, you can set the reserved concurrency of a Lambda function to simulate invocation throttling. Alternatively, you might change the function execution role permissions or the function policy to simulate IAM access denial. These types of failures are easy to implement, but the range of possible fault injection types is limited.
The other technique—injecting chaos into Lambda functions through purpose-built, runtime-specific libraries—is more flexible. There are various open-source libraries that allow you to inject failures, such as added latency, exceptions, or disk exhaustion. Examples of such libraries are Python’s chaos_lambda and failure-lambda for Node.js. The downside is that you must change the function code for every function you want to run chaos experiments on. In addition, those libraries are runtime-specific and each library comes with a set of different capabilities and configurations. This reduces the reusability of your chaos experiments across Lambda functions implemented in different languages.
Injecting chaos using Lambda extensions Implementing chaos experiments using Lambda extensions allows you to address all of the previous concerns. Lambda extensions augment your functions by adding functionality, such as capturing diagnostic information or automatically instrumenting your code. You can integrate your preferred monitoring, observability, or security tooling deeply into the Lambda environment without complex installation or configuration management. Lambda extensions are generally packaged as Lambda layers and run as a separate process in the Lambda execution environment. You may use extensions from AWS, AWS Lambda partners, or build your own custom functionality.
With Lambda extensions, you can implement a chaos extension to inject the desired failures into your Lambda environments. This chaos extension uses the Runtime API proxy pattern that enables you to hook into the function invocation request and response lifecycle. Lambda runtimes use the Lambda Runtime API to retrieve the next incoming event to be processed by the function handler and return the handler response to the Lambda service.
The Runtime API HTTP endpoint is available within the Lambda execution environment. Runtimes get the API endpoint from the environment variable AWS_LAMBDA_RUNTIME_API. During the initialization of the execution environment, you can modify the runtime startup behavior. This lets you change the value of AWS_LAMBDA_RUNTIME_API to the port the chaos extension process is listening on. Now, all requests to the Runtime API go through the chaos extension proxy. You can use this workflow for blocking malicious events, auditing payloads, or injecting failures.
- The chaos extension intercepts incoming events and outbound responses, and injects failures according to the chaos experiment configuration.
- The extension accesses environment variables to read the chaos experiment configuration.
- A wrapper script configures the runtime to proxy requests through the chaos extension.
When intercepting incoming events and outbound responses to the Lambda Runtime API, you can simulate failures such as introducing artificial delay or generate an error response to return to the Lambda service. This workflow adds latency to your function calls:
All Lambda runtimes support extensions. Since extensions run as a separate process, you can implement them in a language other than the function code. AWS recommends you implement extensions using a programming language that compiles to a binary executable, such as Golang or Rust. This allows you to use the extension with any Lambda runtime.
Some of the open source projects following this technique are the chaos-lambda-extension, implemented in Rust, or the serverless-chaos-extension, implemented in Python.
Extensions provide you with a flexible and reusable method to run your chaos experiments on Lambda functions. You can reuse the chaos extension for all runtimes without having to change function code. Add the extension to any Lambda function where you want to run chaos experiments.
Automating with AWS FIS experiment templates According to the Principles of Chaos Engineering, you should “automate your experiments to run continuously”. To achieve this, you can use the AWS Fault Injection Service (FIS).
This service allows you to generate reusable experiment templates. The template specifies the targets and the actions to run on them during the experiment, and an optional stop condition that prevents the experiment from going out of bounds. You can also execute AWS Systems Manager Automation runbooks which support custom fault types. You can write your own custom Systems Manager documents to define the individual steps involved in the automation. To carry out the actions of the experiment, you define scripts in the document to manage your Lambda function and set it up for the chaos experiment.
To use the chaos extension for your serverless chaos experiments:
- Set up the Lambda function for the experiment. Add the chaos extension as a layer and configure the experiment, for example, by adding environment variables specifying the fault type and its corresponding value.
- Pause the automation and conduct the experiment. To do this, use the
aws:sleepautomation action. During this period, you conduct the experiment, measure and observe the outcome. - Clean up the experiment. The script removes the layer again and also resets the environment variables.
Running your first serverless chaos experiment This sample repository provides you with the necessary code to run your first serverless chaos experiment in AWS. The experiment uses the chaos-lambda-extension extension to inject chaos.
The sample deploys the AWS FIS experiment template, the necessary SSM Automation runbooks including the IAM role used by the runbook to configure the Lambda functions. The sample also provisions a Lambda function for testing and an Amazon CloudWatch alarm used to roll back the experiment.
Prerequisites * You have the chaos extension already deployed as a Lambda layer in your AWS account.
* You have installed the AWS Cloud Development Kit (CDK) CLI. See the Getting started with the AWS CDK guide for details.
* Clone the sample repository locally by running
git clone git@github.com:aws-samples/serverless-chaos-experiments.git
* Ensure you have sufficient permissions to interact with the AWS FIS, Lambda, and CloudWatch alarms.
Running the experiment Follow the steps outlined in the repository to conduct your first experiment. Starting the experiment triggers the automation execution.
This automation includes adding the extension and configuring the experiment, pausing the execution and observing the system and reverting all changes to the initial state.
If you invoke the targeted Lambda function during the second step, failures (in this case, artificial latency) are simulated.
Security best practices Extensions run within the same execution environment as the function, so they have the same level of access to resources such as file system, networking, and environment variables. IAM permissions assigned to the function are shared with extensions. AWS recommends you assign the least required privileges to your functions.
Always install extensions from a trusted source only. Use Infrastructure as Code (IaC) and automation tools, such as CloudFormation or AWS Systems Manager, to simplify attaching the same extension configuration, including AWS Identity and Access Management (IAM) permissions, to multiple functions. IaC and automation tools allow you to have an audit record of extensions and versions used previously.
When building extensions, do not log sensitive data. Sanitize payloads and metadata before logging or persisting them for audit purposes.
Conclusion This blog post details how to run chaos experiments for serverless applications built using Lambda. The described approach uses Lambda extension to inject faults into the execution environment. This allows you to use the same method regardless of runtime or configuration of the Lambda function.
To automate and successfully conduct the experiment, you can use the AWS Fault Injection Service. By creating an experiment template, you can specify the actions to run on the defined targets, such as adding the extension during the experiment. Since the extension can be used for any runtime, you can reuse the experiment template to inject failures into different Lambda functions.
Visit this repository to deploy your first serverless chaos experiment, or watch this video guide for learning more about building extensions. Explore the AWS FIS documentation to learn how to create your own experiments.
For more serverless learning resources, visit Serverless Land.
Amazon EventBridge helps developers build event-driven architectures (EDA) by connecting loosely coupled publishers and consumers using event routing, filtering, and transformation. CloudEvents is an open-source specification for describing event data in a common way. Developers can publish CloudEvents directly to EventBridge, filter and route them, and use input transformers and API Destinations to send CloudEvents to downstream AWS services and third-party APIs.
Overview Event design is an important aspect in any event-driven architecture. Developers building event-driven architectures often overlook the event design process when building their architectures. This leads to unwanted side effects like exposing implementation details, lack of standards, and version incompatibility.
Without event standards, it can be difficult to integrate events or streams of messages between systems, brokers, and organizations. Each system has to understand the event structure or rely on custom-built solutions for versioning or validation.
CloudEvents is a specification for describing event data in common formats to provide interoperability between services, platforms, and systems using Cloud Native Computing Foundation (CNCF) projects. As CloudEvents is a CNCF graduated project, many third-party brokers and systems adopt this specification.
Using CloudEvents as a standard format to describe events makes integration easier and you can use open-source tooling to help build event-driven architectures and future proof any integrations. EventBridge can route and filter CloudEvents based on common metadata, without needing to understand the business logic within the event itself.
CloudEvents support two implementation modes, structured mode and binary mode, and a range of protocols including HTTP, MQTT, AMQP, and Kafka. When publishing events to an EventBridge bus, you can structure events as CloudEvents and route them to downstream consumers. You can use input transformers to transform any event into the CloudEvents specification. Events can also be forwarded to public APIs, using EventBridge API destinations, which supports both structured and binary mode encodings, enhancing interoperability with external systems.
Standardizing events using Amazon EventBridge When publishing events to an EventBridge bus, EventBridge uses its own event envelope and represents events as JSON objects. EventBridge requires that you define top-level fields, such as detail-type and source. You can use any event/payload in the detail field.
This example event shows an OrderPlaced event from the orders-service that is unstructured without any event standards. The data within the event contains the order_id, customer_id and order_total.
{ "version": "0", "id": "dbc1c73a-c51d-0c0e-ca61-ab9278974c57", "account": "1234567890", "time": "2023-05-23T11:38:46Z", "region": "us-east-1", "detail-type": "OrderPlaced", "source": "myapp.orders-service", "resources": [], "detail": { "data": { "order_id": "c172a984-3ae5-43dc-8c3f-be080141845a", "customer_id": "dda98122-b511-4aaf-9465-77ca4a115ee6", "order_total": "120.00" } }}
Publishers may also choose to add an additional metadata field along with the data field within the detail field to help define a set of standards for their events.
{ "version": "0", "id": "dbc1c73a-c51d-0c0e-ca61-ab9278974c58", "account": "1234567890", "time": "2023-05-23T12:38:46Z", "region": "us-east-1", "detail-type": "OrderPlaced", "source": "myapp.orders-service", "resources": [], "detail": { "metadata": { "idempotency_key": "29d2b068-f9c7-42a0-91e3-5ba515de5dbe", "correlation_id": "dddd9340-135a-c8c6-95c2-41fb8f492222", "domain": "ORDERS", "time": "1707908605" }, "data": { "order_id": "c172a984-3ae5-43dc-8c3f-be080141845a", "customer_id": "dda98122-b511-4aaf-9465-77ca4a115ee6", "order_total": "120.00" } }}
This additional event information helps downstream consumers, improves debugging, and can manage idempotency. While this approach offers practical benefits, it duplicates solutions that are already solved with the CloudEvents specification.
Publishing CloudEvents using Amazon EventBridge When publishing events to EventBridge, you can use CloudEvents structured mode. A structured-mode message is where the entire event (attributes and data) is encoded in the message body, according to a specific event format. A binary-mode message is where the event data is stored in the message body, and event attributes are stored as part of the message metadata.
CloudEvents has a list of required fields but also offers flexibility with optional attributes and extensions. CloudEvents also offers a solution to implement idempotency, requiring that the combination of id and source must uniquely identify an event, which can be used as the idempotency key in downstream implementations.
{ "version": "0", "id": "dbc1c73a-c51d-0c0e-ca61-ab9278974c58", "account": "1234567890", "time": "2023-05-23T12:38:46Z", "region": "us-east-1", "detail-type": "OrderPlaced", "source": "myapp.orders-service", "resources": [], "detail": { "specversion": "1.0", "id": "bba4379f-b764-4d90-9fb2-9f572b2b0b61", "source": "myapp.orders-service", "type": "OrderPlaced", "data": { "order_id": "c172a984-3ae5-43dc-8c3f-be080141845a", "customer_id": "dda98122-b511-4aaf-9465-77ca4a115ee6", "order_total": "120.00" }, "time": "2024-01-01T17:31:00Z", "dataschema": "https://us-west-2.console.aws.amazon.com/events/home?region=us-west-2#/registries/discovered-schemas/schemas/myapp.orders-service%40OrderPlaced", "correlationid": "dddd9340-135a-c8c6-95c2-41fb8f492222", "domain": "ORDERS" }}
By incorporating the required fields, the OrderPlaced event is now CloudEvents compliant. The event also contains optional and extension fields for additional information. Optional fields such as dataschema can be useful for brokers and consumers to retrieve a URI path to the published event schema. This example event references the schema in the EventBridge schema registry, so downstream consumers can fetch the schema to validate the payload.
Mapping existing events into CloudEvents using input transformers When you define a target in EventBridge, input transformations allow you to modify the event before it reaches its destination. Input transformers are configured per target, allowing you to convert events when your downstream consumer requires the CloudEvents format and you want to avoid duplicating information.
Input transformers allow you to map EventBridge fields, such as id, region, detail-type, and source, into corresponding CloudEvents attributes.
This example shows how to transform any EventBridge event into CloudEvents format using input transformers, so the target receives the required structure.
{ "version": "0", "id": "dbc1c73a-c51d-0c0e-ca61-ab9278974c58", "account": "1234567890", "time": "2024-01-23T12:38:46Z", "region": "us-east-1", "detail-type": "OrderPlaced", "source": "myapp.orders-service", "resources": [], "detail": { "order_id": "c172a984-3ae5-43dc-8c3f-be080141845a", "customer_id": "dda98122-b511-4aaf-9465-77ca4a115ee6", "order_total": "120.00" }}
Using this input transformer and input template EventBridge transforms the event schema into the CloudEvents specification for downstream consumers.
Input transformer for CloudEvents:
{ "id": "$.id", "source": "$.source", "type": "$.detail-type", "time": "$.time", "data": "$.detail"}
Input template for CloudEvents:
{ "specversion": "1.0", "id": "<id>", "source": "<source>", "type": "<type>", "time": "<time>", "data": <data>}
This example shows the event payload that is received by downstream targets, which is mapped to the CloudEvents specification.
{ "specversion": "1.0", "id": "dbc1c73a-c51d-0c0e-ca61-ab9278974c58", "source": "myapp.orders-service", "type": "OrderPlaced", "time": "2024-01-23T12:38:46Z", "data": { "order_id": "c172a984-3ae5-43dc-8c3f-be080141845a", "customer_id": "dda98122-b511-4aaf-9465-77ca4a115ee6", "order_total": "120.00" }}
For more information on using input transformers with CloudEvents, see this pattern on Serverless Land.
Transforming events into CloudEvents using API destinations EventBridge API destinations allows you to trigger HTTP endpoints based on matched rules to integrate with third-party systems using public APIs. You can route events to APIs that support the CloudEvents format by using input transformations and custom HTTP headers to convert EventBridge events to CloudEvents. API destinations now supports custom content-type headers. This allows you to send structured or binary CloudEvents to downstream consumers.
Sending binary CloudEvents using API destinations When sending binary CloudEvents over HTTP, you must use the HTTP binding specification and set the necessary CloudEvents headers. These headers tell the downstream consumer that the incoming payload uses the CloudEvents format. The body of the request is the event itself.
CloudEvents headers are prefixed with ce-. You can find the list of headers in the HTTP protocol binding documentation.
This example shows the Headers for a binary event:
POST /order HTTP/1.1 Host: webhook.example.comce-specversion: 1.0ce-type: OrderPlacedce-source: myapp.orders-servicece-id: bba4379f-b764-4d90-9fb2-9f572b2b0b61ce-time: 2024-01-01T17:31:00Zce-dataschema: https://us-west-2.console.aws.amazon.com/events/home?region=us-west-2#/registries/discovered-schemas/schemas/myapp.orders-service%40OrderPlacedcorrelationid: dddd9340-135a-c8c6-95c2-41fb8f492222domain: ORDERSContent-Type: application/json; charset=utf-8
This example shows the body for a binary event:
{ "order_id": "c172a984-3ae5-43dc-8c3f-be080141845a", "customer_id": "dda98122-b511-4aaf-9465-77ca4a115ee6", "order_total": "120.00"}
For more information when using binary CloudEvents with API destinations, explore this pattern available on Serverless Land.
Sending structured CloudEvents using API destinations To support structured mode with CloudEvents, you must specify the content-type as application/cloudevents+json; charset=UTF-8, which tells the API consumer that the payload of the event is adhering to the CloudEvents specification.
POST /order HTTP/1.1Host: webhook.example.com Content-Type: application/cloudevents+json; charset=utf-8{ "specversion": "1.0", "id": "bba4379f-b764-4d90-9fb2-9f572b2b0b61", "source": "myapp.orders-service", "type": "OrderPlaced", "data": { "order_id": "c172a984-3ae5-43dc-8c3f-be080141845a", "customer_id": "dda98122-b511-4aaf-9465-77ca4a115ee6", "order_total": "120.00" }, "time": "2024-01-01T17:31:00Z", "dataschema": "https://us-west-2.console.aws.amazon.com/events/home?region=us-west-2#/registries/discovered-schemas/schemas/myapp.orders-service%40OrderPlaced", "correlationid": "dddd9340-135a-c8c6-95c2-41fb8f492222", "domain":"ORDERS"}
Conclusion Carefully designing events plays an important role when building event-driven architectures to integrate producers and consumers effectively. The open-source CloudEvents specification helps developers to standardize integration processes, simplifying interactions between internal systems and external partners.
EventBridge allows you to use a flexible payload structure within an event’s detail property to standardize events. You can publish structured CloudEvents directly onto an event bus in the detail field and use payload transformations to allow downstream consumers to receive events in the CloudEvents format.
EventBridge simplifies integration with third-party systems using API destinations. Using the new custom content-type headers with input transformers to modify the event structure, you can send structured or binary CloudEvents to integrate with public APIs.
For more serverless learning resources, visit Serverless Land.
This post is written by Jeff Harman, Senior Prototyping Architect, Vaibhav Shah, Senior Solutions Architect and Erik Olsen, Senior Technical Account Manager.
Many industries are required to provide audit trails for decision and transactional systems. AI assisted decision making requires monitoring the full inputs to the decision system in near real time to prevent fraud, detect model drift, and discrimination. Modern systems often use a much wider array of inputs for decision making, including images, unstructured text, historical values, and other large data elements. These large data elements pose a challenge to traditional audit systems that deal with relatively small text messages in structured formats. This blog shows the use of serverless technology to create a reliable, performant, traceable, and durable pipeline for audit processing.
Overview Consider the following four requirements to develop an architecture for audit record ingestion:
- Audit record size: Store and manage large payloads (256k – 6 MB in size) that may be heterogeneous, including text, binary data, and references to other storage systems.
- Audit traceability: The data stored has full traceability of the payload and external processes to monitor the process via subscription-based events.
- High Performance: The time required for blocking writes to the system is limited to the time it takes to transmit the audit record over the network.
- High data durability: Once the system sends a payload receipt, the payload is at very low risk of loss because of system failures.
The following diagram shows an architecture that meets these requirements and models the flow of the audit record through the system.
The primary source of latency is the time it takes for an audit record to be transmitted across the network. Applications sending audit records make an API call to an Amazon API Gateway endpoint. An AWS Lambda function receives the message and an Amazon ElastiCache for Redis cluster provides a low latency initial storage mechanism for the audit record. Once the data is stored in ElastiCache, the AWS Step Functions workflow then orchestrates the communication and persistence functions.
Subscribers receive four Amazon Simple Notification Service (Amazon SNS) notifications pertaining to arrival and storage of the audit record payload, storage of the audit record metadata, and audit record archive completion. Users can subscribe an Amazon Simple Queue Service (SQS) queue to the SNS topic and use fan out mechanisms to achieve high reliability.
- The Ingest Message Lambda function sends an initial receipt notification
- The Message Archive Handler Lambda function notifies on storage of the audit record from ElastiCache to Amazon Simple Storage Service (Amazon S3)
- The Message Metadata Handler Lambda function notifies on storage of the message metadata into Amazon DynamoDB
- The Final State Aggregation Lambda function notifies that the audit record has been archived.
Any failure by the three fundamental processing steps: Ingestion, Data Archive, and Metadata Archive triggers a message in an SQS Dead Letter Queue (DLQ) which contains the original request and an explanation of the failure reason. Any failure in the Ingest Message function invokes the Ingest Message Failure function, which stores the original parameters to the S3 Failed Message Storage bucket for later analysis.
The Step Functions workflow provides orchestration and parallel path execution for the system. The detailed workflow below shows the execution flow and notification actions. The transformer steps convert the internal data structures into the format required for consumers.
Data structures There are types three events and messages managed by this system:
- Incoming message: This is the message the producer sends to an API Gateway endpoint.
- Internal message: This event contains the message metadata allowing subsequent systems to understand the originating message producer context.
- Notification message: Messages that allow downstream subscribers to act based on the message.
Solution walkthrough The message producer calls the API Gateway endpoint, which enforces the security requirements defined by the business. In this implementation, API Gateway uses an API key for providing more robust security. API Gateway also creates a security header for consumption by the Ingest Message Lambda function. API Gateway can be configured to enforce message format standards, see Use request validation in API Gateway for more information.
The Ingest Message Lambda function generates a message ID that tracks the message payload throughout its lifecycle. Then it stores the full message in the ElastiCache for Redis cache. The Ingest Message Lambda function generates an internal message with all the elements necessary as described above. Finally, the Lambda function handler code starts the Step Functions workflow with the internal message payload.
If the Ingest Message Lambda function fails for any reason, the Lambda function invokes the Ingestion Failure Handler Lambda function. This Lambda function writes any recoverable incoming message data to an S3 bucket and sends a notification on the Ingest Message dead letter queue.
The Step Functions workflow then runs three processes in parallel.
- The Step Functions workflow triggers the Message Archive Data Handler Lambda function to persist message data from the ElastiCache cache to an S3 bucket. Once stored, the Lambda function returns the S3 bucket reference and state information. There are two options to remove the internal message from the cache. Remove the message from cache immediately before sending the internal message and updating the ElastiCache cache flag or wait for the ElastiCache lifecycle to remove a stale message from cache. This solution waits for the ElastiCache lifecycle to remove the message.
- The workflow triggers the Message Metadata Handler Lambda function to write all message metadata and security information to DynamoDB. The Lambda function replies with the DynamoDB reference information.
- Finally, the Step Functions workflow sends a message to the SNS topic to inform subscribers that the message has arrived and the data persistence processes have started.
After each of the Lambda functions’ processes complete, the Lambda function sends a notification to the SNS notification topic to alert subscribers that each action is complete. When both Message Metadata and Message Archive Lambda functions are done, the Final Aggregation function makes a final update to the metadata in DynamoDB to include S3 reference information and to remove the ElastiCache Redis reference.
Deploying the solution Prerequisites: 1. AWS Serverless Application Model (AWS SAM) is installed (see Getting started with AWS SAM) 2. AWS User/Credentials with appropriate permissions to run AWS CloudFormation templates in the target AWS account 3. Python 3.8 – 3.10 4. The AWS SDK for Python (Boto3) is installed 5. The requests python library is installed
The source code for this implementation can be found at https://github.com/aws-samples/blog-serverless-reliable-messaging
Installing the Solution: 1. Clone the git repository to a local directory
2. git clone https://github.com/aws-samples/blog-serverless-reliable-messaging.git
3. Change into the directory that was created by the clone operation, usually blog_serverless_reliable_messaging
4. Execute the command: sam build
5. Execute the command: sam deploy –-guided. You are asked to supply the following parameters:
1. Stack Name: Name given to this deployment (example: serverless-messaging)
2. AWS Region: Where to deploy (example: us-east-1)
3. ElasticacheInstanceClass: EC2 cache instance type to use with (example: cache.t3.small)
4. ElasticReplicaCount: How many replicas should be used with ElastiCache (recommended minimum: 2)
5. ProjectName: Used for naming resources in account (example: serverless-messaging)
6. MultiAZ: True/False if multiple Availability Zones should be used (recommend: True)
7. The default parameters can be selected for the remainder of questions
Testing: Once you have deployed the stack, you can test it through the API gateway endpoint with the API key that is referenced in the deployment output. There are two methods for retrieving the API key either via the AWS console (from the link provided in the output – ApiKeyConsole) or via the AWS CLI (from the AWS CLI reference in the output – APIKeyCLI).
You can test directly in the Lambda service console by invoking the ingest message function.
A test message is available at the root of the project test_message.json for direct Lambda function testing of the Ingest function.
- In the console navigate to the Lambda service
- From the list of available functions, select the “
-IngestMessageFunction-xxxxx” function - Under the “Function overview” select the “Test” tab
- Enter an event name of your choosing
- Copy and paste the contents of test_message.json into the “Event JSON” box
- Click “Save” then after it has saved, click the “Test”
- If successful, you should see something similar to the below in the details:
{"isBase64Encoded": false,"statusCode": 200,"headers": {"Access-Control-Allow-Headers": "Content-Type","Access-Control-Allow-Origin": "*","Access-Control-Allow-Methods": "OPTIONS,POST"},"body": "{\"messageID\": \"XXXXXXXXXXXXXX\"}"} - In the S3 bucket “
<project name>-s3messagearchive-xxxxxx“, find the payload of the original json with a key based on the date and time of the script execution, e.g.:YEAR/MONTH/DAY/HOUR/MINUTEwith a file name of themessageID - In a DynamoDB table named
metaDataTable, you should find a record with amessageIDequal to themessageIDfrom above that contains all of the metadata related to the payload
A python script is included with the code in the test_client folder
- Replace the
and the values with the correct ones for your environment in the test_client.py file - Execute the test script with Python 3.8 or higher with the requests package installed
Example execution (from main directory of git clone):
python3 -m pip install -r ./test_client/requirements.txt
python3 ./test_client/test_client.py - Successful output shows the messageID and the header JSON payload:
{"messageID": " XXXXXXXXXXXXXX"} - In the S3 bucket “
<project name>-s3messagearchive-xxxxxx“, you should be able to find the payload of the original json with a key based on the date and time of the script execution, e.g.: YEAR/MONTH/DAY/HOUR/MINUTE with a file name of themessageID - In a DynamoDB table named
metaDataTable, you should find a record with amessageIDequal to themessageIDfrom above that contains all of the meta data related to the payload
Conclusion This blog describes architectural patterns, messaging patterns, and data structures that support a highly reliable messaging system for large messages. The use of serverless services including Lambda functions, Step Functions, ElastiCache, DynamoDB, and S3 meet the requirements of modern audit systems to be scalable and reliable. The architecture shared in this blog post is suitable for a highly regulated environment to store and track messages that are larger than typical logging systems, records sized between 256k and 6MB. The architecture serves as a blueprint that can be extended and adapted to fit further serverless use cases.
For serverless learning resources, visit Serverless Land.
This post is written by Luca Mezzalira, Principal SA, and Matt Diamond, Principal, SA.
Designing a workload with AWS Lambda creates questions for developers due to the modularity that can be expressed either at the code or infrastructure level. Using serverless for running code requires additional planning to extract the business logic from the underlying functional components. This deliberate separation of concerns ensures a robust modularity, paving the way for evolutionary architectures.
This post focuses on synchronous workloads, but similar considerations are applicable in other workload types. After identifying the bounded context of your API and agreeing on API contracts with consumers, it’s time to structure the architecture of your bounded context and the associated infrastructure.
The two most common ways to structure an API using Lambda functions are single responsibility and Lambda-lith. However, this blog post explores an alternative to these approaches, which can provide the best of both.
Single responsibility Lambda functions Single responsibility Lambda functions are designed to run a specific task or handle a particular event-triggered operation within a serverless architecture:
This approach provides a strong separation of concerns between business logic and capabilities. You can test in isolation specific capabilities, deploy a Lambda function independently, reduce the surface to introduce bugs, and enable easier debugging for issues in Amazon CloudWatch.
Additionally, single purpose functions enable efficient resource allocation as Lambda automatically scales based on demand, optimizing resource consumption, and minimizing costs. This means you can modify the memory size, architecture, and any other configuration available per function. Moreover, requesting an update of concurrent function execution via a support ticket becomes easier because you are not aggregating the traffic to a single Lambda function that handles every request but you can request specific increase based on the traffic of a single task.
Another advantage is rapid execution time. Considering the business logic for a single-purpose Lambda function designed for a single task, you can optimize the size of a function more easily, without the need of additional libraries required in other approaches. This helps reduce the cold start time due to a smaller bundle size.
Despite these benefits, some issues exist when solely relying on single-purpose Lambda functions. While the cold start time is mitigated, you might experience a higher number of cold starts, particularly for functions with sporadic or infrequent invocations. For example, a function that deletes users in an Amazon DynamoDB table likely won’t be triggered as often as one that reads user data. Also, relying heavily on single-purpose Lambda functions can lead to increased system complexity, especially as the number of functions grows.
A good separation of concerns helps maintain your code base, at the cost of a lack of cohesion. In functions with similar tasks, such as write operations of an API (POST, PUT, DELETE), you might duplicate code and behaviors across multiple functions. Moreover, updating common libraries shared via Lambda Layers, or other dependency management systems, requires multiple changes across every function instead of an atomic change on a single file. This is also true for any other change across multiple functions, for instance, updating the runtime version.
Lambda-lith: Using one single Lambda function When many workloads use single purpose Lambda functions, developers end up with a proliferation of Lambda functions across an AWS account. One of the main challenges developers face is updating common dependencies or function configurations. Unless there is a clear governance strategy implemented for addressing this problem (such as using Dependabot for enforcing the update of dependencies, or parameterized parameters that are retrieved at provisioning time), developers may opt for a different strategy.
As a result, many development teams move in the opposite direction, aggregating all code related to an API inside the same Lambda function.
This approach is often referred to as a Lambda-lith, because it gathers all the HTTP verbs that compose an API and sometimes multiple APIs in the same function.
This allows you to have a higher code cohesion and colocation across the different parts of the application. Modularity in this case is expressed at the code level, where patterns like single responsibility, dependency injection, and façade are applied to structure your code. The discipline and code best practices applied by the development teams is crucial for maintaining large code bases.
However, considering the reduced number of Lambda functions, updating a configuration or implementing a new standard across multiple APIs can be achieved more easily compared with the single responsibility approach.
Moreover, since every request invokes the same Lambda function for every HTTP verb, it’s more likely that little-used parts of your code have a better response time because an execution environment is more likely to be available to fulfill the request.
Another factor to consider is the function size. This increases when collocating verbs in the same function with all the dependencies and business logic of an API. This may affect the cold start of your Lambda functions with spiky workloads. Customers should evaluate the benefits of this approach, especially when applications have restrictive SLAs, which would be impacted by cold starts. Developers can mitigate this problem by paying attention to the dependencies used and implementing techniques like tree-shaking, minification, and dead code elimination, where the programming language allows.
This coarse grain approach won’t allow you to tune your function configurations individually. But you must find a configuration that matches all the code capabilities with a possibly higher memory size and looser security permissions that might clash with the requirements defined by the security team.
Read and write functions These two approaches both have trade-offs, but there is a third option that can combine their benefits.
Often, API traffic leans towards more reads or writes and that forces developers to optimize code and configurations more on one side over the other.
For example, consider building a user API that allows consumers to create, update, and delete a user but also to find a user or a list of users. In this scenario, you can change one user at a time with no bulk operations available, but you can get one or more users per API request. Dividing the design of the API into read and write operations results in this architecture:
The cohesion of code for write operations (create, update, and delete) is beneficial for many reasons. For instance, you may need to validate the request body, ensuring it contains all the mandatory parameters. If the workload is heavy on writes, the less-used operations (for instance, Delete) benefit from warm execution environments. The code colocation enables reusability of code on similar actions, reducing the cognitive load to structure your projects with shared libraries or Lambda layers, for instance.
When looking at the read operations side, you can reduce the code bundled with this function, having a faster cold start, and heavily optimize the performance compared to a write operation. You can also store partial or full query results in-memory of an execution environment to improve the execution time of a Lambda function.
This approach helps you further with its evolutionary nature. Imagine if this platform becomes much more popular. Now, you must optimize the API even further by improving reads and adding a cache aside pattern with ElastiCache and Redis. Moreover, you have decided to optimize the read queries with a second database that is optimized for the read capability when the cache is missed.
On the write side, you have agreed with the API consumers that receiving and acknowledging user creation or deletion is adequate, considering they fully embraced the eventual consistency nature of distributed systems.
Now, you can improve the response time of write operations by adding an SQS queue before the Lambda function. You can update the write database in batches to reduce the number of invocations needed for handling write operations, instead of dealing with every request individually.
Command query responsibility segregation (CQRS) is a well-established pattern that separates the data mutation, or the command part of a system, from the query part. You can use the CQRS pattern to separate updates and queries if they have different requirements for throughput, latency, or consistency.
While it’s not mandatory to start with a full CQRS pattern, you can evolve from the infrastructure highlighted more easily in the initial read and write implementation, without massive refactoring of your API.
Comparison of the three approaches Here is a comparison of the three approaches:
| Single responsibility | Lambda-lith | Read and write | | Benefits | * Strong separation of concerns * Granular configuration * Better debug * Rapid execution time | * Fewer cold start invocations * Higher code cohesion * Simpler maintenance | * Code cohesion where needed * Evolutionary architecture * Optimization of read and write operations | | Issues | * Code duplication * Complex maintenance * Higher cold start invocations | * Corse grain configuration * Higher cold start time | * Using CQRS with two data models * CQRS adds eventual consistency to your system |
Conclusion Developers often move from single responsibility functions to the Lambda-lith as their architectures evolve, but both approaches have relative trade-offs. This post shows how it’s possible to have the best of both approaches by dividing your workloads per read and write operations.
All three approaches are viable for designing serverless APIs, and understanding what you are optimizing for is the key for making the best decision. Remember, understanding your context and business requirements to express in your applications leads you towards the acceptable trade-offs to specify inside a specific workload. Keep an open mind and find the solution that solves the problem and balances security, developer experience, cost, and maintainability.
For more serverless learning resources, visit Serverless Land.
This post is written by Beau Gosse, Senior Software Engineer and Paras Jain, Senior Technical Account Manager.
AWS Lambda now supports .NET 8 as both a managed runtime and container base image. With this release, Lambda developers can benefit from .NET 8 features including API enhancements, improved Native Ahead of Time (Native AOT) support, and improved performance. .NET 8 supports C# 12, F# 8, and PowerShell 7.4. You can develop Lambda functions in .NET 8 using the AWS Toolkit for Visual Studio, the AWS Extensions for .NET CLI, AWS Serverless Application Model (AWS SAM), AWS CDK, and other infrastructure as code tools.
Creating .NET 8 function in the console
What’s new Upgraded operating system The .NET 8 runtime is built on the Amazon Linux 2023 (AL2023) minimal container image. This provides a smaller deployment footprint than earlier Amazon Linux 2 (AL2) based runtimes and updated versions of common libraries such as glibc 2.34 and OpenSSL 3.
The new image also uses microdnf as a package manager, symlinked as dnf. This replaces the yum package manager used in earlier AL2-based images. If you deploy your Lambda functions as container images, you must update your Dockerfiles to use dnf instead of yum when upgrading to the .NET 8 base image. For more information, see Introducing the Amazon Linux 2023 runtime for AWS Lambda.
Performance There are a number of language performance improvements available as part of .NET 8. Initialization time can impact performance, as Lambda creates new execution environments to scale your function automatically. There are a number of ways to optimize performance for Lambda-based .NET workloads, including using source generators in System.Text.Json or using Native AOT.
Lambda has increased the default memory size from 256 MB to 512 MB in the blueprints and templates for improved performance with .NET 8. Perform your own functional and performance tests on your .NET 8 applications. You can use AWS Compute Optimizer or AWS Lambda Power Tuning for performance profiling.
At launch, new Lambda runtimes receive less usage than existing established runtimes. This can result in longer cold start times due to reduced cache residency within internal Lambda subsystems. Cold start times typically improve in the weeks following launch as usage increases. As a result, AWS recommends not drawing performance comparison conclusions with other Lambda runtimes until the performance has stabilized.
Native AOT Lambda introduced .NET Native AOT support in November 2022. Benchmarks show up to 86% improvement in cold start times by eliminating the JIT compilation. Deploying .NET 8 Native AOT functions using the managed dotnet8 runtime rather than the OS-only provided.al2023 runtime gives your function access to .NET system libraries. For example, libicu, which is used for globalization, is not included by default in the provided.al2023 runtime but is in the dotnet8 runtime.
While Native AOT is not suitable for all .NET functions, .NET 8 has improved trimming support. This allows you to more easily run ASP.NET APIs. Improved trimming support helps eliminate build time trimming warnings, which highlight possible runtime errors. This can give you confidence that your Native AOT function behaves like a JIT-compiled function. Trimming support has been added to the Lambda runtime libraries, AWS .NET SDK, .NET Lambda Annotations, and .NET 8 itself.
Using.NET 8 with Lambda To use .NET 8 with Lambda, you must update your tools.
- Install or update the .NET 8 SDK.
- If you are using AWS SAM, install or update to the latest version.
- If you are using Visual Studio, install or update the AWS Toolkit for Visual Studio.
- If you use the .NET Lambda Global Tools extension (
Amazon.Lambda.Tools), install the CLI extension and templates. You can upgrade existing tools withdotnet tool update -g Amazon.Lambda.Toolsand existing templates withdotnet new install Amazon.Lambda.Templates.
You can also use .NET 8 with Powertools for AWS Lambda (.NET), a developer toolkit to implement serverless best practices such as observability, batch processing, retrieving parameters, idempotency, and feature flags.
Building new .NET 8 functions Using AWS SAM 1. Run sam init.
2. Choose 1- AWS Quick Start Templates.
3. Choose one of the available templates such as Hello World Example.
4. Select N for Use the most popular runtime and package type?
5. Select dotnet8 as the runtime. The dotnet8 Hello World Example also includes a Native AOT template option.
6. Follow the rest of the prompts to create the .NET 8 function.
AWS SAM .NET 8 init options
You can amend the generated function code and use sam deploy --guided to deploy the function.
Using AWS Toolkit for Visual Studio 1. From the Create a new project wizard, filter the templates to either the Lambda or Serverless project type and select a template. Use Lambda for deploying a single function. Use Serverless for deploying a collection of functions using AWS CloudFormation. 2. Continue with the steps to finish creating your project. 3. You can amend the generated function code. 4. To deploy, right click on the project in the Solution Explorer and select Publish to AWS Lambda.
Using AWS extensions for the .NET CLI 1. Run dotnet new list --tag Lambda to get a list of available Lambda templates.
2. Choose a template and run dotnet new <template name>. To build a function using Native AOT, use dotnet new lambda.NativeAOT or dotnet new serverless.NativeAOT when using the .NET Lambda Annotations Framework.
3. Locate the generated Lambda function in the directory under *src* which contains the .csproj file. You can amend the generated function code.
4. To deploy, run dotnet lambda deploy-function and follow the prompts.
5. You can test the function in the cloud using dotnet lambda invoke-function or by using the test functionality in the Lambda console.
You can build and deploy .NET Lambda functions using container images. Follow the instructions in the documentation.
Migrating from .NET 6 to .NET 8 without Native AOT Using AWS SAM 1. Open the template.yaml file.
2. Update Runtime to dotnet8.
3. Open a terminal window and rebuild the code using sam build.
4. Run sam deploy to deploy the changes.
Using AWS Toolkit for Visual Studio 1. Open the .csproj project file and update the TargetFramework to net8.0. Update NuGet packages for your Lambda functions to the latest version to pull in .NET 8 updates.
2. Verify that the build command you are using is targeting the .NET 8 runtime.
3. There may be additional steps depending on what build/deploy tool you’re using. Updating the function runtime may be sufficient.
Using AWS extensions for the .NET CLI or AWS Toolkit for Visual Studio 1. Open the aws-lambda-tools-defaults.json file if it exists.
1. Set the framework field to net8.0. If unspecified, the value is inferred from the project file.
2. Set the function-runtime field to dotnet8.
2. Open the serverless.template file if it exists. For any AWS::Lambda::Function or AWS::Servereless::Function resources, set the Runtime property to dotnet8.
3. Open the .csproj project file if it exists and update the TargetFramework to net8.0. Update NuGet packages for your Lambda functions to the latest version to pull in .NET 8 updates.
Migrating from .NET 6 to .NET 8 Native AOT The following example migrates a .NET 6 class library function to a .NET 8 Native AOT executable function. This uses the optional Lambda Annotations framework which provides idiomatic .NET coding patterns.
Update your project file 1. Open the project file.
2. Set TargetFramework to net8.0.
3. Set OutputType to exe.
4. Remove PublishReadyToRun if it exists.
5. Add PublishAot and set to true.
6. Add or update NuGet package references to Amazon.Lambda.Annotations and Amazon.Lambda.RuntimeSupport. You can update using the NuGet UI in your IDE, manually, or by running dotnet add package Amazon.Lambda.RuntimeSupport and dotnet add package Amazon.Lambda.Annotations from your project directory.
Your project file should look similar to the following:
<Project Sdk="Microsoft.NET.Sdk"> <PropertyGroup> <OutputType>exe</OutputType> <TargetFramework>net8.0</TargetFramework> <ImplicitUsings>enable</ImplicitUsings> <Nullable>enable</Nullable> <AWSProjectType>Lambda</AWSProjectType> <CopyLocalLockFileAssemblies>true</CopyLocalLockFileAssemblies> <!-- Generate native aot images during publishing to improve cold start time. --> <PublishAot>true</PublishAot> <!-- StripSymbols tells the compiler to strip debugging symbols from the final executable if we're on Linux and put them into their own file. This will greatly reduce the final executable's size.--> <StripSymbols>true</StripSymbols> </PropertyGroup> <ItemGroup> <PackageReference Include="Amazon.Lambda.Core" Version="2.2.0" /> <PackageReference Include="Amazon.Lambda.RuntimeSupport" Version="1.10.0" /> <PackageReference Include="Amazon.Lambda.Serialization.SystemTextJson" Version="2.4.0" /> </ItemGroup></Project>
Updating your function code 1. 1. Reference the annotations library with using Amazon.Lambda.Annotations;
2. Add [assembly:LambdaGlobalProperties(GenerateMain = true)] to allow the annotations framework to create the main method. This is required as the project is now an executable instead of a library.
3. Add the below partial class and include a JsonSerializable attribute for any types that you need to serialize, including for your function input and output This partial class is used at build time to generate reflection free code dedicated to serializing the listed types. The following is an example:
```
/// <summary>/// This class is used to register the input event and return type for the FunctionHandler method with the System.Text.Json source generator./// There must be a JsonSerializable attribute for each type used as the input and return type or a runtime error will occur /// from the JSON serializer unable to find the serialization information for unknown types./// </summary>[JsonSerializable(typeof(APIGatewayHttpApiV2ProxyRequest))][JsonSerializable(typeof(APIGatewayHttpApiV2ProxyResponse))]public partial class MyCustomJsonSerializerContext : JsonSerializerContext{    // By using this partial class derived from JsonSerializerContext, we can generate reflection free JSON Serializer code at compile time    // which can deserialize our class and properties. However, we must attribute this class to tell it what types to generate serialization code for    // See https://docs.microsoft.com/en-us/dotnet/standard/serialization/system-text-json-source-generation}
```
 5. After the using statement, add the following to specify the serializer to use. `[assembly: LambdaSerializer(typeof(SourceGeneratorLambdaJsonSerializer<LambdaFunctionJsonSerializerContext>))]`Swap `LambdaFunctionJsonSerializerContext` for your context if you are not using the partial class from the previous step.
Updating your function configuration If you are using aws-lambda-tools-defaults.json.
1. Set `function-runtime` to `dotnet8`.
2. Set `function-architecture` to match your build machine – either `x86_64` or `arm64`.
3. Set (or update) `environment-variables` to include `ANNOTATIONS_HANDLER=<YourFunctionHandler>`. Replace `<YourFunctionHandler>` with the method name of your function handler, so the annotations framework knows which method to call from the generated *main* method.
4. Set `function-handler` to the name of the executable assembly in your bin directory. By default, this is your project name, which tells the .NET Lambda bootstrap script to run your native binary instead of starting the .NET runtime. If your project file has *AssemblyName* then use that value for the function handler.
{ "function-architecture": "x86_64", "function-runtime": "dotnet8", "function-handler": "<your-assembly-name>", "environment-variables", "ANNOTATIONS_HANDLER=<your-function-handler>",}
Deploy and test
1. Deploy your function. If you are using Amazon.Lambda.Tools, run dotnet lambda deploy-function. Check for trim warnings during build and refactor to eliminate them.
2. Test your function to ensure that the native calls into AL2023 are working correctly. By default, running local unit tests on your development machine won’t run natively and will still use the JIT compiler. Running with the JIT compiler does not allow you to catch native AOT specific runtime errors.Conclusion Lambda is introducing the new .NET 8 managed runtime. This post highlights new features in .NET 8. You can create new Lambda functions or migrate existing functions to .NET 8 or .NET 8 Native AOT.
For more information, see the AWS Lambda for .NET repository, documentation, and .NET on Serverless Land.
For more serverless learning resources, visit Serverless Land.
This post is written by Eder de Mattos, Sr. Cloud Security Consultant, AWS and Fernando Galves, Outpost Solutions Architect, AWS.
In this post, you will learn how to deploy an Amazon EMR cluster on AWS Outposts and use it to process data from an on-premises database. Many organizations have regulatory, contractual, or corporate policy requirements to process and store data in a specific geographical location. These strict requirements become a challenge for organizations to find flexible solutions that balance regulatory compliance with the agility of cloud services. Amazon EMR is the industry-leading cloud big data platform for data processing, interactive analysis, and machine learning (ML) that uses open-source frameworks. With Amazon EMR on Outposts, you can seamlessly use data analytics solutions to process data locally in your on-premises environment without moving data to the cloud. This post focuses on creating and configuring an Amazon EMR cluster on AWS Outposts rack using Amazon Virtual Private Cloud (Amazon VPC) endpoints and keeping the networking traffic in the on-premises environment.
Architecture overview In this architecture, there is an Amazon EMR cluster created in an AWS Outposts subnet. The cluster retrieves data from an on-premises PostgreSQL database, employs a PySpark Step for data processing, and then stores the result in a new table within the same database. The following diagram shows this architecture.
Figure 1 Architecture overview
Networking traffic on premises: The communication between the EMR cluster and the on-premises PostgreSQL database is through the Local Gateway. The core Amazon Elastic Compute Cloud (Amazon EC2) instances of the EMR cluster are associated with Customer-owned IP addresses (CoIP), and each instance has two IP addresses: an internal IP and a CoIP IP. The internal IP is used to communicate locally in the subnet, and the CoIP IP is used to communicate with the on-premises network.
Amazon VPC endpoints: Amazon EMR establishes communication with the VPC through an interface VPC endpoint. This communication is private and conducted entirely within the AWS network instead of connecting over the internet. In this architecture, VPC endpoints are created on a subnet in the AWS Region.
The support files used to create the EMR cluster are stored in an Amazon Simple Storage Service (Amazon S3) bucket. The communication between the VPC and Amazon S3 stays within the AWS network. The following files are stored in this S3 bucket:
*get-postgresql-driver.sh*: This is a bootstrap script to download the PostgreSQL driver to allow the Spark step to communicate to the PostgreSQL database through JDBC. You can download it through the GitHub repository for this Amazon EMR on Outposts blog post.*postgresql-42.6.0.jar*: PostgreSQL binary JAR file for the JDBC driver.*spark-step-example.py*: Example of a Step application in PySpark to simulate the connection to the PostgreSQL database.
AWS Systems Manager is configured to manage the EC2 instances that belong to the EMR cluster. It uses an interface VPC endpoint to allow the VPC to communicate privately with the Systems Manager.
The database credentials to connect to the PostgreSQL database are stored in AWS Secrets Manager. Amazon EMR integrates with Secrets Manager. This allows the secret to be stored in the Secrets Manager and be used through its ARN in the cluster configuration. During the creation of the EMR cluster, the secret is accessed privately through an interface VPC endpoint and stored in the variable DBCONNECTION in the EMR cluster.
In this solution, we are creating a small EMR cluster with one primary and one core node. For the correct sizing of your cluster, see Estimating Amazon EMR cluster capacity.
There is additional information to improve the security posture for organizations that use AWS Control Tower landing zone and AWS Organizations. The post Architecting for data residency with AWS Outposts rack and landing zone guardrails is a great place to start.
Prerequisites Before deploying the EMR cluster on Outposts, you must make sure the following resources are created and configured in your AWS account:
- Outposts rack are installed, up and running.
- Amazon EC2 key pair is created. To create it, you can follow the instructions in Create a key pair using Amazon EC2 in the Amazon EC2 user guide.
Deploying the EMR cluster on Outposts 1. Deploy the CloudFormation template to create the infrastructure for the EMR cluster You can use this AWS CloudFormation template to create the infrastructure for the EMR cluster. To create a stack, you can follow the instructions in Creating a stack on the AWS CloudFormation console in the AWS CloudFormation user guide.
- Create an EMR cluster To launch a cluster with Spark installed using the console:
Step 1: Configure Name and Applications
- Sign in to the AWS Management Console, and open the Amazon EMR console.
- Under EMR on EC2, in the left navigation pane, select Clusters, and then choose Create Cluster.
- On the Create cluster page, enter a unique cluster name for the Name
- For Amazon EMR release, choose
**emr-6.13.0**. - In the Application bundle field, select
**Spark 3.4.1**and**Zeppelin 0.10.1**, and unselect all the other options. - For the Operating system options, select Amazon Linux release.
Figure 2: Create Cluster
Step 2: Choose Cluster configuration method
- Under the Cluster configuration, select Uniform instance groups.
- For the Primary and the Core, select the EC2 instance type available in the Outposts rack that is supported by the EMR cluster.
- Remove the instance group Task 1 of 1.
Figure 3: Remove the instance group Task 1 of 1
Step 3: Set up Cluster scaling and provisioning, Networking and Cluster termination
- In the Cluster scaling and provisioning option, choose Set cluster size manually and type the value 1 for the Core
- On the Networking, select the VPC and the Outposts subnet.
- For Cluster termination, choose Manually terminate cluster.
Step 4: Configure the Bootstrap actions
A. In the Bootstrap actions, add an action with the following information:
-
- Name: copy-postgresql-driver.sh
- Script location: s3://
/copy-postgresql-driver.sh . Modify thevariable to the bucket name you specified as a parameter in Step 1.
Figure 4: Add bootstrap action
Step 5: Configure Cluster logs and Tags
a. Under Cluster logs, choose Publish cluster-specific logs to Amazon S3 and enter s3://
Figure 5: Amazon S3 location for cluster logs
b. In Tags, add new tag. You must enter for-use-with-amazon-emr-managed-policies for the Key field and true for Value.
Figure 6: Add tags
Step 6: Set up Software settings and Security configuration and EC2 key pair
a. In the Software settings, enter the following configuration replacing the Secret ARN created in Step 1:
[ { "Classification": "spark-defaults", "Properties": { "spark.driver.extraClassPath": "/opt/spark/postgresql/driver/postgresql-42.6.0.jar", "spark.executor.extraClassPath": "/opt/spark/postgresql/driver/postgresql-42.6.0.jar", "EMR.secret@spark.yarn.appMasterEnv.DBCONNECTION": "arn:aws:secretsmanager:<region>:<account-id>:secret:<secret-name>" } }]
This is an example of the Secret ARN replaced:
Figure 7: Example of the Secret ARN replaced
b. For the Security configuration and EC2 key pair, choose the SSH key pair.
Step 7: Choose Identity and Access Management (IAM) roles
a. Under Identity and Access Management (IAM) roles:
-
- In the Amazon EMR service role:
* Choose
**AmazonEMR-outposts-cluster-role**for the Service role. - In EC2 instance profile for Amazon EMR
- Choose
**AmazonEMR-outposts-EC2-role**.
- Choose
- In the Amazon EMR service role:
* Choose
Figure 8: Choose the service role and instance profile
Step 8: Create cluster
- Choose Create cluster to launch the cluster and open the cluster details page.
Now, the EMR cluster is starting. When your cluster is ready to process tasks, its status changes to Waiting. This means the cluster is up, running, and ready to accept work.
Figure 9: Result of the cluster creation
- Add CoIPs to EMR core nodes You need to allocate an Elastic IP from the CoIP pool and associate it with the EC2 instance of the EMR core nodes. This is necessary to allow the core nodes to access the on-premises environment. To allocate an Elastic IP, follow the instructions in Allocate an Elastic IP address in Amazon EC2 User Guide for Linux Instances. In Step 5, choose the Customer-owned pool of IPV4 addresses.
Once the CoIP IP is allocated, associate it with each EC2 instance of the EMR core node. Follow the instructions in Associate an Elastic IP address with an instance or network interface in Amazon EC2 User Guide for Linux Instances.
Checking the configuration 1. Make sure the EC2 instance of the core nodes can ping the IP of the PostgreSQL database.
Connect to the Core node EC2 instance using Systems Manager and ping the IP address of the PostgreSQL database.
Figure 10: Connectivity test
- Make sure the Status of the EMR cluster is Waiting.
Figure 11: Cluster is ready and waiting
Adding a step to the Amazon EMR cluster You can use the following Spark application to simulate the data processing from the PostgreSQL database.
spark-step-example.py:
import osfrom pyspark.sql import SparkSessionif __name__ == "__main__": # --------------------------------------------------------------------- # Step 1: Get the database connection information from the EMR cluster # configuration dbconnection = os.environ.get('DBCONNECTION') # Remove brackets dbconnection_info = (dbconnection[1:-1]).split(",") # Initialize variables dbusername = '' dbpassword = '' dbhost = '' dbport = '' dbname = '' dburl = '' # Parse the database connection information for dbconnection_attribute in dbconnection_info: (key_data, key_value) = dbconnection_attribute.split(":", 1) if key_data == "username": dbusername = key_value elif key_data == "password": dbpassword = key_value elif key_data == 'host': dbhost = key_value elif key_data == 'port': dbport = key_value elif key_data == 'dbname': dbname = key_value dburl = "jdbc:postgresql://" + dbhost + ":" + dbport + "/" + dbname # --------------------------------------------------------------------- # Step 2: Connect to the PostgreSQL database and select data from the # pg_catalog.pg_tables table spark_db = SparkSession.builder.config("spark.driver.extraClassPath", "/opt/spark/postgresql/driver/postgresql-42.6.0.jar") \ .appName("Connecting to PostgreSQL") \ .getOrCreate() # Connect to the database data_db = spark_db.read.format("jdbc") \ .option("url", dburl) \ .option("driver", "org.postgresql.Driver") \ .option("query", "select count(*) from pg_catalog.pg_tables") \ .option("user", dbusername) \ .option("password", dbpassword) \ .load() # --------------------------------------------------------------------- # Step 3: To do the data processing # # TO-DO # --------------------------------------------------------------------- # Step 4: Save the data into the new table in the PostgreSQL database # data_db.write \ .format("jdbc") \ .option("url", dburl) \ .option("dbtable", "results_proc") \ .option("user", dbusername) \ .option("password", dbpassword) \ .save() # --------------------------------------------------------------------- # Step 5: Close the Spark session # spark_db.stop() # ---------------------------------------------------------------------
You must upload the file spark-step-example.py to the bucket created in Step 1 of this post before submitting the Spark application to the EMR cluster. You can get the file at this GitHub repository for a Spark step example.
Submitting the Spark application step using the Console To submit the Spark application to the EMR cluster, follow the instructions in To submit a Spark step using the console in the Amazon EMR Release Guide. In Step 4 of this Amazon EMR guide, provide the following parameters to add a step:
- choose Cluster mode for the Deploy mode
- type a name for your step (such as Step 1)
- for the Application location, choose s3://
/spark-step-example.py and replace thevariable to the bucket name you specified as a parameter in Step 1 - leave the Spark-submit options field blank
Figure 12: Add a step to the EMR cluster
The Step is created with the Status Pending. When it is done, the Status changes to Completed.
Figure 13: Step executed successfully
Cleaning up When the EMR cluster is no longer needed, you can delete the resources created to avoid incurring future costs by following these steps:
- Follow the instructions in Terminate a cluster with the console in the Amazon EMR Documentation Management Guide. Remember to turn off the Termination protection.
- Dissociate and release the CoIP IPs allocated to the EC2 instances of the EMR core nodes.
- Delete the stack in the AWS CloudFormation using the instructions in Deleting a Stack on the AWS CloudFormation console in the AWS CloudFormation User Guide
Conclusion Amazon EMR on Outposts allows you to use the managed services offered by AWS to perform big data processing close to your data that needs to remain on-premises. This architecture eliminates the need to transfer on-premises data to the cloud, providing a robust solution for organizations with regulatory, contractual, or corporate policy requirements to store and process data in a specific location. With the EMR cluster accessing the on-premises database directly through local networking, you can expect faster and more efficient data processing without compromising on compliance or agility. To learn more, visit the Amazon EMR on AWS Outposts product overview page.
This post is written by Dennis Kieselhorst, Principal Solutions Architect.
The combination of portability, efficiency, community, and breadth of features has made Java a popular choice for businesses to build their applications for over 25 years. The introduction of serverless functions, pioneered by AWS Lambda, changed what you need in a programming language and runtime environment. Functions are often short-lived, single-purpose, and do not require extensive infrastructure configuration.
This blog post shows how you can modernize a legacy Java application to run on Lambda with minimal code changes using the updated AWS Serverless Java Container.
Deployment model comparison Classic Java enterprise applications often run on application servers such as JBoss/ WildFly, Oracle WebLogic and IBM WebSphere, or servlet containers like Apache Tomcat. The underlying Java virtual machine typically runs 24/7 and serves multiple requests using its multithreading capabilities.
Typical long running Java application server
When building Lambda functions with Java, an HTTP server is no longer required and there are other considerations for running code in a Lambda environment. Code runs in an execution environment, which processes a single invocation at a time. Functions can run for up to 15 minutes with a maximum of 10 Gb allocated memory.
Functions are triggered by events such as an HTTP request with a corresponding payload. An Amazon API Gateway HTTP request invokes the function with the following JSON payload:
Amazon API Gateway HTTP request payload
The code to process these events is different from how you implement it in a traditional application.
AWS Serverless Java Container The AWS Serverless Java Container makes it easier to run Java applications written with frameworks such as Spring, Spring Boot, or JAX-RS/Jersey in Lambda.
The container provides adapter logic to minimize code changes. Incoming events are translated to the Servlet specification so that frameworks work as before.
AWS Serverless Java Container adapter
Version 1 of this library was released in 2018. Today, AWS is announcing the release of version 2, which supports the latest Jakarta EE specification, along with Spring Framework 6.x, Spring Boot 3.x and Jersey 3.x.
Example: Modifying a Spring Boot application This following example illustrates how to migrate a Spring Boot 3 application. You can find the full example for Spring and other frameworks in the GitHub repository.
- Add the AWS Serverless Java dependency to your Maven POM build file (or Gradle accordingly):
<dependency> <groupId>com.amazonaws.serverless</groupId> <artifactId>aws-serverless-java-container-springboot3</artifactId> <version>2.0.0</version></dependency>
3. Spring Boot, by default, embeds Apache Tomcat to deal with HTTP requests. The examples use Amazon API Gateway to handle inbound HTTP requests so you can exclude the dependency.
<build> <plugins> <plugin> <groupId>org.apache.maven.plugins</groupId> <artifactId>maven-shade-plugin</artifactId> <configuration> <createDependencyReducedPom>false</createDependencyReducedPom> </configuration> <executions> <execution> <phase>package</phase> <goals> <goal>shade</goal> </goals> <configuration> <artifactSet> <excludes> <exclude>org.apache.tomcat.embed:*</exclude> </excludes> </artifactSet> </configuration> </execution> </executions> </plugin> </plugins></build>
The AWS Serverless Java Container accepts API Gateway proxy requests and transforms them into a plain Java object. The library also transforms outputs into a suitable API Gateway response object.
Once you run your build process, Maven’s Shade-plugin now produces an Uber-JAR that bundles all dependencies, which you can upload to Lambda.
- The Lambda runtime must know which handler method to invoke. You can configure and use the
SpringDelegatingLambdaContainerHandlerimplementation or implement your own handler Java class that delegates to AWS Serverless Java Container. This is useful if you want to add additional functionality. -
Configure the handler name in the runtime settings of your function. Configure the handler name
-
Configure an environment variable named
MAIN_CLASSto let the generic handler know where to find your original application main class, which is usually annotated with@SpringBootApplication. Configure MAIN_CLASS environment variable
You can also configure these settings using infrastructure as code (IaC) tools such as AWS CloudFormation, the AWS Cloud Development Kit (AWS CDK), or the AWS Serverless Application Model (AWS SAM).
In an AWS SAM template, the related changes are as follows. Full templates are part of the GitHub repository.
Handler: com.amazonaws.serverless.proxy.spring.SpringDelegatingLambdaContainerHandler Environment: Variables: MAIN_CLASS: com.amazonaws.serverless.sample.springboot3.Application
Optimizing memory configuration When running Lambda functions, start-up time and memory footprint are important considerations. The amount of memory you configure for your Lambda function also determines the amount of virtual CPU available. Adding more memory proportionally increases the amount of CPU, and therefore increases the overall computational power available. If a function is CPU-, network- or memory-bound, adding more memory can improve performance.
Lambda charges for the total amount of gigabyte-seconds consumed by a function. Gigabyte-seconds are a combination of total memory (in gigabytes) and duration (in seconds). Increasing memory incurs additional cost. However, in many cases, increasing the memory available causes a decrease in the function duration due to the additional CPU available. As a result, the overall cost increase may be negligible for additional performance, or may even decrease.
Choosing the memory allocated to your Lambda functions is an optimization process that balances speed (duration) and cost. You can manually test functions by selecting different memory allocations and measuring the completion time. AWS Lambda Power Tuning is a tool to simplify and automate the process, which you can use to optimize your configuration.
Power Tuning uses AWS Step Functions to run multiple concurrent versions of a Lambda function at different memory allocations and measures the performance. The function runs in your AWS account, performing live HTTP calls and SDK interactions, to measure performance in a production scenario.
Improving cold-start time with AWS Lambda SnapStart Traditional applications often have a large tree of dependencies. Lambda loads the function code and initializes dependencies during Lambda lifecycle initialization phase. With many dependencies, this initialization time may be too long for your requirements. AWS Lambda SnapStart for Java based functions can deliver up to 10 times faster startup performance.
Instead of running the function initialization phase on every cold-start, Lambda SnapStart runs the function initialization process at deployment time. Lambda takes a snapshot of the initialized execution environment. This snapshot is encrypted and persisted in a tiered cache for low latency access. When the function is invoked and scales, Lambda resumes the execution environment from the persisted snapshot instead of running the full initialization process. This results in lower startup latency.
To enable Lambda SnapStart you must first enable the configuration setting, and also publish a function version.
Enabling SnapStart
Ensure you point your API Gateway endpoint to the published version or an alias to ensure you are using the SnapStart enabled function.
The corresponding settings in an AWS SAM template contain the following:
SnapStart: ApplyOn: PublishedVersionsAutoPublishAlias: my-function-alias
Read the Lambda SnapStart compatibility considerations in the documentation as your application may contain specific code that requires attention.
Conclusion When building serverless applications with Lambda, you can deliver features faster, but your language and runtime must work within the serverless architectural model. AWS Serverless Java Container helps to bridge between traditional Java Enterprise applications and modern cloud-native serverless functions.
You can optimize the memory configuration of your Java Lambda function using AWS Lambda Power Tuning tool and enable SnapStart to optimize the initial cold-start time.
The self-paced Java on AWS Lambda workshop shows how to build cloud-native Java applications and migrate existing Java application to Lambda.
Explore the AWS Serverless Java Container GitHub repo where you can report related issues and feature requests.
For more serverless learning resources, visit Serverless Land.
Building and training generative artificial intelligence (AI) models, as well as predicting and providing accurate and insightful outputs requires a significant amount of infrastructure.
There’s a lot of data that goes into generating the high-quality synthetic text, images, and other media outputs that large-language models (LLMs), as well as foundational models (FMs), create. To start, the data set generally has somewhere around one billion variables present in the model that it was trained on (also known as parameters). To process that massive amount of data (think: petabytes), it can take hundreds of hardware accelerators (which are incorporated into purpose-built ML silicon or GPUs).
Given how much data is required for an effective LLM, it becomes costly and inefficient if an organization can’t access the data for these models as quickly as their GPUs/ML silicon are processing it. Selecting infrastructure for generative AI workloads impacts everything from cost to performance to sustainability goals to the ease of use. To successfully run training and inference for FMs organizations need:
- Price-performant accelerated computing (including the latest GPUs and dedicated ML Silicon) to power large generative AI workloads.
- High-performance and low-latency cloud storage that’s built to keep accelerators highly utilized.
- The most performant and cutting-edge technologies, networking, and systems to support the infrastructure for a generative AI workload.
- The ability to build with cloud services that can provide seamless integration across generative AI applications, tools, and infrastructure.
Overview of compute, storage, & networking for generative AI Amazon Elastic Compute Cloud (Amazon EC2) accelerated computing portfolio (including instances powered by GPUs and purpose-built ML silicon) offers the broadest choice of accelerators to power generative AI workloads.
To keep the accelerators highly utilized, they need constant access to data for processing. AWS provides this fast data transfer from storage (up to hundreds of GBs/TBs of data throughput) with Amazon FSx for Lustre and Amazon S3.
Accelerated computing instances combined with differentiated AWS technologies such as the AWS Nitro System, up to 3,200 Gbps of Elastic Fabric Adapter (EFA) networking, as well as exascale computing with Amazon EC2 UltraClusters helps to deliver the most performant infrastructure for generative AI workloads.
Coupled with other managed services such as Amazon SageMaker HyperPod and Amazon Elastic Kubernetes Service (Amazon EKS), these instances provide developers with the industry’s best platform for building and deploying generative AI applications.
This blog post will focus on highlighting announcements across Amazon EC2 instances, storage, and networking that are centered around generative AI.
AWS compute enhancements for generative AI workloads Training large FMs requires extensive compute resources and because every project is different, a broad set of options are needed so that organization of all sizes can iterate faster, train more models, and increase accuracy. In 2023, there were a lot of launches across the AWS compute category that supported both training and inference workloads for generative AI.
One of those launches, Amazon EC2 Trn1n instances, doubled the network bandwidth (compared to Trn1 instances) to 1600 Gbps of Elastic Fabric Adapter (EFA). That increased bandwidth delivers up to 20% faster time-to-train relative to Trn1 for training network-intensive generative AI models, such as LLMs and mixture of experts (MoE).
Watashiha offers an innovative and interactive AI chatbot service, “OGIRI AI,” which uses LLMs to incorporate humor and offer a more relevant and conversational experience to their customers. “This requires us to pre-train and fine-tune these models frequently. We pre-trained a GPT-based Japanese model on the EC2 Trn1.32xlarge instance, leveraging tensor and data parallelism,” said Yohei Kobashi, CTO, Watashiha, K.K. “The training was completed within 28 days at a 33% cost reduction over our previous GPU based infrastructure. As our models rapidly continue to grow in complexity, we are looking forward to Trn1n instances which has double the network bandwidth of Trn1 to speed up training of larger models.”
AWS continues to advance its infrastructure for generative AI workloads, and recently announced that Trainium2 accelerators are also coming soon. These accelerators are designed to deliver up to 4x faster training than first generation Trainium chips and will be able to be deployed in EC2 UltraClusters of up to 100,000 chips, making it possible to train FMs and LLMs in a fraction of the time, while improving energy efficiency up to 2x.
AWS has continued to invest in GPU infrastructure over the years, too. To date, NVIDIA has deployed 2 million GPUs on AWS, across the Ampere and Grace Hopper GPU generations. That’s 3 zetaflops, or 3,000 exascale super computers. Most recently, AWS announced the Amazon EC2 P5 Instances that are designed for time-sensitive, large-scale training workloads that use NVIDIA CUDA or CuDNN and are powered by NVIDIA H100 Tensor Core GPUs. They help you accelerate your time to solution by up to 4x compared to previous-generation GPU-based EC2 instances, and reduce cost to train ML models by up to 40%. P5 instances help you iterate on your solutions at a faster pace and get to market more quickly.
And to offer easy and predictable access to highly sought-after GPU compute capacity, AWS launched Amazon EC2 Capacity Blocks for ML. This is the first consumption model from a major cloud provider that lets you reserve GPUs for future use (up to 500 deployed in EC2 UltraClusters) to run short duration ML workloads.
AWS is also simplifying training with Amazon SageMaker HyperPod, which automates more of the processes required for high-scale fault-tolerant distributed training (e.g., configuring distributed training libraries, scaling training workloads across thousands of accelerators, detecting and repairing faulty instances), speeding up training by as much as 40%. Customers like Perplexity AI elastically scale beyond hundreds of GPUs and minimize their downtime with SageMaker HyperPod.
Deep-learning inference is another example of how AWS is continuing its cloud infrastructure innovations, including the low-cost, high-performance Amazon EC2 Inf2 instances powered by AWS Inferentia2. These instances are designed to run high-performance deep-learning inference applications at scale globally. They are the most cost-effective and energy-efficient option on Amazon EC2 for deploying the latest innovations in generative AI.
Another example is with Amazon SageMaker, which helps you deploy multiple models to the same instance so you can share compute resources—reducing inference cost by 50%. SageMaker also actively monitors instances that are processing inference requests and intelligently routes requests based on which instances are available—achieving 20% lower inference latency (on average).
AWS invests heavily in the tools for generative AI workloads. For AWS ML silicon, AWS has focused on AWS Neuron, the software development kit (SDK) that helps customers get the maximum performance from Trainium and Inferentia. Neuron supports the most popular publicly available models, including Llama 2 from Meta, MPT from Databricks, Mistral from mistral.ai, and Stable Diffusion from Stability AI, as well as 93 of the top 100 models on the popular model repository Hugging Face. It plugs into ML frameworks like PyTorch and TensorFlow, and support for JAX is coming early this year. It’s designed to make it easy for AWS customers to switch from their existing model training and inference pipelines to Trainium and Inferentia with just a few lines of code.
Cloud storage on AWS enhancements for generative AI Another way AWS is accelerating the training and inference pipelines is with improvements to storage performance—which is not only critical when thinking about the most common ML tasks (like loading training data into a large cluster of GPUs/accelerators), but also for checkpointing and serving inference requests. AWS announced several improvements to accelerate the speed of storage requests and reduce the idle time of your compute resources—which allows you to run generative AI workloads faster and more efficiently.
To gather more accurate predictions, generative AI workloads are using larger and larger datasets that require high-performant storage at scale to handle the sheer volume in of data.
With Amazon S3 Express One Zone a new storage class purpose-built to high-performance and low-latency object storage for an organizations most frequently accessed data, making it ideal for request-intensive operations like ML training and inference. Amazon S3 Express One Zone is the lowest-latency cloud object storage available, with data access speed up to 10x faster and request costs up to 50% lower than Amazon S3 Standard, from any AWS Availability Zone within an AWS Region.
AWS continues to optimize data access speeds for ML frameworks too. Recently, Amazon S3 Connector for PyTorch launched, which loads training data up to 40% faster than with the existing PyTorch connectors to Amazon S3. While most customers can meet their training and inference requirements using Mountpoint for Amazon S3 or Amazon S3 Connector for PyTorch, some are also building and managing their own custom data loaders. To deliver the fastest data transfer speeds between Amazon S3, and Amazon EC2 Trn1, P4d, and P5 instances, AWS recently announced the ability to automatically accelerate Amazon S3 data transfer in the AWS Command Line Interface (AWS CLI) and Python SDK. Now, training jobs download training data from Amazon S3 up to 3x faster and customers like Scenario are already seeing great results, with a 5x throughput improvement to model download times without writing a single line of code.
To meet the changing performance requirements that training generative AI workloads can require, Amazon FSx for Lustre announced throughput scaling on-demand. This is particularly useful for model training because it enables you to adjust the throughput tier of your file systems to meet these requirements with greater agility and lower cost.
EC2 networking enhancements for generative AI Last year, AWS introduced EC2 UltraCluster 2.0, a flatter and wider network fabric that’s optimized specifically for the P5 instance and future ML accelerators. It allows us to reduce latency by 16% and supports up to 20,000 GPUs, with up to 10x the overall bandwidth. In a traditional cluster architecture, as clusters get physically bigger, latency will also generally increase. But, with UltraCluster 2.0, AWS is increasing the size while reducing latency, and that’s exciting.
AWS is also continuing to help you make your network more efficient. Take for example a recent launch with Amazon EC2 Instance Topology API. It gives you an inside look at the proximity between your instances, so you can place jobs strategically. Optimized job scheduling means faster processing for distributed workloads. Moving jobs that exchange data the most frequently to the same physical location in a cluster can eliminate multiple hops in the data path. As models push boundaries, this type of software innovation is key to getting the most out of your hardware.
In addition to Amazon Q (a generative AI powered assistant from AWS), AWS also launched Amazon Q networking troubleshooting (preview).
You can ask Amazon Q to assist you in troubleshooting network connectivity issues caused by network misconfiguration in your current AWS account. For this capability, Amazon Q works with Amazon VPC Reachability Analyzer to check your connections and inspect your network configuration to identify potential issues. With Amazon Q network troubleshooting, you can ask questions about your network in conversational English—for example, you can ask, “why can’t I SSH to my server,” or “why is my website not accessible”.
Conclusion AWS is bringing customers even more choice for their infrastructure, including price-performant, sustainability focused, and ease-of-use options. Last year, AWS capabilities across this stack solidified our commitment to meeting the customer focus and goal of: Making generative AI accessible to customers of all sizes and technical abilities so they can get to reinventing and transforming what is possible.
Additional resources * For more information on AWS generative AI Infrastructure, go to the AWS Machine Learning Infrastructure page. * For more information on how AWS is building in the cloud with Generative AI across applications, tools, and infrastructure, go to the blog, “Welcome to a New Era of Building in the Cloud with Generative AI on AWS”.
This post is written by Josh Kahn, Tech Leader, Serverless.
Amazon EventBridge now supports publishing events to AWS AppSync GraphQL APIs as native targets. The new integration enables builders to publish events easily to a wider variety of consumers and simplifies updating clients with near real-time data. You can use EventBridge and AWS AppSync to build resilient, subscription-based event-driven architectures across consumers.
To illustrate using EventBridge with AWS AppSync, consider a simplified airport operations scenario. In this example, airlines publish flight events (for example, boarding, push back, gate changes, and delays) to a service that maintains flight status on in-airport displays. Airlines also publish events that are useful for other entities at the airport, such as baggage handlers and maintenance, but not to passengers. This depicts a conceptual view of the system:
Passengers want the in-airport displays to be up-to-date and accurate. There are a number of ways to design the display application so that data remains up-to-date. Broadly, these include the application polling some API or the application subscribing to data changes.
Subscriptions for this scenario are better as the data changes are small and incremental relative to the large amount of information displayed. In a delay, for example, the display updates the status and departure time but no other details of a single flight among a larger list of flight information.
AWS AppSync can enable clients to listen for real-time data changes through the use of GraphQL subscriptions. These are implemented using a WebSocket connection between the client and the AWS AppSync service. The display application client invokes the GraphQL subscription operation to establish a secure connection. AWS AppSync will automatically push data changes (or mutations) via the GraphQL API to subscribers using that connection.
Previously, builders could use EventBridge API Destinations to wire events published and routed through EventBridge to AWS AppSync, as described in an earlier blog post, and available in Serverless Land patterns (API Key, OAuth). The approach is useful for dealing with “out-of-band” updates in which data changes outside of an AWS AppSync mutation. Out-of-band updates generally require a NONE data source in AWS AppSync to notify subscribers of changes, as described in the AWS re:Post Knowledge Center. The addition of AWS AppSync as a target for EventBridge simplifies these use cases as you can now trigger a mutation in response to an event without additional code.
Airport Operations Events Expanding the scenario, airport operations events look like this:
{ "flightNum": 123, "carrierCode": "JK", "date": "2024-01-25", "event": "FlightDelayed", "message": "Delayed 15 minutes, late aircraft", "info": "{ \"newDepTime\": \"2024-01-25T13:15:00Z\", \"delayMinutes\": 15 }"}
The event field identifies the type of event and if it is relevant to passengers. The event details provide further information about the event, which varies based on the type of event. The airport publishes a variety of events but the airport displays only need a subset of those changes.
AWS AppSync GraphQL APIs start with a GraphQL schema that defines the types, fields, and operations available in that API. AWS AppSync documentation provides an overview of schema and other GraphQL essentials. The partial GraphQL schema for the airport scenario is as follows:
type DelayEventInfo implements EventInfo {message: StringdelayMinutes: IntnewDepTime: AWSDateTime}interface EventInfo {message: String}enum StatusEvent {FlightArrivedFlightBoardingFlightCancelledFlightDelayedFlightGateChangedFlightLandedFlightPushBackFlightTookOff}type StatusUpdate {num: Int!carrier: String!date: AWSDate!event: StatusEvent!info: EventInfo}input StatusUpdateInput {num: Int!carrier: String!date: AWSDate!event: StatusEvent!message: Stringextra: AWSJSON}type Mutation {updateFlightStatus(input: StatusUpdateInput!): StatusUpdate!}type Query {listStatusUpdates(by: String): [StatusUpdate]}type Subscription {onFlightStatusUpdate(date: AWSDate, carrier: String): StatusUpdate@aws_subscribe(mutations: ["updateFlightStatus"])}schema {query: Querymutation: Mutationsubscription: Subscription}
Connect EventBridge to AWS AppSync EventBridge allows you to filter, transform, and route events to a number of targets. The airport display service only needs events that directly impact passengers. You can define a rule in EventBridge that routes only those events (included in the preceding GraphQL schema) to the AWS AppSync target. Other events are routed elsewhere, as defined by other rules, or dropped. Details on creating EventBridge rules and the event matching pattern format can be found in EventBridge documentation.
The previous flight delayed event would be delivered using EventBridge as follows:
{ "id": "b051312994104931b0980d1ad1c5340f", "detail-type": "Operations: Flight delayed", "source": "airport-operations", "time": "2024-01-25T16:58:37Z", "detail": { "flightNum": 123, "carrierCode": "JK", "date": "2024-01-25", "event": "FlightDelayed", "message": "Delayed 15 minutes, late aircraft", "info": "{ \"newDepTime\": \"2024-01-25T13:15:00Z\", \"delayMinutes\": 15 }" }}
In this scenario, there is a specific list of events of interest, but EventBridge provides a flexible set of operations to match patterns, inspect arrays, and filter by content using prefix, numerical, or other matching. Some organizations will also allow subscribers to define their own rules on an EventBridge event bus, allowing targets to subscribe to events via self-service.
The following event pattern matches on the events needed for the airport display service:
{ "source": [ "airport-operations" ], "detail": { "event": [ "FlightArrived", "FlightBoarding", "FlightCancelled", ... ] }}
To create a new EventBridge rule, you can use the AWS Management Console or infrastructure as code. You can find the CloudFormation definition for the completed rule, with the AWS AppSync target, later in this post.
Create the AWS AppSync target Now that EventBridge is configured to route selected events, define AWS AppSync as the target for the rule. The AWS AppSync API must support IAM authorization to be used as an EventBridge target. AWS AppSync supports multiple authorization types on a single GraphQL type, so you can also use OpenID Connect, Amazon Cognito User Pools, or other authorization methods as needed.
To configure AWS AppSync as an EventBridge target, define the target using the AWS Management Console or infrastructure as code. In the console, select the Target Type as “AWS Service” and Target as “AppSync.” Select your API. EventBridge parses the GraphQL schema and allows you to select the mutation to invoke when the rule is triggered.
When using the AWS Management Console, EventBridge will also configure the necessary AWS IAM role to invoke the selected mutation. Remember to create and associate a role with an appropriate trust policy when configuring with IaC.
EventBridge supports input transformation to customize the contents of an event before passing the information as input to the target. Configure the input transformer to extract needed values from the event using JSON path and a template in the input format expected by the AWS AppSync API. EventBridge provides a handy utility in the Console to pass and test the output of a sample event.
Finally, configure the selection set to include the response from the AWS AppSync API. These are the fields that will be returned to EventBridge when the mutation is invoked. While the result returned to EventBridge is not overly useful (aside from troubleshooting), the mutation selection set will also determine the fields available to subscribers to the onFlightStatusUpdate subscription.
Define the EventBridge to AWS AppSync rule in CloudFormation Infrastructure as code templates, including AWS CloudFormation and AWS CDK, are useful for codifying infrastructure definitions to deploy across Regions and accounts. While you can write CloudFormation by hand, EventBridge provides a useful CloudFormation export in the AWS Management Console. You can use this feature to export the definition for a defined rule.
This is the CloudFormation for the previous configured rule and AWS AppSync target. This snippet includes both the rule definition and the target configuration.
PassengerEventsToDisplayServiceRule: Type: AWS::Events::Rule Properties: Description: Route passenger related events to the display service endpoint EventBusName: eb-to-appsync EventPattern: source: - airport-operations detail: event: - FlightArrived - FlightBoarding - FlightCancelled - FlightDelayed - FlightGateChanged - FlightLanded - FlightPushBack - FlightTookOff Name: passenger-events-to-display-service State: ENABLED Targets: - Id: 12344535353263463 Arn: <AppSync API GraphQL API ARN> RoleArn: <EventBridge Role ARN (defined elsewhere)> InputTransformer: InputPathsMap: carrier: $.detail.carrierCode date: $.detail.date event: $.detail.event extra: $.detail.info message: $.detail.message num: $.detail.flightNum InputTemplate: |- { "input": { "num": <num>, "carrier": <carrier>, "date": <date>, "event": <event>, "message": "<message>", "extra": <extra> } } AppSyncParameters: GraphQLOperation: >- mutation UpdateFlightStatus($input:StatusUpdateInput!){updateFlightStatus(input:$input){ event date carrier num info { __typename ... on DelayEventInfo { message delayMinutes newDepTime } } }}
The ARN of the AWS AppSync API follows the form arn:aws:appsync:<AWS_REGION>:<ACCOUNT_ID>:endpoints/graphql-api/<GRAPHQL_ENDPOINT_ID>. The ARN is available in CloudFormation (see GraphQLEndpointArn return value) or can be created using the identifier found in the AWS AppSync GraphQL endpoint. The ARN included in the EventBridge execution role policy is the AWS AppSync API ARN (a different ARN).
The AppSyncParameters field includes the GraphQL operation for EventBridge to invoke on the AWS AppSync API. This must be well formatted and match the GraphQL schema. Include any fields that must be available to subscribers in the selection set.
Testing subscriptions AWS AppSync is now configured as a target for the EventBridge rule. The real-life display application would use a GraphQL library, such as AWS Amplify, to subscribe to real-time data changes. The AWS Management Console provides a useful utility to test. Navigate to the AWS AppSync console and select Queries in the menu for your API. Enter the following query and choose Run to subscribe for data changes:
subscription MySubscription { onFlightStatusUpdate { carrier date event num info { __typename … on DelayEventInfo { message delayMinutes newDepTime } } }}
In a separate browser tab, navigate to the EventBridge console, and choose Send events. On the Send events page, select the required event bus and set the Event source to “airport-operations.” Then enter a detail type of your choice. Finally, paste the following as the Event detail, then choose Send.
{ "id": "b051312994104931b0980d1ad1c5340f", "detail-type": "Operations: Flight delayed", "source": "airport-operations", "time": "2024-01-25T16:58:37Z", "detail": { "flightNum": 123, "carrierCode": "JK", "date": "2024-01-25", "event": "FlightDelayed", "message": "Delayed 15 minutes, late aircraft", "info": "{ \"newDepTime\": \"2024-01-25T13:15:00Z\", \"delayMinutes\": 15 }" }}
Return to the AWS AppSync tab in your browser to see the changed data in the result pane:
Conclusion Directly invoking AWS AppSync GraphQL API targets from EventBridge simplifies and streamlines integration between these two services, ideal for notifying a variety of subscribers of data changes in event-driven workloads. You can also take advantage of other features available from the two services. For example, use AWS AppSync enhanced subscription filtering to update only airport displays in the terminal in which they are located.
To learn more about serverless, visit Serverless Land for a wide array of reusable patterns, tutorials, and learning materials. Newly added to the pattern library is an EventBridge to AWS AppSync pattern similar to the one described in this post. Visit EventBridge documentation for more details.
For more serverless learning resources, visit Serverless Land.
This post is written by Alex Paramonov, Sr. Solutions Architect, ISV, and Pieter Prinsloo, Customer Solutions Manager.
Workloads in AWS sometimes require access to data stored in on-premises databases and storage locations. Traditional solutions to establish connectivity to the on-premises resources require inbound rules to firewalls, a VPN tunnel, or public endpoints.
This blog post demonstrates how to use the MQTT protocol (AWS IoT Core) with AWS Step Functions to dispatch jobs to on-premises workers to access or retrieve data stored on-premises. The state machine can communicate with the on-premises workers without opening inbound ports or the need for public endpoints on on-premises resources. Workers can run behind Network Access Translation (NAT) routers while keeping bidirectional connectivity with the AWS Cloud. This provides a more secure and cost-effective way to access data stored on-premises.
Overview By using Step Functions with AWS Lambda and AWS IoT Core, you can access data stored on-premises securely without altering the existing network configuration.
AWS IoT Core lets you connect IoT devices and route messages to AWS services without managing infrastructure. By using a Docker container image running on-premises as a proxy IoT Thing, you can take advantage of AWS IoT Core’s fully managed MQTT message broker for non-IoT use cases.
MQTT subscribers receive information via MQTT topics. An MQTT topic acts as a matching mechanism between publishers and subscribers. Conceptually, an MQTT topic behaves like an ephemeral notification channel. You can create topics at scale with virtually no limit to the number of topics. In SaaS applications, for example, you can create topics per tenant. Learn more about MQTT topic design here.
The following reference architecture shown uses the AWS Serverless Application Model (AWS SAM) for deployment, Step Functions to orchestrate the workflow, AWS Lambda to send and receive on-premises messages, and AWS IoT Core to provide the MQTT message broker, certificate and policy management, and publish/subscribe topics.
- Start the state machine, either “on demand” or on a schedule.
- The state: “Lambda: Invoke Dispatch Job to On-Premises” publishes a message to an MQTT message broker in AWS IoT Core.
- The message broker sends the message to the topic corresponding to the worker (tenant) in the on-premises container that runs the job.
- The on-premises container receives the message and starts work execution. Authentication is done using client certificates and the attached policy limits the worker access to only the tenant’s topic.
- The worker in the on-premises container can access local resources like DBs or storage locations.
- The on-premises container sends the results and job status back to another MQTT topic.
- The AWS IoT Core rule invokes the “TaskToken Done” Lambda function.
- The Lambda function submits the results to Step Functions via SendTaskSuccess or SendTaskFailure API.
Deploying and testing the sample Ensure you can manage AWS resources from your terminal and that:
- Latest versions of AWS CLI and AWS SAM CLI are installed.
- You have an AWS account. If not, visit this page.
- Your user has sufficient permissions to manage AWS resources.
- Git is installed.
- Python version 3.11 or greater is installed.
- Docker is installed.
You can access the GitHub repository here and follow these steps to deploy the sample.
The aws-resources directory contains the required AWS resources including the state machine, Lambda functions, topics, and policies. The directory on-prem-worker contains the Docker container image artifacts. Use it to run the on-premises worker locally.
In this example, the worker container adds two numbers, provided as an input in the following format:
{ "a": 15, "b": 42}
In a real-world scenario, you can substitute this operation with business logic. For example, retrieving data from on-premises databases, generating aggregates, and then submitting the results back to your state machine.
Follow these steps to test the sample end-to-end.
Using AWS IoT Core without IoT devices There are no IoT devices in the example use case. However, the fully managed MQTT message broker in AWS IoT Core lets you route messages to AWS services without managing infrastructure.
AWS IoT Core authenticates clients using X.509 client certificates. You can attach a policy to a client certificate allowing the client to publish and subscribe only to certain topics. This approach does not require IAM credentials inside the worker container on-premises.
AWS IoT Core’s security, cost efficiency, managed infrastructure, and scalability make it a good fit for many hybrid applications beyond typical IoT use cases.
Dispatching jobs from Step Functions and waiting for a response When a state machine reaches the state to dispatch the job to an on-premises worker, the execution pauses and waits until the job finishes. Step Functions support three integration patterns: Request-Response, Sync Run a Job, and Wait for a Callback with Task Token. The sample uses the “Wait for a Callback with Task Token“ integration. It allows the state machine to pause and wait for a callback for up to 1 year.
When the on-premises worker completes the job, it publishes a message to the topic in AWS IoT Core. A rule in AWS IoT Core then invokes a Lambda function, which sends the result back to the state machine by calling either SendTaskSuccess or SendTaskFailure API in Step Functions.
You can prevent the state machine from timing out by adding HeartbeatSeconds to the task in the Amazon States Language (ASL). Timeouts happen if the job freezes and the SendTaskFailure API is not called. HeartbeatSeconds send heartbeats from the worker via the SendTaskHeartbeat API call and should be less than the specified TimeoutSeconds.
To create a task in ASL for your state machine, which waits for a callback token, use the following code:
{ "Type": "Task", "Resource": "arn:aws:states:::lambda:invoke.waitForTaskToken", "Parameters": { "FunctionName": "${LambdaNotifierToWorkerArn}", "Payload": { "Input.$": "$", "TaskToken.$": "$$.Task.Token" }}
The .waitForTaskToken suffix indicates that the task must wait for the callback. The state machine generates a unique callback token, accessible via the $$.Task.Token built-in variable, and passes it as an input to the Lambda function defined in FunctionName.
The Lambda function then sends the token to the on-premises worker via an AWS IoT Core topic.
Lambda is not the only service that supports Wait for Callback integration – see the full list of supported services here.
In addition to dispatching tasks and getting the result back, you can implement progress tracking and shut down mechanisms. To track progress, the worker sends metrics via a separate topic.
Depending on your current implementation, you have several options:
- Storing progress data from the worker in Amazon DynamoDB and visualizing it via REST API calls to a Lambda function, which reads from the DynamoDB table. Refer to this tutorial on how to store data in DynamoDB directly from the topic.
- For a reactive user experience, create a rule to invoke a Lambda function when new progress data arrives. Open a WebSocket connection to your backend. The Lambda function sends progress data via WebSocket directly to the frontend.
To implement a shutdown mechanism, you can run jobs in separate threads on your worker and subscribe to the topic, to which your state machine publishes the shutdown messages. If a shutdown message arrives, end the job thread on the worker and send back the status including the callback token of the task.
Using AWS IoT Core Rules and Lambda Functions A message with job results from the worker does not arrive to the Step Functions API directly. Instead, an AWS IoT Core Rule and a dedicated Lambda function forward the status message to Step Functions. This allows for more granular permissions in AWS IoT Core policies, which result in improved security because the worker container can only publish and subscribe to specific topics. No IAM credentials exist on-premises.
The Lambda function’s execution role contains the permissions for SendTaskSuccess, SendTaskHeartbeat, and SendTaskFailure API calls only.
Alternatively, a worker can run API calls in Step Functions workflows directly, which replaces the need for a topic in AWS IoT Core, a rule, and a Lambda function to invoke the Step Functions API. This approach requires IAM credentials inside the worker’s container. You can use AWS Identity and Access Management Roles Anywhere to obtain temporary security credentials. As your worker’s functionality evolves over time, you can add further AWS API calls while adding permissions to the IAM execution role.
Cleaning up The services used in this solution are eligible for AWS Free Tier. To clean up the resources in the aws-resources/ directory of the repository run:
sam delete
This removes all resources provisioned by the template.yml file.
To remove the client certificate from AWS, navigate to AWS IoT Core Certificates and delete the certificate, which you added during the manual deployment steps.
Lastly, stop the Docker container on-premises and remove it:
docker rm --force mqtt-local-client
Finally, remove the container image:
docker rmi mqtt-client-waitfortoken
Conclusion Accessing on-premises resources with workers controlled via Step Functions using MQTT and AWS IoT Core is a secure, reactive, and cost effective way to run on-premises jobs. Consider updating your hybrid workloads from using inefficient polling or schedulers to the reactive approach described in this post. This offers an improved user experience with fast dispatching and tracking of jobs outside of cloud.
For more serverless learning resources, visit Serverless Land.
Amazon Lightsail is the easiest way to get started on AWS, allowing you to get your application running on your own virtual server in a matter of minutes. Lightsail bundles all the resources you need like memory, vCPU, solid-state drive (SSD), and data transfer allowance into a predictable monthly price, so budgeting is easy and straightforward.
IPv6 instance bundles Announcing the availability of new IPv6 instance bundles on Lightsail. With the new bundles, you can now create and use Lightsail instances without a public IPv4 address. These bundles include an IPv6 address for use cases that do not require a public IPv4 address. Both Linux and Windows IPv6 bundles are available. See the full list of Amazon Lightsail instance blueprints compatible with IPv6 instances. If you have existing Lightsail instances with a public IPv4 address, you can migrate the instance to IPv6-only in a couple of steps: Create a snapshot of an existing instance, then create a new instance from the snapshot and select IPv6-only networking when choosing your instance plan.
To learn more about IPv6 bundles, read Lightsail documentation.
IPv4 instance bundles Lightsail will continue to offer bundles that include one public IPv4 address and IPv6 address. Following AWS’s announcement on public IPv4 address charge, the prices of Lightsail bundles offered with a public IPv4 address will reflect the charge associated with the public IPv4 address.
Revised prices for bundles that include a public IPv4 address will be effective on all new and existing Lightsail bundles starting May 1, 2024.
The tables below outline all Lightsail instance bundles and pricing.
Linux-based bundles:
Windows-based bundles:
*Bundles in the Asia Pacific (Mumbai) and Asia Pacific (Sydney) AWS Regions include lower data transfer allowances than other regions.
To learn more about Lightsail’s bundled offerings and pricing, please see the Lightsail pricing page.
This post is written by Thomas Moore, Senior Solutions Architect and Josh Hart, Senior Solutions Architect.
A previous blog post explores using Amazon API Gateway to create private REST APIs that can be consumed across different AWS accounts inside a virtual private cloud (VPC). Private cross-account APIs are useful for software vendors (ISVs) and SaaS companies providing secure connectivity for customers, and organizations building internal APIs and backend microservices.
Mutual TLS (mTLS) is an advanced security protocol that provides two-way authentication via certificates between a client and server. mTLS requires the client to send an X.509 certificate to prove its identity when making a request, together with the default server certificate verification process. This ensures that both parties are who they claim to be.
The mTLS connection process illustrated in the diagram above:
- Client connects to the server.
- Server presents its certificate, which is verified by the client.
- Client presents its certificate, which is verified by the server.
- Encrypted TLS connection established.
Customers use mTLS because it offers stronger security and identity verification than standard TLS connections. mTLS helps prevent man-in-the-middle attacks and protects against threats such as impersonation attempts, data interception, and tampering. As threats become more advanced, mTLS provides an extra layer of defense to validate connections.
Implementing mTLS increases overhead for certificate management, but for applications transmitting valuable or sensitive data, the extra security is important. If security is a priority for your systems and users, you should consider deploying mTLS.
Regional API Gateway endpoints have native support for mTLS but private API Gateway endpoints do not support mTLS, so you must terminate mTLS before API Gateway. The previous blog post shows how to build private mTLS APIs using a self-managed verification process inside a container running an NGINX proxy. Since then, Application Load Balancer (ALB) now supports mTLS natively, simplifying the architecture.
This post explores building mTLS private APIs using this new feature.
Application Load Balancer mTLS configuration You can enable mutual authentication (mTLS) on a new or existing Application Load Balancer. By enabling mTLS on the load balancer listener, clients are required to present trusted certificates to connect. The load balancer validates the certificates before allowing requests to the backends.
There are two options available when configuring mTLS on the Application Load Balancer: Passthrough mode and Verify with trust store mode.
In Passthrough mode, the client certificate chain is passed as an X-Amzn-Mtls-Clientcert HTTP header for the application to inspect for authorization. In this scenario, there is still a backend verification process. The benefit in adding the ALB to the architecture is that you can perform application (layer 7) routing, such as path-based routing, allowing more complex application routing configurations.
In Verify with trust store mode, the load balancer validates the client certificate and only allows clients providing trusted certificates to connect. This simplifies the management and reduces load on backend applications.
This example uses AWS Private Certificate Authority but the steps are similar for third-party certificate authorities (CA).
To configure the certificate Trust Store for the ALB:
- Create an AWS Private Certificate Authority. Specify the Common Name (CN) to be the domain you use to host the application at (for example, api.example.com).
- Export the CA using either the CLI or the Console and upload the resulting Certificate.pem to an Amazon S3 bucket.
- Create a Trust Store, point this at the certificate uploaded in the previous step.
- Update the listener of your Application Load Balancer to use this trust store and select the required mTLS verification behavior.
- Generate certificates for the client application against the private certificate authority, for example using the following commands:
openssl req -new -newkey rsa:2048 -days 365 -keyout my_client.key -out my_client.csraws acm-pca issue-certificate –certificate-authority-arn arn:aws:acm-pca:us-east-1:111122223333:certificate-authority/certificate_authority_id–csr fileb://my_client.csr –signing-algorithm “SHA256WITHRSA” –validity Value=365,Type=”DAYS” –template-arn arn:aws:acm-pca:::template/EndEntityCertificate/V1aws acm-pca get-certificate -certificate-authority-arn arn:aws:acm-pca:us-east-1:111122223333:certificate-authority/certificate_authority_id–certificate-arn arn:aws:acm-pca:us-east-1:account_id:certificate-authority/certificate_authority_id/certificate/certificate_id–output text
For more details on this part of the process, see Use ACM Private CA for Amazon API Gateway Mutual TLS.
Private API Gateway mTLS verification using an ALB Using the ALB Verify with trust store mode together with API Gateway can enable private APIs with mTLS, without the operational burden of a self-managed proxy service.
You can use this pattern to access API Gateway in the same AWS account, or cross-account.
The same account pattern allows clients inside the VPC to consume the private API Gateway by calling the Application Load Balancer URL. The ALB is configured to verify the provided client certificate against the trust store before passing the request to the API Gateway.
If the certificate is invalid, the API never receives the request. A resource policy on the API Gateway ensures that can requests are only allowed via the VPC endpoint, and a security group on the VPC endpoint ensures that it can only receive requests from the ALB. This prevents the client from bypassing mTLS by invoking the API Gateway or VPC endpoints directly.
The cross-account pattern using AWS PrivateLink provides the ability to connect to the ALB endpoint securely across accounts and across VPCs. It avoids the need to connect VPCs together using VPC Peering or AWS Transit Gateway and enables software vendors to deliver SaaS services to be consumed by their end customers. This pattern is available to deploy as sample code in the GitHub repository.
The flow of a client request through the cross-account architecture is as follows:
- A client in the consumer application sends a request to the producer API endpoint.
- The request is routed via AWS PrivateLink to a Network Load Balancer in the consumer account. The Network Load Balancer is a requirement of AWS PrivateLink services.
- The Network Load Balancer uses an Application Load Balancer-type Target Group.
- The Application Load Balancer listener is configured for mTLS in verify with trust store mode.
- An authorization decision is made comparing the client certificate to the chain in the certificate trust store.
- If the client certificate is allowed the request is routed to the API Gateway via the execute-api VPC Endpoint. An API Gateway resource policy is used to allow connections only via the VPC endpoint.
- Any additional API Gateway authentication and authorization is performed, such as using a Lambda authorizer to validate a JSON Web Token (JWT).
Using the example deployed from the GitHub repo, this is the expected response from a successful request with a valid certificate:
curl –key my_client.key –cert my_client.pem https://api.example.com/widgets {“id”:”1”,”value”:”4.99”}
When passing an invalid certificate, the following response is received:
curl: (35) Recv failure: Connection reset by peer
Custom domain names An additional benefit to implementing the mTLS solution with an Application Load Balancer is support for private custom domain names. Private API Gateway endpoints do not support custom domain names currently. But in this case, clients first connect to an ALB endpoint, which does support a custom domain. The sample code implements private custom domains using a public AWS Certificate Manager (ACM) certificate on the internal ALB, and an Amazon Route 53 hosted DNS zone. This allows you to provide a static URL to consumers so that if the API Gateway is replaced the consumer does not need to update their code.
Certificate revocation list Optionally, as another layer of security, you can also configure a certificate revocation list for a trust store on the ALB. Revocation lists allow you to revoke and invalidate issued certificates before their expiry date. You can use this feature to off-boarding customers or denying compromised credentials, for example.
You can add the certificate revocation list to a new or existing trust store. The list is provided via an Amazon S3 URI as a PEM formatted file.
Conclusion This post explores ways to provide mutual TLS authentication for private API Gateway endpoints. A previous post shows how to achieve this using a self-managed NGINX proxy. This post simplifies the architecture by using the native mTLS support now available for Application Load Balancers.
This new pattern centralizes authentication at the edge, streamlines deployment, and minimizes operational overhead compared to self-managed verification. AWS Private Certificate Authority and certificate revocation lists integrate with managed credentials and security policies. This makes it easier to expose private APIs safely across accounts and VPCs.
Mutual authentication and progressive security controls are growing in importance when architecting secure cloud-based workloads. To get started, visit the GitHub repository.
For more serverless learning resources, visit Serverless Land.
This post is written by Anna Spysz, Frontend Engineer, AWS Application Composer
AWS Application Composer launched in the AWS Management Console one year ago, and has now expanded to the VS Code IDE as part of the AWS Toolkit. This includes access to a generative AI partner that helps you write infrastructure as code (IaC) for all 1100+ AWS CloudFormation resources that Application Composer now supports.
Overview Application Composer lets you create IaC templates by dragging and dropping cards on a virtual canvas. These represent CloudFormation resources, which you can wire together to create permissions and references. With support for all 1100+ resources that CloudFormation allows, you can now build with everything from AWS Amplify to AWS X-Ray.
Previously, standard CloudFormation resources came only with a basic configuration. Adding an Amplify App resource resulted in the following configuration by default:
MyAmplifyApp: Type: AWS::Amplify::App Properties: Name: <String>
And in the console:
AWS App Composer in the console
Now, Application Composer in the IDE uses generative AI to generate resource-specific configurations with safeguards such as validation against the CloudFormation schema to ensure valid values.
When working on a CloudFormation or AWS Serverless Application Model (AWS SAM) template in VS Code, you can sign in with your Builder ID and generate multiple suggested configurations in Application Composer. Here is an example of an AI generated configuration for the AWS::Amplify::App type:
AI generated configuration for the Amplify App type
These suggestions are specific to the resource type, and are safeguarded by a check against the CloudFormation schema to ensure valid values or helpful placeholders. You can then select, use, and modify the suggestions to fit your needs.
You now know how to generate a basic example with one resource, but let’s look at building a full application with the help of AI-generated suggestions. This example recreates a serverless application from a Serverless Land tutorial, “Use GenAI capabilities to build a chatbot,” using Application Composer and generative AI-powered code suggestions.
Getting started with the AWS Toolkit in VS Code If you don’t yet have the AWS Toolkit extension, you can find it under the Extensions tab in VS Code. Install or update it to at least version 2.1.0, so that the screen shows Amazon Q and Application Composer:
Amazon Q and Application Composer
Next, to enable gen AI-powered code suggestions, you must enable Amazon CodeWhisperer using your Builder ID. The easiest way is to open Amazon Q chat, and select Authenticate. On the next screen, select the Builder ID option, then sign in with your Builder ID.
Enable Amazon CodeWhisperer using your Builder ID
After sign-in, your connection appears in the VS Code toolkit panel:
Connection in VS Code toolkit panel
Building with Application Composer With the toolkit installed and connected with your Builder ID, you are ready to start building.
- In a new workspace, create a folder for the application and a blank
template.yamlfile. - Open this file and initiate Application Composer by choosing the icon in the top right.
Original architecture diagram
The original tutorial includes this architecture diagram:
Initiate Application Composer
First, add the services in the diagram to sketch out the application architecture, which simultaneously creates a deployable CloudFormation template:
- From the
Enhanced componentslist, drag in a Lambda function and a Lambda layer. - Double-click the Function resource to edit its properties. Rename the Lambda function’s Logical ID to
LexGenAIBotLambda. - Change the Source path to
src/LexGenAIBotLambda, and the runtime to Python. - Change the handler value to
TextGeneration.lambda_handler, and choose Save. - Double-click the Layer resource to edit its properties. Rename the layer
Boto3Layerand change its build method to Python. Change its Source path tosrc/Boto3PillowPyshorteners.zip. - Finally, connect the layer to the function to add a reference between them. Your canvas looks like this:
Your App Composer canvas
The template.yaml file is now updated to include those resources. In the source directory, you can see some generated function files. You will replace them with the tutorial function and layers later.
In the first step, you added some resources and Application Composer generated IaC that includes best practices defaults. Next, you will use standard CloudFormation components.
Using AI for standard components Start by using the search bar to search for and add several of the Standard components needed for your application.
Search for and add Standard components
- In the Resources search bar, enter “lambda” and add the resource type
AWS::Lambda::Permissionto the canvas. - Enter “iam” in the search bar, and add type
AWS::IAM::Policy. - Add two resources of the type
AWS::IAM::Role.
Your application now look like this:
Updated canvas
Some standard resources have all the defaults you need. For example, when you add the AWS::Lambda::Permission resource, replace the placeholder values with:
FunctionName: !Ref LexGenAIBotLambdaAction: lambda:InvokeFunctionPrincipal: lexv2.amazonaws.com
Other resources, such as the IAM roles and IAM policy, have a vanilla configuration. This is where you can use the AI assistant. Select an IAM Role resource and choose Generate suggestions to see what the generative AI suggests.
Generate suggestions
Because these suggestions are generated by a Large Language Model (LLM), they may differ between each generation. These are checked against the CloudFormation schema, ensuring validity and providing a range of configurations for your needs.
Generating different configurations gives you an idea of what a resource’s policy should look like, and often gives you keys that you can then fill in with the values you need. Use the following settings for each resource, replacing the generated values where applicable.
- Double-click the “Permission” resource to edit its settings. Change its Logical ID to
LexGenAIBotLambdaInvokeand replace its Resource configuration with the following, then choose Save:
Action: lambda:InvokeFunctionFunctionName: !GetAtt LexGenAIBotLambda.ArnPrincipal: lexv2.amazonaws.com
3. Double-click the “Role” resource to edit its settings. Change its Logical ID to CfnLexGenAIDemoRole and replace its Resource configuration with the following, then choose Save:
AssumeRolePolicyDocument: Statement: - Action: sts:AssumeRole Effect: Allow Principal: Service: lexv2.amazonaws.com Version: '2012-10-17'ManagedPolicyArns: - !Join - '' - - 'arn:' - !Ref AWS::Partition - ':iam::aws:policy/AWSLambdaExecute'
5. Double-click the “Role2” resource to edit its settings. Change its Logical ID to LexGenAIBotLambdaServiceRole and replace its Resource configuration with the following, then choose Save:
AssumeRolePolicyDocument: Statement: - Action: sts:AssumeRole Effect: Allow Principal: Service: lambda.amazonaws.com Version: '2012-10-17'ManagedPolicyArns: - !Join - '' - - 'arn:' - !Ref AWS::Partition - ':iam::aws:policy/service-role/AWSLambdaBasicExecutionRole'
7. Double-click the “Policy” resource to edit its settings. Change its Logical ID to LexGenAIBotLambdaServiceRoleDefaultPolicy and replace its Resource configuration with the following, then choose Save:
PolicyDocument: Statement: - Action: - lex:* - logs:* - s3:DeleteObject - s3:GetObject - s3:ListBucket - s3:PutObject Effect: Allow Resource: '*' - Action: bedrock:InvokeModel Effect: Allow Resource: !Join - '' - - 'arn:aws:bedrock:' - !Ref AWS::Region - '::foundation-model/anthropic.claude-v2' Version: '2012-10-17'PolicyName: LexGenAIBotLambdaServiceRoleDefaultPolicyRoles: - !Ref LexGenAIBotLambdaServiceRole
Once you have updated the properties of each resource, you see the connections and groupings automatically made between them:
Connections and automatic groupings
To add the Amazon Lex bot:
- In the resource picker, search for and add the type AWS::Lex::Bot. Here’s another chance to see what configuration the AI suggests.
- Change the Amazon Lex bot’s logical ID to
LexGenAIBotupdate its configuration to the following:
DataPrivacy: ChildDirected: falseIdleSessionTTLInSeconds: 300Name: LexGenAIBotRoleArn: !GetAtt CfnLexGenAIDemoRole.ArnAutoBuildBotLocales: trueBotLocales: - Intents: - InitialResponseSetting: CodeHook: EnableCodeHookInvocation: true IsActive: true PostCodeHookSpecification: {} IntentClosingSetting: ClosingResponse: MessageGroupsList: - Message: PlainTextMessage: Value: Hi there, I'm a GenAI Bot. How can I help you? Name: WelcomeIntent SampleUtterances: - Utterance: Hi - Utterance: Hey there - Utterance: Hello - Utterance: I need some help - Utterance: Help needed - Utterance: Can I get some help? - FulfillmentCodeHook: Enabled: true IsActive: true PostFulfillmentStatusSpecification: {} InitialResponseSetting: CodeHook: EnableCodeHookInvocation: true IsActive: true PostCodeHookSpecification: {} Name: GenerateTextIntent SampleUtterances: - Utterance: Generate content for - Utterance: 'Create text ' - Utterance: 'Create a response for ' - Utterance: Text to be generated for - FulfillmentCodeHook: Enabled: true IsActive: true PostFulfillmentStatusSpecification: {} InitialResponseSetting: CodeHook: EnableCodeHookInvocation: true IsActive: true PostCodeHookSpecification: {} Name: FallbackIntent ParentIntentSignature: AMAZON.FallbackIntent LocaleId: en_US NluConfidenceThreshold: 0.4Description: Bot created demonstration of GenAI capabilities.TestBotAliasSettings: BotAliasLocaleSettings: - BotAliasLocaleSetting: CodeHookSpecification: LambdaCodeHook: CodeHookInterfaceVersion: '1.0' LambdaArn: !GetAtt LexGenAIBotLambda.Arn Enabled: true LocaleId: en_US
4. Choose Save on the resource.
Once all of your resources are configured, your application looks like this:
New AI generated canvas
Adding function code and deployment Once your architecture is defined, review and refine your template.yaml file. For a detailed reference and to ensure all your values are correct, visit the GitHub repository and check against the template.yaml file.
- Copy the Lambda layer directly from the repository, and add it to
./src/Boto3PillowPyshorteners.zip. - In the
.src/directory, rename the generatedhandler.pytoTextGeneration.py. You can also delete any unnecessary files. - Open
TextGeneration.pyand replace the placeholder code with the following:
import jsonimport boto3import osimport loggingfrom botocore.exceptions import ClientErrorLOG = logging.getLogger()LOG.setLevel(logging.INFO)region_name = os.getenv("region", "us-east-1")s3_bucket = os.getenv("bucket")model_id = os.getenv("model_id", "anthropic.claude-v2")# Bedrock client used to interact with APIs around modelsbedrock = boto3.client(service_name="bedrock", region_name=region_name)# Bedrock Runtime client used to invoke and question the modelsbedrock_runtime = boto3.client(service_name="bedrock-runtime", region_name=region_name)def get_session_attributes(intent_request): session_state = intent_request["sessionState"] if "sessionAttributes" in session_state: return session_state["sessionAttributes"] return {}def close(intent_request, session_attributes, fulfillment_state, message): intent_request["sessionState"]["intent"]["state"] = fulfillment_state return { "sessionState": { "sessionAttributes": session_attributes, "dialogAction": {"type": "Close"}, "intent": intent_request["sessionState"]["intent"], }, "messages": [message], "sessionId": intent_request["sessionId"], "requestAttributes": intent_request["requestAttributes"] if "requestAttributes" in intent_request else None, }def lambda_handler(event, context): LOG.info(f"Event is {event}") accept = "application/json" content_type = "application/json" prompt = event["inputTranscript"] try: request = json.dumps( { "prompt": "\n\nHuman:" + prompt + "\n\nAssistant:", "max_tokens_to_sample": 4096, "temperature": 0.5, "top_k": 250, "top_p": 1, "stop_sequences": ["\\n\\nHuman:"], } ) response = bedrock_runtime.invoke_model( body=request, modelId=model_id, accept=accept, contentType=content_type, ) response_body = json.loads(response.get("body").read()) LOG.info(f"Response body: {response_body}") response_message = { "contentType": "PlainText", "content": response_body["completion"], } session_attributes = get_session_attributes(event) fulfillment_state = "Fulfilled" return close(event, session_attributes, fulfillment_state, response_message) except ClientError as e: LOG.error(f"Exception raised while execution and the error is {e}")
5. To deploy the infrastructure, go back to the App Composer extension, and choose the Sync icon. Follow the guided AWS SAM instructions to complete the deployment.
App Composer Sync
After the message SAM Sync succeeded, navigate to CloudFormation in the AWS Management Console to see the newly created resources. To continue building the chatbot, follow the rest of the original tutorial.
Conclusion This guide demonstrates how AI-generated CloudFormation can streamline your workflow in Application Composer, enhance your understanding of resource configurations, and speed up the development process. As always, adhere to the AWS Responsible AI Policy when using these features.
Welcome to the 24th edition of the AWS Serverless ICYMI (in case you missed it) quarterly recap. Every quarter, we share all the most recent product launches, feature enhancements, blog posts, webinars, live streams, and other interesting things that you might have missed!
In case you missed our last ICYMI, check out what happened last quarter here.
2023 Q4 Calendar
ServerlessVideo ServerlessVideo at re:Invent 2024
ServerlessVideo is a demo application built by the AWS Serverless Developer Advocacy team to stream live videos and also perform advanced post-video processing. It uses several AWS services including AWS Step Functions, Amazon EventBridge, AWS Lambda, Amazon ECS, and Amazon Bedrock in a serverless architecture that makes it fast, flexible, and cost-effective. Key features include an event-driven core with loosely coupled microservices that respond to events routed by EventBridge. Step Functions orchestrates using both Lambda and ECS for video processing to balance speed, scale, and cost. There is a flexible plugin-based architecture using Step Functions and EventBridge to integrate and manage multiple video processing workflows, which include GenAI.
ServerlessVideo allows broadcasters to stream video to thousands of viewers using Amazon IVS. When a broadcast ends, a Step Functions workflow triggers a set of configured plugins to process the video, generating transcriptions, validating content, and more. The application incorporates various microservices to support live streaming, on-demand playback, transcoding, transcription, and events. Learn more about the project and watch videos from reinvent 2023 at video.serverlessland.com.
AWS Lambda AWS Lambda enabled outbound IPv6 connections from VPC-connected Lambda functions, providing virtually unlimited scale by removing IPv4 address constraints.
The AWS Lambda and AWS SAM teams also added support for sharing test events across teams using AWS SAM CLI to improve collaboration when testing locally.
AWS Lambda introduced integration with AWS Application Composer, allowing users to view and export Lambda function configuration details for infrastructure as code (IaC) workflows.
AWS added advanced logging controls enabling adjustable JSON-formatted logs, custom log levels, and configurable CloudWatch log destinations for easier debugging. AWS enabled monitoring of errors and timeouts occurring during initialization and restore phases in CloudWatch Logs as well, making troubleshooting easier.
For Kafka event sources, AWS enabled failed event destinations to prevent functions stalling on failing batches by rerouting events to SQS, SNS, or S3. AWS also enhanced Lambda auto scaling for Kafka event sources in November to reach maximum throughput faster, reducing latency for workloads prone to large bursts of messages.
AWS launched support for Python 3.12 and Java 21 Lambda runtimes, providing updated libraries, smaller deployment sizes, and better AWS service integration. AWS also introduced a simplified console workflow to automate complex network configuration when connecting functions to Amazon RDS and RDS Proxy.
Additionally in December, AWS enabled faster individual Lambda function scaling allowing each function to rapidly absorb traffic spikes by scaling up to 1000 concurrent executions every 10 seconds.
Amazon ECS and AWS Fargate In Q4 of 2023, AWS introduced several new capabilities across its serverless container services including Amazon ECS, AWS Fargate, AWS App Runner, and more. These features help improve application resilience, security, developer experience, and migration to modern containerized architectures.
In October, Amazon ECS enhanced its task scheduling to start healthy replacement tasks before terminating unhealthy ones during traffic spikes. This prevents going under capacity due to premature shutdowns. Additionally, App Runner launched support for IPv6 traffic via dual-stack endpoints to remove the need for address translation.
In November, AWS Fargate enabled ECS tasks to selectively use SOCI lazy loading for only large container images in a task instead of requiring it for all images. Amazon ECS also added idempotency support for task launches to prevent duplicate instances on retries. Amazon GuardDuty expanded threat detection to Amazon ECS and Fargate workloads which users can easily enable.
Also in November, the open source Finch container tool for macOS became generally available. Finch allows developers to build, run, and publish Linux containers locally. A new website provides tutorials and resources to help developers get started.
Finally in December, AWS Migration Hub Orchestrator added new capabilities for replatforming applications to Amazon ECS using guided workflows. App Runner also improved integration with Route 53 domains to automatically configure required records when associating custom domains.
AWS Step Functions In Q4 2023, AWS Step Functions announced the redrive capability for Standard Workflows. This feature allows failed workflow executions to be redriven from the point of failure, skipping unnecessary steps and reducing costs. The redrive functionality provides an efficient way to handle errors that require longer investigation or external actions before resuming the workflow.
Step Functions also launched support for HTTPS endpoints in AWS Step Functions, enabling easier integration with external APIs and SaaS applications without needing custom code. Developers can now connect to third-party HTTP services directly within workflows. Additionally, AWS released a new test state capability that allows testing individual workflow states before full deployment. This feature helps accelerate development by making it faster and simpler to validate data mappings and permissions configurations.
AWS announced optimized integrations between AWS Step Functions and Amazon Bedrock for orchestrating generative AI workloads. Two new API actions were added specifically for invoking Bedrock models and training jobs from workflows. These integrations simplify building prompt chaining and other techniques to create complex AI applications with foundation models.
Finally, the Step Functions Workflow Studio is now integrated in the AWS Application Composer. This unified builder allows developers to design workflows and define application resources across the full project lifecycle within a single interface.
Amazon EventBridge Amazon EventBridge announced support for new partner integrations with Adobe and Stripe. These integrations enable routing events from the Adobe and Stripe platforms to over 20 AWS services. This makes it easier to build event-driven architectures to handle common use cases.
Amazon SNS In Q4, Amazon SNS added native in-place message archiving for FIFO topics to improve event stream durability by allowing retention policies and selective replay of messages without provisioning separate resources. Additional message filtering operators were also introduced including suffix matching, case-insensitive equality checks, and OR logic for matching across properties to simplify routing logic implementation for publishers and subscribers. Finally, delivery status logging was enabled through AWS CloudFormation.
Amazon SQS Amazon SQS has introduced several major new capabilities and updates. These improve visibility, throughput, and message handling for users. Specifically, Amazon SQS enabled AWS CloudTrail logging of key SQS APIs. This gives customers greater visibility into SQS activity. Additionally, SQS increased the throughput quota for the high throughput mode of FIFO queues. This was significantly increased in certain Regions. It also boosted throughput in Asia Pacific Regions. Furthermore, Amazon SQS added dead letter queue redrive support. This allows you to redrive messages that failed and were sent to a dead letter queue (DLQ).
Serverless at AWS re:Invent Serverless videos from re:Invent
Visit the Serverless Land YouTube channel to find a list of serverless and serverless container sessions from reinvent 2023. Hear from experts like Chris Munns and Julian Wood in their popular session, Best practices for serverless developers, or Nathan Peck and Jessica Deen in Deploying multi-tenant SaaS applications on Amazon ECS and AWS Fargate.
EDA Day Nashville EDA Day Nashville
The AWS Serverless Developer Advocacy team hosted an event-driven architecture (EDA) day conference on October 26, 2023 in Nashville, Tennessee. This inaugural GOTO EDA day convened over 200 attendees ranging from prominent EDA community members to AWS speakers and product managers. Attendees engaged in 13 sessions, two workshops, and panels covering EDA adoption best practices. The event built upon 2022 content by incorporating additional topics like messaging, containers, and machine learning. It also created opportunities for students and underrepresented groups in tech to participate. The full-day conference facilitated education, inspiration, and thoughtful discussion around event-driven architectural patterns and services on AWS.
Videos from EDA Day are now available on the Serverless Land YouTube channel.
Serverless blog posts October * Filtering events in Amazon EventBridge with wildcard pattern matching * Enhancing runtime security and governance with the AWS Lambda Runtime API proxy extension * Archiving and replaying messages with Amazon SNS FIFO * Sending and receiving webhooks on AWS: Innovate with event notifications
November * Orchestrating dependent file uploads with AWS Step Functions * Introducing faster polling scale-up for AWS Lambda functions configured with Amazon SQS * Scaling improvements when processing Apache Kafka with AWS Lambda * Introducing the Amazon Linux 2023 runtime for AWS Lambda * Enhanced Amazon CloudWatch metrics for Amazon EventBridge * The serverless attendee’s guide to AWS re:Invent 2023 * Introducing logging support for Amazon EventBridge Pipes * Converting Apache Kafka events from Avro to JSON using EventBridge Pipes * Node.js 20.x runtime now available in AWS Lambda * Managing AWS Lambda runtime upgrades * Introducing AWS Step Functions redrive to recover from failures more easily * Triggering AWS Lambda function from a cross-account Amazon Managed Streaming for Apache Kafka * Introducing the AWS Integrated Application Test Kit (IATK) * Introducing advanced logging controls for AWS Lambda functions * Introducing support for read-only management events in Amazon EventBridge
December * Python 3.12 runtime now available in AWS Lambda * Introducing Amazon MQ cross-Region data replication for ActiveMQ brokers
Serverless container blog posts October * Start Spring Boot applications faster on AWS Fargate using SOCI * PBS speeds deployment and reduces costs with AWS Fargate * Scale to 15,000+ tasks in a single Amazon Elastic Container Service (ECS) cluster * Run time sensitive workloads on ECS Fargate with clock accuracy tracking
November * A deep dive into Amazon ECS task health and task replacement * Securing API endpoints using Amazon API Gateway and Amazon VPC Lattice * Serverless containers at AWS re:Invent 2023 * Migration considerations – Cloud Foundry to Amazon ECS with AWS Fargate * Build Generative AI apps on Amazon ECS for SageMaker JumpStart * How Smartsheet optimized cost and performance with AWS Graviton and AWS Fargate
December * AWS App Runner improves performance for image-based deployments * Use SMB storage with Windows containers on AWS Fargate * A deep dive into resilience and availability on Amazon Elastic Container Service * Run Monte Carlo simulations at scale with AWS Step Functions and AWS Fargate * Effective use: Amazon ECS lifecycle events with Amazon CloudWatch Logs Insights
Serverless Office Hours October * Oct 3 – Governance in depth for serverless apps * Oct 10 – Serverless observability * Oct 17 – Super serverless tools with Lars Jacobsson * Oct 24 – Building GenAI apps * Oct 31 – Visually build AWS applications
November * Nov 7 – Bring chaos into serverless * Nov 14 – Ampt: Just write code! * Nov 21 – pre:Invent 2023
December * Dec 5 – Step Functions: what’s new * Dec 19 – 2023 Year in review
Containers from the Couch October * Oct 12 – Introducing ContainersOnAWS.com * Oct 26 – Amazon ECS Console v2 updates
November * Nov 9 – ECS Builder Series – John Mille (Sainsbury’s) * Nov 16 – Diving into Finch 1.0
December * Dec 15 – Cost optimization on AWS Fargate
FooBar October * Oct 5 – Build Applications with Bedrock and Lambda * Oct 12 – Kinesis Data Streams and Lambda in production – What to do when something fails * Oct 26 – Build applications with generative AI and Serverless – Amazon Bedrock and AWS Lambda Node.js
November * Nov 2 – Lambda response streaming | get faster responses from AWS Lambda * Nov 9 – Stream responses back from Bedrock using Lambda response streaming
December * Dec 7 – Build generative AI apps using AWS Step Functions and Amazon Bedrock * Dec 14 – Test State API for Step Functions * Dec 21 – Invoke external endpoints from AWS Step Functions
Still looking for more? The Serverless landing page has more information. The Lambda resources page contains case studies, webinars, whitepapers, customer stories, reference architectures, and even more Getting Started tutorials.
You can also follow the Serverless Developer Advocacy team on Twitter to see the latest news, follow conversations, and interact with the team.
| * James Beswick: @jbesw * Eric Johnson: @edjgeek * Ben Smith: @benjamin_l_s * Julian Wood: @julian_wood * Marcia Villalba: @mavi888uy * David Boyne: @boyney123 | * Jeramiah Dooley @jdooley_clt * Jessica Deen @jldeen * Kyle Davis @linux_mclinuxface * Maish Saidel-Keesing @maishsk * Nathan Peck @nathanpeck * Olly Pomeroy @oliver-p * Scott Coulton @scottcoulton |
And finally, visit the Serverless Land and Containers on AWS websites for all your serverless and serverless container needs.
This post is written by Alejandro Gil, Solutions Architect and Joseba Echevarría, Solutions Architect.
Introduction The purpose of this blog post is to compare video encoding performance between CPUs and Nvidia GPUs to determine the price/performance ratio in different scenarios while highlighting where it would be best to use a GPU.
Video encoding plays a critical role in modern media delivery, enabling efficient storage, delivery, and playback of high-quality video content across a wide range of devices and platforms.
Video encoding is frequently performed solely by the CPU because of its widespread availability and flexibility. Still, modern hardware includes specialized components designed specifically to obtain very high performance video encoding and decoding.
Nvidia GPUs, such as those found in the P and G Amazon EC2 instances, include this kind of built-in hardware in their NVENC (encoding) and NVDEC (decoding) accelerator engines, which can be used for real-time video encoding/decoding with minimal impact on the performance of the CPU or GPU.
Figure 1: NVIDIA NVDEC/NVENC architecture. Source https://developer.nvidia.com/video-codec-sdk
Scenario Two main transcoding job types should be considered depending on the video delivery use case, 1) batch jobs for on demand video files and 2) streaming jobs for real-time, low latency use cases. In order to achieve optimal throughput and cost efficiency, it is a best practice to encode the videos in parallel using the same instance.
The utilized instance types in this benchmark can be found in figure 2 table (i.e g4dn and p3). For hardware comparison purposes, the p4d instance has been included in the table, showing the GPU specs and total number of NVDEC & NVENC cores in these EC2 instances. Based on the requirements, multiple GPU instances types are available in EC2.
| Instance size | GPUs | GPU model | NVDEC generation | NVENC generation | NVDEC cores/GPU | NVENC cores/GPU | | g4dn.xlarge | 1 | T4 | 4th | 7th | 2 | 1 | | p3.2xlarge | 1 | V100 | 3rd | 6th | 1 | 3 | | p4d.24xlarge | 8 | A100 | 4th | N/A | 5 | 0 |
Figure 2: GPU instances specifications
Benchmark In order to determine which encoding strategy is the most convenient for each scenario, a benchmark will be conducted comparing CPU and GPU instances across different video settings. The results will be further presented using graphical representations of the performance indicators obtained.
The benchmark uses 3 input videos with different motion and detail levels (still, medium motion and high dynamic scene) in 4k resolution at 60 frames per second. The tests will show the average performance for encoding with FFmpeg 6.0 in batch (using Constant Rate Factor (CRF) mode) and streaming (using Constant Bit Rate (CBR)) with x264 and x265 codecs to five output resolutions (1080p, 720p, 480p, 360p and 160p).
The benchmark tests encoding the target videos into H.264 and H.265 using the x264 and x265 open-source libraries in FFmpeg 6.0 on the CPU and the NVENC accelerator when using the Nvidia GPU. The H.264 standard enjoys broad compatibility, with most consumer devices supporting accelerated decoding. The H.265 standard offers superior compression at a given level of quality than H.264 but hardware accelerated decoding is not as widely deployed. As a result, for most media delivery scenarios having more than one video format will be required in order to provide the best possible user experience.
Offline (batch) encoding This test consists of a batch encoding with two different standard presets (ultrafast and medium for CPU-based encoding and p1 and medium presets for GPU-accelerated encoding) defined in the FFmpeg guide.
The following chart shows the relative cost of transcoding 1 million frames to the 5 different output resolutions in parallel for CPU-encoding EC2 instance (c6i.4xlarge) and two types of GPU-powered instances (g4dn.xlarge and p3.2xlarge). The results are normalized so that the cost of x264 ultrafast preset on c6i.4xlarge is equal to one.
Figure 3: Batch encoding performance for CPU and GPU instances.
The performance of batch encoding in the best GPU instance (g4dn.xlarge) shows around 73% better price/performance in x264 compared to the c6i.4xlarge and around 82% improvement in x265.
A relevent aspect to have in consideration is that the presets used are not exactly equivalent for each hardware because FFmpeg uses different operators depending on where the process runs (i.e CPU or GPU). As a consequence, the video outputs in each case have a noticeable difference between them. Generally, NVENC-based encoded videos (GPU) tend to have a higher quality in H.264, whereas CPU outputs present more encoding artifacts. The difference is more noticeable for lower quality cases (ultrafast/p1 presets or streaming use cases).
The following images compare the output quality for the medium motion video in the ultrafast/p1 and medium presets.
It is clearly seen in the following example, that the h264_nevenc (GPU) codec outperforms the libx264 codec (CPU) in terms of quality, showing less pixelation, especially in the ultrafast preset. For the medium preset, although the quality difference is less pronounced, the GPU output file is noticeably larger (refer to Figure 6 table).
Figure 4: Result comparison between GPU and CPU for h264, ultrafast
Figure 5: Result comparison between GPU and CPU for h264, medium
The output file sizes mainly depend on the preset, codec and input video. The different configurations can be found in the following table.
Figure 6: Sizes for output batch encoded videos. Streaming not represented because the size is the same (fixed bitrate)
Live stream encoding For live streaming use cases, it is useful to measure how many streams a single instance can maintain transcoding to five output resolutions (1080p, 720p, 480p, 360p and 160p). The following results are the relative cost of each instance, which is the ratio of number of streams the instance was able to sustain divided by the cost per hour.
Figure 6: Streaming encoding performance for CPU and GPU instances.
The previous results show that a GPU-based instance family like g4dn is ideal for streaming use cases, where they can sustain up to 4 parallel encodings from 4K to 1080p, 720p, 480p, 360p & 160p simultaneously. Notice that the GPU-based p5 family performance is not compensating the cost increase.
On the other hand, the CPU-based instances can sustain 1 parallel stream (at most). If you want to sustain the same number of parallel streams in Intel-based instances, you’d have to opt for a much larger instance (c6i.12xlarge can almost sustain 3 simultaneous streams, but it struggles to keep up with the more dynamic scenes when encoding with x265) with a much higher cost ($2.1888 hourly for c6i.12xlarge vs $0.587 for g4dn.xlarge).
The price/performance difference is around 68% better in GPU for x264 and 79% for x265.
Conclusion The results show that for the tested scenarios there can be a price-performance gain when transcoding with GPU compared to CPU. Also, GPU-encoded videos tend to have an equal or higher perceived quality level to CPU-encoded counterparts and there is no significant performance penalty for encoding to the more advanced H.265 format, which can make GPU-based encoding pipelines an attractive option.
Still, CPU-encoders do a particularly good job with containing output file sizes for most of the cases we tested, producing smaller output file sizes even when the perceived quality is simmilar. This is an important aspect to have into account since it can have a big impact in cost. Depending on the amount of media files distributed and consumed by final users, the data transfer and storage cost will noticeably increase if GPUs are used. With this in mind, it is important to weight the compute costs with the data transfer and storage costs for your use case when chosing to use CPU or GPU-based video encoding.
One additional point to be considered is pipeline flexibility. Whereas the GPU encoding pipeline is rigid, CPU-based pipelines can be modified to the customer’s needs, including additional FFmpeg filters to accommodate future needs as required.
The test did not include any specific quality measurements in the transcoded images, but it would be interesting to perform an analysis based on quantitative VMAF (or similar algorithm) metrics for the videos. We always recommend to make your own test to validate if the results obtained meet your requirements.
Benchmarking method This blog post extends on the original work described in Optimized Video Encoding with FFmpeg on AWS Graviton Processors and the benchmarking process has been maintained in order to preserve consistency of the benchmark results. The original article analyzes in detail the price/performance advantages of AWS Graviton 3 compared to other processors.
Figure 7: Batch encoding workflow
This blog post is written by Jose Guay, Technical Account Manger, Enterprise Support.
A typical option to reduce costs associated with running Amazon Elastic Compute Cloud (Amazon EC2) instances is to stop them when they are idle. However, there are scenarios where stopping an idle instance is not practical. For example, instances with development environments that take time to prepare and run which benefit from not needing to do this process every day. For these instances, hibernation is a better alternative.
This blog post explores a solution that will find idle instances using an Amazon CloudWatch alarm that monitors the instance’s CPU usage. When the CPU usage consistently drops below the alarm’s threshold, the alarm enters the ALARM state and raises an event used to identify the instance and trigger hibernation.
With this solution, the instance no longer incurs in compute costs, and only accrues storage costs for any Amazon Elastic Block Store (Amazon EBS) volumes.
Overview To hibernate an EC2 instance, there are prerequisites and required preparation. The instance must be configured to hibernate, and this is done when first launching it. This configuration cannot be changed after launching the instance.
One way to trigger instance hibernation is to use an AWS Lambda function. The Lambda function needs specific permissions configured with AWS Identity and Access Management (IAM). To connect the function with the alarm that detects the idle instance, use an Amazon EventBridge bus.
The following architecture diagram shows a solution.
Figure 1 – Solution architecture
- An EC2 instance sends metrics to CloudWatch.
- A CloudWatch alarm detects an idle instance and sends the event to EventBridge.
- EventBridge triggers a Lambda function.
- The Lambda function evaluates the execution role permissions.
- The Lambda function identifies the instance and sends the hibernation signal.
To implement the solution, follow these steps:
- Configure permissions with IAM
- Create the Lambda function
- Configure the EC2 instance to send metrics to CloudWatch
- Configure EventBridge
a. Configure permissions with IAM Create an IAM role with permissions to stop an EC2 instance. The Lambda function uses it as its execution role. The IAM role also needs permissions to save logs in CloudWatch. This is useful to log when an instance is entering hibernation.
- Open the IAM console.
- In the navigation pane, choose Policies.
- Select Create policy.
- For Select a service, search and select CloudWatch Logs.
- In Actions allowed, search “createlog” and select CreateLogStream and CreateLogGroup.
- Repeat the search, this time for “putlog”, and select PutLogEvents.
- In Resources, choose All.
- Select + Add more permissions.
- For Select a service, select EC2.
- In Actions allowed, search “stop” and select StopInstances from the results.
- In Resources, choose Specific, and select the Add Arn
- From the pop-up window select Resource in this account, type the region where the instance is, and the instance ID. This forms the ARN of the instances to monitor.
- Select Add ARNs.
- Select Next.
- Name the policy AllowHibernateEC2InstancePolicy.
Figure 2 – IAM policy to access EC2 instances and CloudWatch logs
Figure 3 – Viewing the IAM policy in JSON format
- In the navigation page, select Roles.
- Select Create role.
- For Trusted entity type, select AWS Service.
- For Use case, select Lambda.
- Select Next.
- In the Permissions policies list, search and select Allow HibernateEC2InstancePolicy.
- Select Next.
- Name the role AllowHibernateEC2InstanceFromLambdaRole.
- Select Create role.
Figure 4 – IAM role implementing the IAM policy
b. Create the Lambda function Create a Lambda function that will find the ID of the idle instance using the event data from the CloudWatch alarm to hibernate it. The event data will be in a function parameter.
The event data is in the JSON format. The following is an example of what this data looks like.
{"version": "0","id": "77b0f9cf-ebe3-3893-f60e-1950d2b8ef26","detail-type": "CloudWatch Alarm State Change","source": "aws.cloudwatch","account": "<account>","time": "2023-08-10T21:27:58Z","region": "us-east-1","resources": ["arn:aws:cloudwatch:<region>:<account>:alarm:alarm-name"],"detail": {"alarmName": "alarm-name","state": {"value": "ALARM","reason": "TEST","timestamp": "2023-07-05T21:27:58.659+0000"},"previousState": {"value": "OK","reason": "Unchecked: Initial alarm creation","timestamp": "2023-07-05T21:13:51.658+0000"},"configuration": {"metrics": [{"id": "26c493f3-c295-4454-ff19-70ce482dca64","metricStat": {"metric": {"namespace": "AWS/EC2","name": "CPUUtilization","dimensions": {"InstanceId": "<instance id>"}},"period": 300,"stat": "Average"},"returnData": true}],"description": "Created from EC2 Console"}}}
Follow these steps to create the Lambda function.
- Open the Functions page of the Lambda console.
- Choose Create function.
- Select Author from scratch.
- Name the function HibernateEC2InstanceFunction.
- For the Runtime, select Python 3.10 (or the latest Python version).
- For Architecture, choose arm64.
- Expand Change default execution role and select Use an existing role.
- Select AllowHibernateEC2InstanceFromLambdaRole from the list of existing roles.
- Select Create function at the bottom of the page.
In the Lambda function page, scroll down to view the Code tab at the bottom. Copy the following code onto the editor for the lambda_function.py file.
import boto3def lambda_handler(event, context): instancesToHibernate = [] region = getRegion(event) ec2Client = boto3.client('ec2', region_name=region) id = getInstanceId(event) if id is not None: instancesToHibernate.append(id) ec2Client.stop_instances(InstanceIds=instancesToHibernate, Hibernate=True) print('stopped instances: ' + str(instancesToHibernate) + ' in region ' + region) else: print('No instance id found')def getRegion(payload): if 'region' in payload: region = payload['region'] return region #default to N. Virginia return 'us-east-1'def getInstanceId(payload): if 'detail' in payload: detail = payload['detail'] if 'configuration' in detail: configuration = detail['configuration'] if 'metrics' in configuration: if len(configuration['metrics']) > 0: firstMetric = configuration['metrics'][0] if 'metricStat' in firstMetric: metricStat = firstMetric['metricStat'] if 'metric' in metricStat: metric = metricStat['metric'] if 'dimensions' in metric: dimensions = metric['dimensions'] if 'InstanceId' in dimensions: id = dimensions['InstanceId'] return id return None
Figure 5 – Lambda function code editor
The code has the following contents:
- Imports section. In this section, import the libraries that the function uses. In our case, the boto3
- The main method, called
lambda_handler, is the execution entry point. This is the method called whenever the Lambda function runs.- It defines an array to store the IDs of the instances that enter hibernation. This is necessary because the method
stop_instancesexpects an array as opposed to a single value. - Using the event data, it finds the AWS Region and instance ID of the instance to hibernate.
- It initializes the Amazon EC2 client by calling the client method.
- If it finds an instance ID, then it adds it to the instances array.
- Calls
stop_instancespassing as parameters the instances array and True to indicate the hibernation operation.
- It defines an array to store the IDs of the instances that enter hibernation. This is necessary because the method
c. Configure the EC2 instance to send metrics to CloudWatch In the scenario, an idle EC2 instance has its CPU utilization under 10% during a 15-minute period. Adjust the utilization percentage and/or period to meet your needs. To enable alarm tracking, the EC2 instance must send the CPU Usage metric to CloudWatch.
- Open the Amazon EC2 console.
- In the navigation pane, choose Instances.
- Select an instance to monitor with the checkbox on the left.
- Find the Alarm status column, and select the plus sign to add a new alarm.
Figure 6 – Creating a new CloudWatch alarm from the EC2 console
- In the Manage CloudWatch alarms page, select Create an alarm. Then, turn off Alarm action. Use Alarm notification to notify when hibernating an instance, otherwise, turn off.
Figure 7 – CloudWatch alarm notification and action settings
- In the Alarm thresholds section, select:
- Group samples by Average.
- Type of data to sample CPU utilization.
- Alarm when less than (<).
- Percent 10.
- Consecutive periods 1.
- Period 15 Minutes.
- Alarm name Idle-EC2-Instance-LessThan10Pct-CPUUtilization-15Min.
Figure 8 – CloudWatch alarm thresholds
- Select Create at the bottom of the page.
- A successful creation shows a green banner at the top of the page.
- Select the Alarm status column for the instance, then select the link that shows in the pop-up window to go to the new CloudWatch alarm details.
Figure 9 – Accessing the CloudWatch alarm from the EC2 console
- Scroll down to view the alarm details and copy its ARN, which shows in the lower right corner. The EventBridge rule needs this.
Figure 10 – Finding the CloudWatch alarm ARN
d. Configure EventBridge to consume events from CloudWatch When the alarm enters the ALARM state, it means it has detected an idle EC2 instance. It will then generate an event that EventBridge can consume and act upon. For this, EventBridge uses rules. EventBridge rules rely on patterns to identify the events and trigger the appropriate actions.
- Open the Amazon EventBridge console.
- In the navigation pane, choose Rules.
- Choose Create rule.
- Enter a name and description for the rule. A rule cannot have the same name as another rule in the same Region and on the same event bus.
- For Event bus, choose an event bus to associate with this rule. To match events that come from the same account, select AWS default event bus. When an AWS service in the account emits an event, it always goes to the account’s default event bus.
- For Rule type, choose Rule with an event pattern.
- Select Next.
- For Event source, choose AWS services.
- Scroll down to Creation method and select Custom pattern (JSON editor).
- Enter the following pattern on the Event Pattern
{ "source": ["aws.cloudwatch"], "detail-type": ["CloudWatch Alarm State Change"], "detail": { "state": { "value": ["ALARM"] }, "resources":[ "<ARN of CW alarms to respond to>" ] }}
11. In the resources element of the pattern, add the ARN of the CloudWatch alarm created for the EC2 instance. The resources element is an array. Add the ARN of every alarm to which this rule monitors and responds. Doing this allows using a single rule to handle the same action for multiple alarms.
12. Select Next.
13. Select a target. This is the action that EventBridge executes once it has identified an event. Choose AWS service and select Lambda function.
14. Select HibernateEC2InstanceFunction.
15. Select Next.
16. Add tags to the rule as needed.
17. Select Next.
18. Review the rule configuration, and select Create rule.
Figure 11 – EventBridge rule event pattern
Figure 12 – EventBridge rule targets
Testing the implementation To test the solution, wait for the instance’s CPU utilization to fall below the 10% threshold for 15 minutes. Alternatively, force the alarm to enter the ALARM state with the following AWS CLI command.
aws cloudwatch set-alarm-state --alarm-name
 "Idle-EC2-Instance-LessThan10Pct-CPUUtilization-15Min"
 --state-value ALARM --state-reason "testing"
Conclusion Hibernating EC2 instances brings savings during periods of low utilization. Another benefit is that when they start again, they continue their work from where they left off. To hibernate the instance, set the hibernation configuration when launching it. Detect the idle instance with a CloudWatch alarm, and use EventBridge to capture the alarms and trigger a Lambda function to call the Amazon EC2 stop API with the hibernate parameter.
To learn more * Amazon EC2 User Guide for Linux Instances * Amazon EC2 User Guide for Windows Instances * Hibernate your On-Demand Linux instance * Hibernate your On-Demand Windows instance * AWS Lambda Developer Guide * Amazon CloudWatch User Guide * Amazon EventBridge User Guide * AWS Identity and Access Management (IAM) User Guide
This post is written by Dominic Gagné, Senior Software Development Engineer, and Vinodh Kannan Sadayamuthu, Senior Solutions Architect
Amazon MQ now supports cross-Region data replication for ActiveMQ brokers. This feature enables you to build regionally resilient messaging applications and makes it easier to set up cross-Region message replication between ActiveMQ brokers in Amazon MQ. This blog post explains how cross-Region data replication works in Amazon MQ, how to setup cross-Region replica brokers for ActiveMQ, and how to test promoting a replica broker.
Amazon MQ is a managed message broker service for Apache ActiveMQ and RabbitMQ that simplifies setting up and operating message brokers on AWS.
Cross-Region replication improves the resilience and disaster recovery capabilities of your systems. This new Amazon MQ feature makes it easier to increase resilience of your ActiveMQ messaging systems across AWS Regions.
How cross-Region data replication works in Amazon MQ for ActiveMQ The Amazon MQ for ActiveMQ cross-Region data replication feature replicates broker state from the primary broker in one AWS Region to the replica broker in another Region. Broker state consists of messages that have been sent to a broker by a message producer. Additionally, message acknowledgments and transactions are replicated. Scheduled messages and broker XML configuration are not replicated from the primary to the replica broker.
State replication occurs asynchronously and runs in the background. When a message is sent to a cross-Region data replication enabled broker, the data is persisted both to the primary data store and also on a queue used to replicate data. The replica broker acts as a client of this queue and consumes data that represents broker state from the primary broker.
At any given moment, only the primary broker is available for client connections. The replica broker is a hot standby and passively replicates the primary broker’s state. However, it does not accept client connections. The following diagram shows a simplified version of a cross-Region data replication broker pair. All replication traffic is encrypted using TLS and remains within AWS’ private backbone.
Configuring cross-Region replica brokers for Amazon MQ for ActiveMQ To set up a cross-Region replica broker, your Amazon MQ for ActiveMQ primary broker must meet the following eligibility criteria:
- ActiveMQ version 5.17.6 or above
- Instance size m5.large or higher
- Active/standby broker deployment enabled
- Be in the Running state
If you do not have an ActiveMQ broker that meets these criteria, see Creating and configuring an ActiveMQ broker for instructions on how to create a primary broker.
To configure cross-Region replication
- Navigate to the Amazon MQ console and choose Create replica broker.
- Select a primary broker from the list of eligible primary brokers and choose Next.
- Under Replica broker details, select the Region for your replica broker and enter a Replica broker name.
- In the ActiveMQ console user for replica broker panel, enter a Username and Password for broker access.
- In the Data replication user to bridge access between brokers panel, enter a replication user Username and Password.
- In the Additional settings panel, keep the defaults and choose Next.
- Review the settings and choose Create replica broker.
Note: The broker access type is automatically set based on the primary broker access type. - The creation process takes up to 25 minutes. Once the replica broker creation is complete, begin replication between the primary and the replica brokers by rebooting the primary broker.
- Once the primary broker is rebooted and its status is Running, you can see the replica details in the Data replication panel of the primary broker.
Both brokers now synchronize with each other to establish an inter-Region network and connection through which broker state is replicated. Once both brokers are in the Running state, the primary broker accepts client connections and passes all broker state changes (messages, acknowledgments, transactions, etc.) to the replica broker.
The replica broker now asynchronously mirrors the state of the primary broker. However, it does not become available for client connections until it is promoted via a switchover or a failover. These operations are covered in the following section.
Testing data replication and promoting the replica broker There are two ways to promote a replica broker: initiating a switchover or a failover.
| Switchover | Failover | | * Prioritizes consistency over availability. | * Prioritizes availability over consistency. | | * Brokers are guaranteed to have identical states. | * Brokers are not guaranteed to be in identical states. | | * Brokers may not be available immediately to serve client traffic. | * Replica broker is immediately available to serve client traffic. |
To initiate a failover or switchover
-
- Navigate to the Amazon MQ console, choose your primary broker, and log in to the ActiveMQ Web Console using the URLs located in the Connections panel.
- In the top menu, select Queues. You should be able to see four
ActiveMQ.Plugin.Replicationqueues used by the replication feature. - To test message replication from the primary to a replica broker, create a queue and send messages. To create the queue:
- For Queue Name, enter TestQueue.
- Choose Create.
- Under Operations for the
TestQueue, choose Send To and perform the following steps:- For Number of messages to send, enter 10 and keep the other defaults.
- Under Message body, enter a test message.
- Choose Send.
- To promote the replica broker, navigate to the Amazon MQ console and change the Region to the AWS Region where the replica broker is located.
- Select the replica broker (in this example called
Secondarybroker) and choose Promote replica. - In the Promote replica broker pop-up window:
- Select Failover or Switchover.
- Enter confirm in text box.
- Choose Confirm.
- While a replica broker is being promoted, its replication status changes to Promotion in progress. The corresponding primary broker’s replication status changes to Demotion in progress.
Replica Secondarybroker status – Promotion in progress:
Primary broker status – Demotion in progress:
Secondarybroker status – Promoted to new primary broker:
- Once the
Secondarybrokerstatus is Running, log in to the ActiveMQ Web Console from the URLs located in the Connections panel. You can see the replicated messages sent from the former primary broker in Step 4 in theTestQueue:
Monitoring cross-Region data replication To monitor cross-Region data replication progress, you can use the Amazon CloudWatch metrics TotalReplicationLag and ReplicationLag.
You can use these two metrics to monitor the progress of a switchover. When their value reaches zero, the switchover will complete because the broker states have been synchronized and the replica broker begins accepting client connections. If the switchover does not progress fast enough, or if you need the replica broker to be immediately available to serve client traffic, you can request a failover at any time.
Note: A failover can interrupt an ongoing switchover. However, a switchover cannot interrupt an ongoing failover.
Issuing a failover request causes the replica broker to become immediately available, but does not provide any guarantees about what data has been replicated to the replica broker. This means that a failover can make data tracking and reconciliation more challenging for your client application than a switchover.
For this reason, we recommend that you always start with a switchover and interrupt it with a failover if necessary. To interrupt an ongoing switchover, follow the same steps as for promoting a replica broker, select the failover option, and confirm.
Note: If you fail back to the original primary broker, messages that are not replicated from the primary to the replica broker during the failover will still exist on the primary broker. Therefore, consumers must manage these messages. We recommend tracking the processed message IDs in a data store such as Amazon DynamoDB global tables and comparing the message to the processed message IDs.
If you no longer need to replicate broker data across Regions or if you need to delete a primary or replica broker, you must unpair the replica broker and reboot the primary broker. You can unpair the replica broker in the Amazon MQ console by following Delete a CRDR broker.
To unpair the broker using the AWS Command Line Interface (AWS CLI), run the following command, replacing the --broker-id with your primary broker ID:
aws mq update-broker --broker-id <primary broker ID> \--data-replication-mode "NONE" \--region us-east-1
Conclusion Using the cross-Region data replication feature for Amazon MQ for ActiveMQ provides a straightforward way to implement cross-Region replication to improve the resilience of your architecture and meet your business continuity and disaster recovery requirements. This post explains how cross-Region data replication works in Amazon MQ, how to set up a cross-Region replica broker, and how to test and promote the replica broker.
For more details, see the Amazon MQ documentation.
For more serverless learning resources, visit Serverless Land.
In November 2022, AWS announced the public preview of AWS Serverless Application Model (AWS SAM) support for HashiCorp Terraform. The public preview introduces a subset of features to help Terraform users test serverless applications locally. Today, AWS is announcing the general availability of Terraform support in AWS SAM. This GA release expands AWS SAM’s feature […]
AWS Step Functions is emerging as a foundational tool for building scalable and distributed serverless applications through workflows. In 2021, the Step Functions team launched Workflow Studio, a low-code visual tool for creating Step Functions workflows in the AWS Management Console. This made workflow building accessible even to those with limited coding experience. In response to […]
This blog post is written by Jared Thompson, Specialist Solutions Architect, Hybrid Edge. Today, we announced AWS Outposts rack support for intra-VPC communication across multiple Outposts. You can now add routes in your Outposts rack subnet route table to forward traffic between subnets within the same VPC spanning across multiple Outposts using the Outpost local […]
In this blog post, you learn how you can securely share files with authorized external parties and track their access using AWS serverless services. The sample application presented uses Step Functions to allow you to extend and customize the workflows to meet your use case requirements.
This blog post is written by Jared Novotny & Tareq Rajabi, Specialist Hybrid Edge Solution Architects. The AWS Snow family of products are purpose-built devices that allow petabyte-scale movement of data from on-premises locations to AWS Regions. Snow devices also enable customers to run Amazon Elastic Compute Cloud (Amazon EC2) instances with Amazon Elastic Block […]
This blog post shows how to protect a Lambda Function URL, configured with IAM authentication, using a CloudFront distribution and Lambda@Edge. CloudFront helps protect from DDoS, and the function at the edge adds appropriate headers to the request to authenticate it for Lambda.
This blog post is written by Rob Goodwin, Specialist Solutions Architect, Secure Hybrid Edge. With the announcement of AWS Outposts servers, you now have a streamlined means to deploy AWS Cloud infrastructure to regional offices using the 1 rack unit (1U) or 2 rack unit (2U) Outposts servers where the 42U AWS Outposts rack wasn’t […]
Reliable interservice communication is an important consideration in microservice design, especially when faced with dual writes. Combining the transactional outbox pattern with dual writes provides a robust way of improving message reliability.
This blog post is written by Brian Graf, Senior Developer Advocate, Amazon Lightsail and Sophia Parafina, Senior Developer Advocate. Amazon Lightsail is a virtual private server (VPS) for deploying both operating systems (OS) and pre-packaged applications, such as WordPress, Plesk, cPanel, PrestaShop, and more. When deploying these instances, you can run launch scripts with additional […]
This post is written by Joaquin Rinaudo, Principal Security Consultant and Gezim Musliaj, DevOps Consultant. IBM MQ is a message-oriented middleware (MOM) product used by many enterprise organizations, including global banks, airlines, and healthcare and insurance companies. Customers often ask us for guidance on how they can integrate their existing on-premises MOM systems with new […]
This blog post is written by Mike Lim, Senior Public Sector SA. Video editing, professional visualization, and video games can be resource demanding applications that require high performance Windows workstations with GPUs. When developing these resource demanding applications, a high-performance remote display protocol is desirable in order to access the instances’ graphical desktops from the […]
Lambda response streaming can improve the TTFB for web pages. With the support of AWS Lambda Web Adapter, developers can more easily package web applications that support Lambda response streaming, enhancing the user experience and performance metrics of their web applications.
Amazon EventBridge Scheduler now supports configuring automatic deletion of schedules after completion. Now you can configure one-time and recurring schedules with an end date to be automatically deleted upon completion to avoid managing individual schedules. Amazon EventBridge Scheduler allows you to create, run, and manage schedules on scale. Using EventBridge Scheduler, you can schedule millions […]
You can build and deploy functions using Python 3.11 using the AWS Management Console, AWS CLI, AWS SDK, AWS SAM, AWS CDK, or your choice of Infrastructure as Code (IaC). You can also use the Python 3.11 container base image if you prefer to build and deploy your functions using container images.
Lambda is deprecating the go1.x runtime in line with Amazon Linux 1 end-of-life, scheduled for December 31, 2023. Customers using Go with Lambda should migrate their functions to the provided.al2 runtime. Benefits include support for AWS Graviton2 processors with better price-performance, and a streamlined invoke path with faster performance.
This post is written by Madhav Vishnubhatta, Senior Technical Account Manager, Enterprise Support. This blog post explains how to implement patterns in AWS Step Functions that control the break out of a parallel state as soon as a minimum requirement is met. The parallel state usually completes only when all the parallel flows inside it […]
This post is written by Yahav Biran, Principal SA, and Yuval Dovrat, Israel/Iberia Head Compute SAs. Introduction Deploying applications on a mixed CPUs architecture allows for a wider selection of available Amazon Elastic Compute Cloud (Amazon EC2) capacity pools. This enhances your applications’ resiliency, optimizes your costs, and enables a seamless transition between architectures. Using […]
When building event-driven applications, consider whether you can replace application code with serverless integration services to improve the resilience of your application and provide a clean separation between application logic and system dependencies.
This post is written by Pawan Puthran, Principal Serverless Specialist TAM, Aneel Murari, Senior Serverless Specialist Solution Architect, and Shree Shrikhande, Senior AWS Lambda Product Manager. AWS Lambda is announcing a recursion control to detect and stop Lambda functions running in a recursive or infinite loop. At launch, this feature is available for Lambda integrations […]
This blog explains three key throttle limits applied on Lambda invokes: the concurrency limit, TPS limit and burst limit. It outlines the relationship between these limits and how each one protects the system and your workload from noisy neighbors. Equipped with this knowledge you can better interpret any 429 throttling exceptions you may receive while scaling your applications on Lambda.
This blog post is written by Paco Gonzalez Senior EMEA IoT Specialist SA. AWS Nitro Enclaves offers an isolated, hardened, and highly constrained environment to host security-critical applications. Think of AWS Nitro Enclaves as regular Amazon Elastic Compute Cloud (Amazon EC2) virtual machines (VMs) but with the added benefit of the environment being highly constrained. […]
This post is written by Jeff Chen, Principal Cloud Application Architect, and Jeff Li, Senior Cloud Application Architect Event-driven architectures are an architecture style that can help you boost agility and build reliable, scalable applications. Splitting an application into loosely coupled services can help each service scale independently. A distributed, loosely coupled application depends on […]
Welcome to the 22nd edition of the AWS Serverless ICYMI (in case you missed it) quarterly recap. Every quarter, we share all the most recent product launches, feature enhancements, blog posts, webinars, live streams, and other interesting things that you might have missed! In case you missed our last ICYMI, check out what happened last […]
This blog post is written by Ruchi Nigam, Senior Cloud Support Engineer and Sumit Menaria, Senior Hybrid SA. AWS Local Zones are a type of infrastructure deployment that places compute, storage, database, and other select AWS services close to large population and industry centers. With Local Zones close to large population centers in metro areas, […]
This post is written by Andrea Amorosi, Senior Solutions Architect and Pascal Vogel, Solutions Architect. When building serverless applications using AWS Lambda, you often need to retrieve parameters, such as database connection details, API secrets, or global configuration values at runtime. You can make these parameters available to your Lambda functions via secure, scalable, and […]
This blog is written by Chetan Makvana, Senior Solutions Architect and Hardik Vasa, Senior Solutions Architect. This is the third part of a three-part blog post series that demonstrates best practices for Amazon Simple Queue Service (Amazon SQS) using the AWS Well-Architected Framework. This blog post covers best practices using the Performance Efficiency Pillar, Cost […]
This blog is written by Chetan Makvana, Senior Solutions Architect and Hardik Vasa, Senior Solutions Architect. This is the second part of a three-part blog post series that demonstrates implementing best practices for Amazon Simple Queue Service (Amazon SQS) using the AWS Well-Architected Framework. This blog post covers best practices using the Security Pillar and […]
This blog is written by Chetan Makvana, Senior Solutions Architect and Hardik Vasa, Senior Solutions Architect. Amazon Simple Queue Service (Amazon SQS) is a fully managed message queuing service that makes it easy to decouple and scale microservices, distributed systems, and serverless applications. AWS customers have constantly discovered powerful new ways to build more scalable, […]
Serverless developers are looking for the most efficient way to test their applications in the AWS Cloud. They want to invoke an AWS Lambda function quickly without having to mock security, external services, or other environment variables. This blog shows how to use the new AWS SAM remote invoke feature to do just that.
This post is written by Peter Smith, Principal Engineer for AWS Step Functions This blog post explains the new versions and aliases feature in AWS Step Functions, allowing you to run specific revisions of the state machine instead of always using the latest. This allows for more reliable deployments that help control risk, and provide […]
This post is written by Enrico Liguori, Networking Solutions Architect, Hybrid Cloud and Sumeeth Siriyur, Sr. Hybrid Cloud Solutions Architect. AWS Outposts is a fully managed service that brings the same AWS infrastructure, services, APIs, and tools to virtually any data center, colocation space, manufacturing floor, or on-premises facility where it might be needed. With Outposts, […]
This blog post is written by Ariana Rahgozar, Solutions Architect, and Kenneth Kitts, Sr. Technical Account Manager, AWS. Imagine trying to connect to an Amazon Elastic Compute Cloud (Amazon EC2) instance within your Amazon Virtual Private Cloud (Amazon VPC) over the Internet. Typically, you’d first have to connect to a bastion host with a public […]
This blog post is written by Sarath Krishnan, Senior Solutions Architect and Navdeep Singh, Senior Customer Solutions Manager. Amazon CTO Werner Vogels famously said, “everything fails all the time.” Designing your systems for failure is important for ensuring availability, scalability, fault tolerance and business continuity. Resilient systems scale with your business demand changes, prevent data […]
Get started building with Ruby 3.2 today by making necessary changes for compatibility with Ruby 3.2, and specifying a runtime parameter value of ruby3.2 when creating or updating your Lambda functions.
This post is written by Heeki Park, Principal Solutions Architect, Sachin Doshi, Senior Application Architect, and Jason Enderle, Senior Solutions Architect.
Amazon API Gateway enables developers to create private REST APIs that can only be accessed from within a Virtual Private Cloud (VPC). Traffic to the private API is transmitted over secure connections and stays within the AWS network and specifically within the customer’s VPC, protecting it from the public internet. This approach can be used to address a customer’s regulatory or security requirements by ensuring the confidentiality of the transmitted traffic. This makes private API Gateway endpoints suitable for publishing internal APIs, such as those used by microservices and data APIs.
In microservice architectures, teams often build and manage components in separate AWS accounts and prefer to access those private API endpoints using company-specific custom domain names. Custom domain names serve as an alias for a hostname and path to your API. This makes it easier for clients to connect using an easy-to-remember vanity URL and also maintains a stable URL in case the underlying API endpoint URL changes. Custom domain names can also improve the organization of APIs according to their functions within the enterprise. For example, the standard API Gateway URL format: “https://api-id.execute-api.region.amazonaws.com/stage” can be transformed into “https://api.private.example.com/myservice”.
Overview
This blog post builds on documentation that covers frontend invokes of private endpoints and backend integration patterns and two previously published blog posts.
The first blog post that helps you consume private API endpoints from API Gateway, using a VPC-enabled Lambda function and a container-based application using mTLS. The second post helps you implement private backend integrations to your API microservices that are deployed using AWS Fargate or Amazon EC2. This post extends these, enabling you to simplify access to your API endpoints by implementing custom domain names for private endpoints using an NGINX reverse proxy.
This solution uses NGINX because it acts as a high-performance intermediary, enabling the efficient forwarding of traffic within a private network. A configuration mapping file associates your custom domain with the corresponding private endpoint across AWS accounts. This configuration mapping file can then be source controlled and used for governed deployments into your lower and production environments.
The following diagram illustrates the interactions between the components and the path for an API request. In this use case, a shared services account (Account A) is responsible for centrally managing the mappings of custom domains and creating an AWS PrivateLink connection to private API endpoints in provider accounts (Account B and Account C).
- A request to the API is made using a private custom domain from within a VPC or another device that is able to route to the VPC. For example, the request might use the domain https://api.private.example.com.
- An alias record in Amazon Route 53 private hosted zone resolves to the fully qualified domain name of the private Elastic Load Balancing (ELB). The ELB can be configured to be either a Network Load Balancer (NLB) or an Application Load Balancer (ALB).
- The ELB uses an AWS Certificate Manager (ACM) certificate to terminate TLS (Transport Layer Security) for corresponding custom private domain.
- The ELB listener redirects requests to an associated ELB target group, which in turn forwards the request to an Amazon Elastic Container Service task running on AWS Fargate.
- The Fargate service hosts a container based on NGINX that acts as a reverse proxy to the private API endpoint in one or more provider accounts. The Fargate service is configured to scale using a metric that tracks CPU utilization automatically.
- The Fargate task, forwards traffic to the appropriate private endpoints in provider Account B or Account C through a PrivateLink VPC Endpoint.
- The API Gateway resource policy limits access to the private endpoints based on a specific VPC endpoint, HTTP verbs, and source domain used to request the API.
The solution passes any additional information found in headers from upstream calls, such as authentication headers, content type headers, or custom data headers unmodified to private endpoints in provider accounts (Account B and Account C).
Prerequisites
To use custom domain names, you need two components: a TLS certificate and a DNS alias. This example uses ACM for managing the TLS certificate and Route 53 for creating the DNS alias.
ACM offers various options for integrating a TLS certificate, such as:
- Importing an existing TLS certificate into ACM.
- Requesting a TLS certificate in ACM with Email-based validation.
- Requesting a TLS certificate in ACM with DNS-based validation.
- Requesting a TLS certificate from ACM using your Organization’s Private CA in AWS.
The following diagram illustrates the benefits and drawbacks associated with each option.
This solution uses DNS-based validation (option #3) to request TLS certificates from ACM. It is assumed that a public hosted zone with a registered root domain (such as example.com) is already deployed in the target account. The solution then uses ACM to validate ownership of the domain names specified in the configuration mapping file during deployment.
With a deployed public hosted zone, private child domains (such as api.private.example.com) can be deployed using DNS validation, which enables infrastructure as code (IaC) deployment to automate certificate validation during deployment of the solution. Additionally, DNS-based validation automatically renews the ACM certificate before it expires.
This solution requires the presence of specific VPC endpoints, namely execute-api, logs, ecr.dkr, ecr.api, and Amazon S3 gateway in a shared services account (Account A). Enabling private DNS on the execute-api VPC endpoint is optional and is not a requirement of the solution. Some customers may choose not to enable private DNS on the execute-api VPC endpoint, as this then allows applications within the VPC to reach the private API endpoints through the NGINX reverse proxy but also resolve public API Gateway endpoints.
Deploying the example
You can use the example AWS Cloud Development Kit (CDK) or Terraform code available on GitHub to deploy this pattern in your own account.
This solution uses a YAML-based configuration mapping file to add, update, or delete a mapping between a custom domain and a private API endpoint. During deployment, the automated infrastructure as code (IaC) script parses the provided YAML file and does the following:
- Create an NGINX configuration file.
- Apply the NGINX configuration file to the standard NGINX container image.
- Parses the mapping file and creates necessary Route 53 private hosted zones in Account A.
- Creates wildcard-based SSL certificates (such as *.example.com) in Account A. ACM validates these certificates using its respective public hosted zone (such as example.com) and attaches them to the ELB listener. By default, an ELB listener supports up to 25 SSL certificates. Wildcards are used to secure an unlimited number of subdomains, making it easier to manage and scale multiple subdomains.
Description of mapping file fields
| Property | Required | Example Values | Description |
| CUSTOM\_DOMAIN\_URL | true | api.private.example.com | Desired custom URL for private API. |
| PRIVATE\_API\_URL | true | https://a1b2c3d4e5.execute-api.us-east-1.amazonaws.com/dev/path1/path2 | Execution URL of targeted private endpoint |
| VERBS | false | [“GET”,” POST”, “PUT”, “PATCH”, “DELETE”, “HEAD”, “OPTIONS”] | This property would be used to create API Gateway resource policies. You can provide one or more verbs as a comma separated list. If this property is not provided, all verbs are permitted. |
Using API Gateway resource policies for private endpoints
To allow access to private endpoints from your VPCs or from VPCs in another account, you must implement a resource policy. Resource policies can be used to restrict access based on specific criteria such as VPC endpoints, API paths, and API verbs. To enable this functionality, follow these steps:
- Complete the infrastructure as code (IaC) deployment.
- Create or update an API Gateway resource policy in the provider accounts (such as Account B and Account C). This policy should include the VPC endpoint id from the shared services account (Account A).
- Deploy your API to apply the changes in provider accounts (such as Account B and Account C).
To update the API Gateway resource policy with code, refer to the documentation and code examples in the GitHub repository.
Deploying updates to the mapping file
To add, update, or delete a mapping between your custom domain and private endpoint, you can update the mapping file and then rerun the deployment using the same steps as before.
Deploying subsequent updates to the mapping file using the existing infrastructure as code pipeline reduces the risk of human error, adds traceability, prevents configuration drift, and allows the deployment process to follow your existing DevOps and governance processes in place.
For example, you could store the configuration mapping file in a separate source control repository and commit each change to that repository. Each change could then trigger a deployment process, which would then check the configuration changes and conduct the appropriate deployment. If required, you could introduce gates to enforce either manual checks or a ticketing process to ensure that change control processes are enforced.
Understanding cost of the solution
Most of the services mentioned in this solution are billed according to usage, which is determined by the number of requests made.
However, there are a few services that incur hourly or monthly costs. These include monthly fees for Route 53 hosted zones, hourly charges for VPC endpoints, Elastic Load Balancing, and the hourly cost of running the NGINX reverse proxy on Fargate. To estimate the cost for these options based on your specific workload, you can utilize the AWS pricing calculator. Here is an example outlining the approximate cost associated with the architecture implemented in this solution.
Conclusion
This blog post demonstrates a solution that allows customers to utilize their private endpoints securely with API Gateway across AWS accounts and within a VPC network by using a reverse proxy with a custom domain name. The solution offers a simplified approach to manage the mapping between private endpoints with API Gateway and custom domain names, ensuring seamless connectivity and security.
For more serverless learning resources, visit Serverless Land.
This blog was written by Sam Wilson, Cloud Application Architect and John Lopez, Cloud Application Architect.
Slack, as an enterprise collaboration and communication service, presents opportunities for builders to improve efficiency through implementing custom-written Slack Applications (apps). One such opportunity is to expose existing AWS resources to your organization without your employees needing AWS Management Console or AWS CLI access.
For example, a member of your data analytics team needs to trigger an AWS Step Functions workflow to reprocess a batch data job. Instead of granting the user direct access to the Step Functions workflow in the AWS Management Console or AWS CLI, you can provide access to invoke the workflow from within a designated Slack channel.
This blog covers how serverless architecture lets Slack users invoke AWS resources such as AWS Lambda functions and Step Functions via the Slack Desktop UI and Mobile UI using Slack apps. Serverless architecture is ideal for a Slack app because of its ability to scale. It can process thousands of concurrent requests for Slack users without the burden of managing operational overhead.
This example supports integration with other AWS resources via Step Functions. Visit the documentation for more information on integrations with other AWS resources.
This post explains the serverless example architecture, and walks through how to deploy the example in your AWS account. It demonstrates the example and discusses constraints discovered during development.
Overview
The code included in this post creates a Slack app built with a variety of AWS serverless services:
- Amazon API Gateway receives all incoming requests from Slack. Step Functions coordinates request activities such as user validation, configuration retrieval, request routing, and response formatting.
- A Lambda Function invokes Slack-specific authentication functionality and sends responses to the Slack UI.
- Amazon EventBridge serves as a pub-sub integration between a request and the request processor.
- Amazon DynamoDB stores permissions for each Slack user to ensure they only have access to resources you designate.
- AWS Systems Manager stores the specific Slack channel where you use the Slack app.
- AWS Secrets Manager stores the Slack app signing secret and bot token used for authentication.
AWS Cloud Development Kit (AWS CDK) deploys the AWS resources. This example can plug into any existing CI/CD platform of your choice.

Architectural overview
- The desktop or mobile Slack user starts requests by using /my-slack-bot slash command or by interacting with a Slack Block Kit UI element.
- API Gateway proxies the request and transforms the payload into a format that the request validator Step Functions workflow can accept.
- The request validator triggers the Slack authentication Lambda function to verify that the request originates from the configured Slack organization. This Lambda function uses the Slack Bolt library for TypeScript to perform request authentication and extract request details into a consistent payload. Also, Secrets Manager stores a signing secret, which the Slack Bolt API uses during authentication.
- The request validator queries the Authorized Users DynamoDB table with the username extracted from the request payload. If the user does not exist, the request ends with an unauthorized response.
- The request validator retrieves the permitted channel ID and compares it to the channel ID found in the request. If the two channel IDs do not match, the request ends with an unauthorized response.
- The request validator sends the request to the Command event bus in EventBridge.
- The Command event bus uses the request’s action property to route the request to a request processor Step Functions workflow.
- Each processor Step Functions workflow may build Slack Block Kit UI elements, send updates to existing UI elements, or invoke existing Lambda functions and Step Functions workflows.
- The Slack desktop or mobile application displays new UI elements or presents updates to an existing request as it is processed. Users may interact with new UI elements to further a request or start over with an additional request.
This application architecture scales for production loads, providing capacity for processing thousands of concurrent Slack users (through the Slack platform itself), bypassing the need for direct AWS Management Console access. This architecture provides for easier extensibility of the chat application to support new commands as consumer needs arise.
Finally, the application’s architecture and implementation follow the AWS Well-Architected guidance for Operational Excellence, Security, Reliability, and Performance Efficiency.
- CDK manages application infrastructure for the Operational Excellence Pillar.
- Secrets Manager and DynamoDB encrypt data at rest for the Security Pillar.
- This architecture scales horizontally with Lambda functions and Step Functions for the Reliability Pillar.
- Serverless architecture removes the need to maintain physical servers for the Performance Efficiency Pillar.
Step Functions is suited for this example because the service supports integrations with many other AWS services. Step Functions allows this example to orchestrate interactions with Lambda functions, DynamoDB tables, and EventBridge event busses with minimal code.
This example takes advantage of Step Functions Express Workflows to support the high-volume, event-driven actions generated by the Slack app. The result of using Express Workflows is a responsive, scalable request processor capable of handling tens of thousands requests per second. To learn more, review the differences between standard and Express Workflows.
The presented example uses AWS Secrets Manager for storing and retrieving application credentials securely. AWS Secrets Manager provides the following benefits:
- Central, secure storage of secrets via encryption-at-rest.
- Ease of access management through AWS Identity and Access Management (IAM) permissions policies.
- Out-of-the-box integration support with all AWS services comprising the architecture
In addition, this example uses the AWS Systems Manager Parameter Store service for persisting our application’s configuration data for the Slack Channel ID. Among the benefits offered by AWS System Manager, this example takes advantage of storing encrypted configuration data with versioning support.
This example features a variety of interactions for the Slack Mobile or Desktop application, including displaying a welcome screen, entering form information, and reporting process status. EventBridge enables this example to route requests from the Request Validator Step Function using the serverless Event Bus and decouple each action from one another. We configure Rules to associate an event to a request processor Step Function.
Walkthrough
As prerequisites, you need the following:
- AWS CDK version 2.19.0 or later.
- Node version 16+.
- Docker-cli.
- Git.
- A personal or company Slack account with permissions to create applications.
- The Slack Channel ID of a channel in your Workspace for integration with the Slack App.

Slack channel details
To get the Channel ID, open the context menu on the Slack channel and select View channel details. The modal displays your Channel ID at the bottom:

Slack bot channel details
To learn more, visit Slack’s Getting Started with Bolt for JavaScript page.
The README document for the GitHub Repository titled, Amazon Interactive Slack App Starter Kit, contains a comprehensive walkthrough, including detailed steps for:
- Slack API configuration
- Application deployment via AWS Cloud Development Kit (CDK)
- Required updates for AWS Systems Manager Parameters and secrets
Demoing the Slack app
- Start the Slack app by invoking the /my-slack-bot slash command.

Start sample Lambda invocation
- From the My Slack Bot action menu, choose Sample Lambda.

Choosing sample Lambda
Choosing sample Lambda
- Enter command input, choose Submit, then observe the response (this input value applies to the sample Lambda function).

Sample Lambda submit

Sample Lambda results
- Start the Slack App by invoking the /my-slack-bot slash command, then select Sample State Machine:

Start sample state machine invocation

Select Sample State Machine
- Enter command input, choose Submit, then observe the response (this input value applies to the downstream state machine)

Sample state machine submit

Sample state machine results
Constraints in this example
Slack has constraints for sending and receiving requests, but API Gateway’s mapping templates provide mechanisms for integrating with a variety of request constraints.
Slack uses application/x-www-form-urlencoded to send requests to a custom URL. We designed a request template to format the input from Slack into a consistent format for the Request Validator Step Function. Headers such as X-Slack-Signature and X-Slack-Request-Timestamp needed to be passed along to ensure the request from Slack was authentic.
Here is the request mapping template needed for the integration:
{ "stateMachineArn": "arn:aws:states:us-east-1:827819197510:stateMachine:RequestValidatorB6FDBF18-FACc7f2PzNAv", "input": "{\"body\": \"$input.path('$')\", \"headers\": {\"X-Slack-Signature\": \"$input.params().header.get('X-Slack-Signature')\", \"X-Slack-Request-Timestamp\": \"$input.params().header.get('X-Slack-Request-Timestamp')\", \"Content-Type\": \"application/x-www-form-urlencoded\"}}"}Slack sends the message payload in two different formats: URL-encoded and JSON. Fortunately, the Slack Bolt for JavaScript library can merge the two request formats into a single JSON payload and handle verification.
Slack requires a 204 status response along with an empty body to recognize that a request was successful. An integration response template overrides the Step Function response into a format that Slack accepts.
Here is the response mapping template needed for the integration:
#set($context.responseOverride.status = 204){}Conclusion
In this blog post, you learned how you can let your organization’s Slack users with the ability to invoke your existing AWS resources with no AWS Management Console or AWS CLI access. This serverless example lets you build your own custom workflows to meet your organization’s needs.
To learn more about the concepts discussed in this blog, visit:
- AWS Lambda Node.js library
- Using TypeScript — Slack Bolt for JavaScript
- AWS Secrets Manager construct library
- Using AWS Step Functions with other services
For more serverless learning resources, visit Serverless Land.
This post is written by Johan Hedlund, Senior Solutions Architect, Enterprise PUMA.
Many customers have successfully migrated business critical legacy workloads to AWS, utilizing services such as Amazon Elastic Compute Cloud (Amazon EC2), Auto Scaling Groups (ASGs), as well as the use of Multiple Availability Zones (AZs), Regions for Business Continuity, and High Availability.
These critical applications require increased levels of availability to meet strict business Service Level Agreements (SLAs), even in extreme scenarios such as when EC2 functionality is impaired (see Advanced Multi-AZ Resilience Patterns for examples). Following AWS best practices such as architecting for flexibility will help here, but for some more rigid designs there can still be challenges around EC2 instance availability.
In this post, I detail an approach for Reserving Capacity for this type of scenario to mitigate the risk of the instance type(s) that your application needs being unavailable, including code for building it and ways of testing it.
Baseline: Multi-AZ application with restrictive instance needs
To focus on the problem of Capacity Reservation, our reference architecture is a simple horizontally scalable monolith. This consists of a single executable running across multiple instances as a cluster in an Auto Scaling group across three AZs for High Availability.

The application in this example is both business critical and memory intensive. It needs six r6i.4xlarge instances to meet the required specifications. R6i has been chosen to meet the required memory to vCPU requirements.
The third-party application we need to run, has a significant license cost, so we want to optimize our workload to make sure we run only the minimally required number of instances for the shortest amount of time.
The application should be resilient to issues in a single AZ. In the case of multi-AZ impact, it should failover to Disaster Recovery (DR) in an alternate Region, where service level objectives are instituted to return operations to defined parameters. But this is outside the scope for this post.
The problem: capacity during AZ failover
In this solution, the Auto Scaling Group automatically balances its instances across the selected AZs, providing a layer of resilience in the event of a disruption in a single AZ. However, this hinges on those instances being available for use in the Amazon EC2 capacity pools. The criticality of our application comes with SLAs which dictate that even the very low likelihood of instance types being unavailable in AWS must be mitigated.
The solution: Reserving Capacity
There are 2 main ways of Reserving Capacity for this scenario: (a) Running extra capacity 24/7, (b) On Demand Capacity Reservations (ODCRs).
In the past, another recommendation would have been to utilize Zonal Reserved Instances (Non Zonal will not Reserve Capacity). But although Zonal Reserved Instances do provide similar functionality as On Demand Capacity Reservations combined with Savings Plans, they do so in a less flexible way. Therefore, the recommendation from AWS is now to instead use On Demand Capacity Reservations in combination with Savings Plans for scenarios where Capacity Reservation is required.
The TCO impact of the licensing situation rules out the first of the two valid options. Merely keeping the spare capacity up and running all the time also doesn’t cover the scenario in which an instance needs to be stopped and started, for example for maintenance or patching. Without Capacity Reservation, there is a theoretical possibility that that instance type would not be available to start up again.
This leads us to the second option: On Demand Capacity Reservations.
How much capacity to reserve?
Our failure scenario is when functionality in one AZ is impaired and the Auto Scaling Group must shift its instances to the remaining AZs while maintaining the total number of instances. With a minimum requirement of six instances, this means that we need 6/2 = 3 instances worth of Reserved Capacity in each AZ (as we can’t know in advance which one will be affected).

Spinning up the solution
If you want to get hands-on experience with On Demand Capacity Reservations, refer to this CloudFormation template and its accompanying README file for details on how to spin up the solution that we’re using. The README also contains more information about the Stack architecture. Upon successful creation, you have the following architecture running in your account.

Note that the default instance type for the AWS CloudFormation stack has been downgraded to t2.micro to keep our experiment within the AWS Free Tier.
Testing the solution
Now we have a fully functioning solution with Reserved Capacity dedicated to this specific Auto Scaling Group. However, we haven’t tested it yet.
The tests utilize the AWS Command Line Interface (AWS CLI), which we execute using AWS CloudShell.
To interact with the resources created by CloudFormation, we need some names and IDs that have been collected in the “Outputs” section of the stack. These can be accessed from the console in a tab under the Stack that you have created.

We set these as variables for easy access later (replace the values with the values from your stack):
export AUTOSCALING\_GROUP\_NAME=ASGWithODCRs-CapacityBackedASG-13IZJWXF9QV8Eexport SUBNET\_FOR\_MANUALLY\_ADDED\_INSTANCE=subnet-03045a72a6328ef72export SUBNETS\_TO\_KEEP=subnet-03045a72a6328ef72,subnet-0fd00353b8a42f251
How does the solution react to scaling out the Auto Scaling Group beyond the Capacity Reservation?
First, let’s look at what happens if the Auto Scaling Group wants to Scale Out. Our requirements state that we should have a minimum of six instances running at any one time. But the solution should still adapt to increased load. Before knowing anything about how this works in AWS, imagine two scenarios:
- The Auto Scaling Group can scale out to a total of nine instances, as that’s how many On Demand Capacity Reservations we have. But it can’t go beyond that even if there is On Demand capacity available.
- The Auto Scaling Group can scale just as much as it could when On Demand Capacity Reservations weren’t used, and it continues to launch unreserved instances when the On Demand Capacity Reservations run out (assuming that capacity is in fact available, which is why we have the On Demand Capacity Reservations in the first place).
The instances section of the Amazon EC2 Management Console can be used to show our existing Capacity Reservations, as created by the CloudFormation stack.
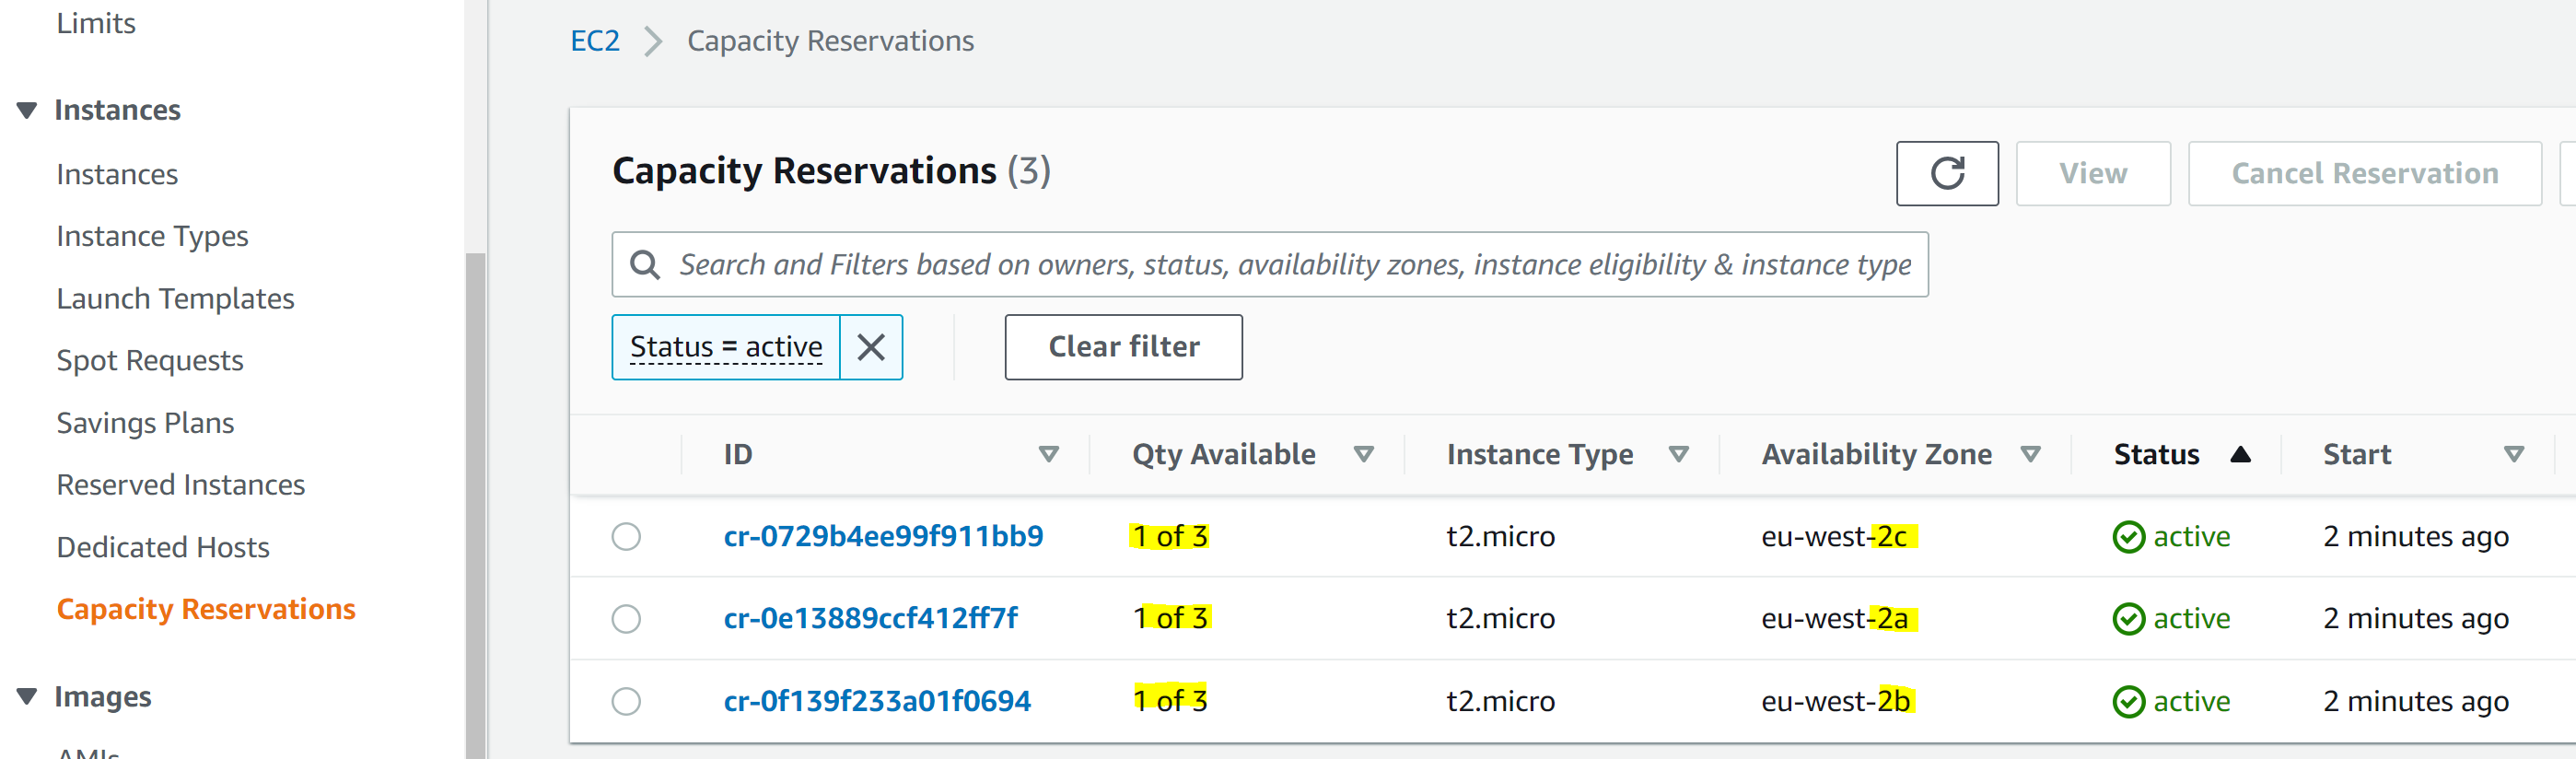
As expected, this shows that we are currently using six out of our nine On Demand Capacity Reservations, with two in each AZ.
Now let’s scale out our Auto Scaling Group to 12, thus using up all On Demand Capacity Reservations in each AZ, as well as requesting one extra Instance per AZ.
aws autoscaling set-desired-capacity \--auto-scaling-group-name $AUTOSCALING\_GROUP\_NAME \--desired-capacity 12The Auto Scaling Group now has the desired Capacity of 12:

And in the Capacity Reservation screen we can see that all our On Demand Capacity Reservations have been used up:
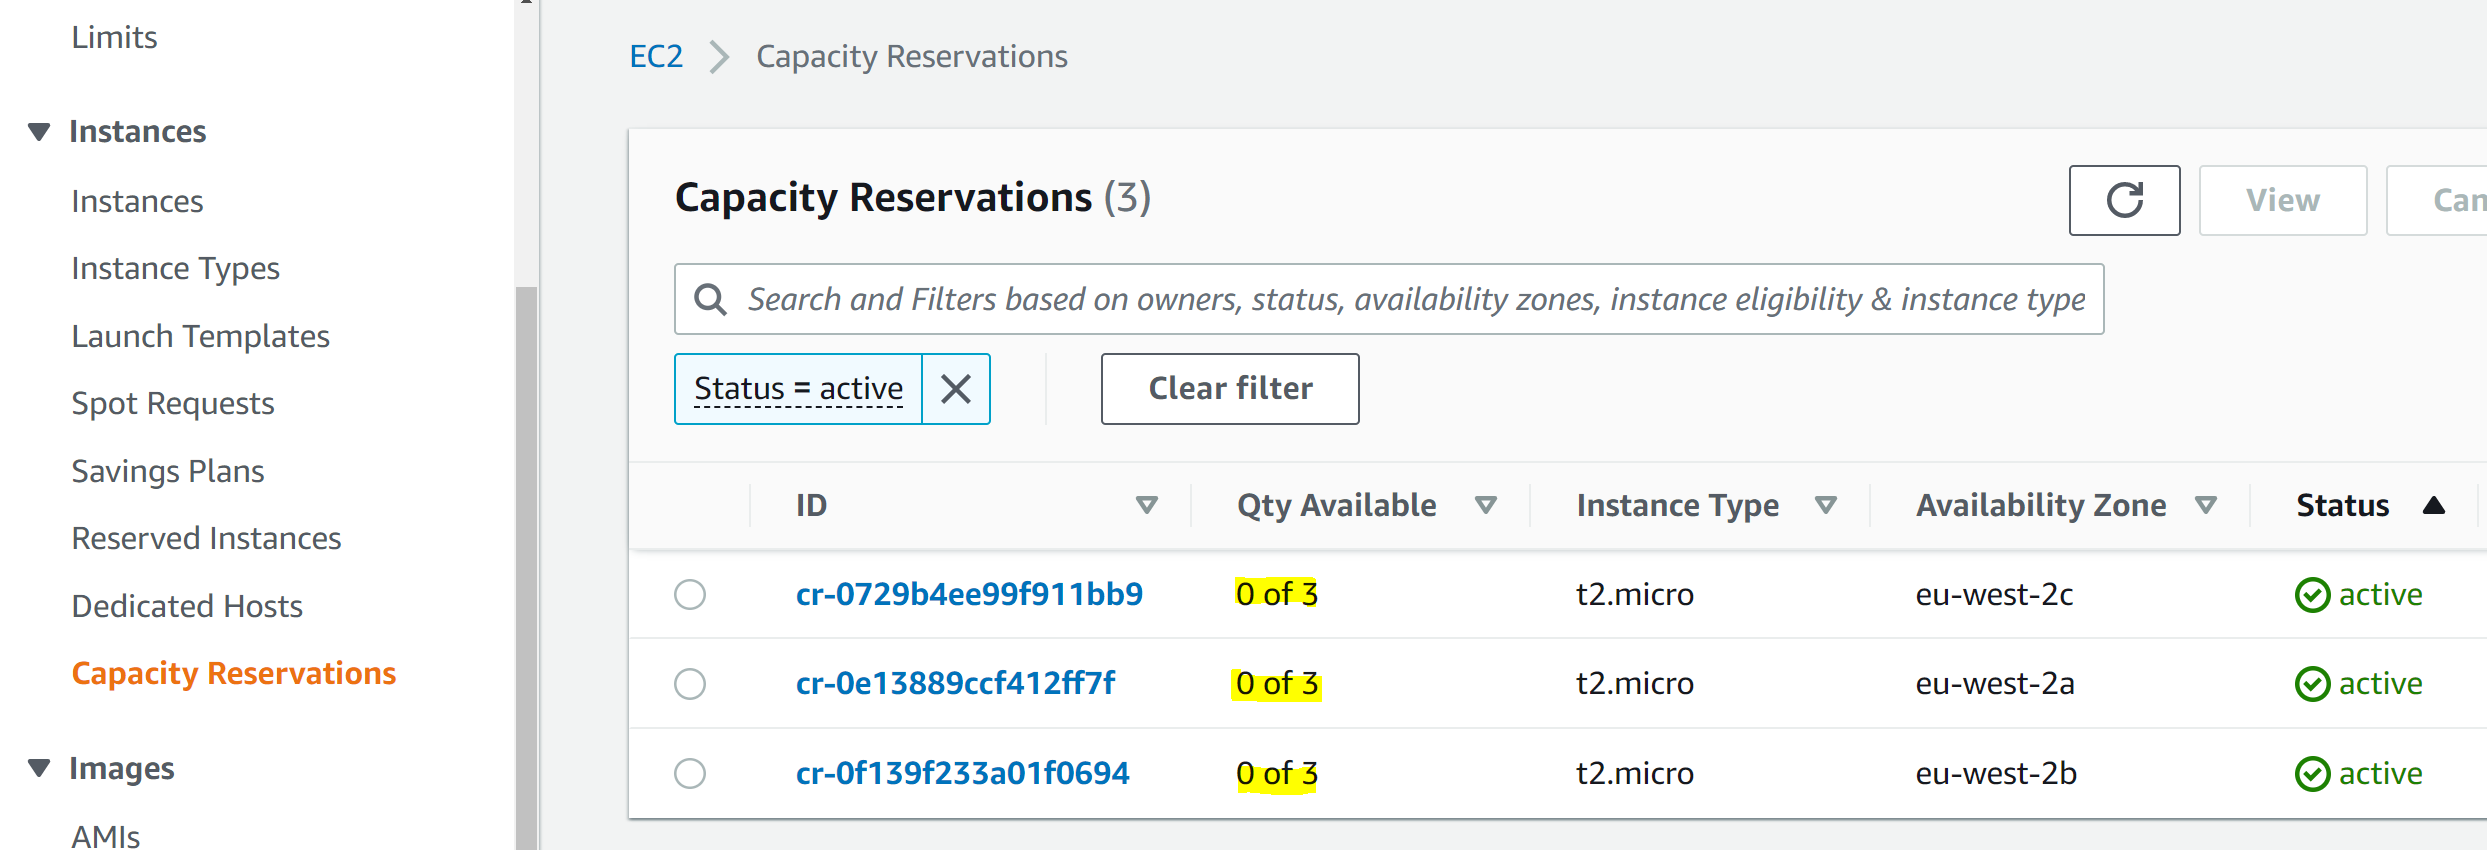
In the Auto Scaling Group we see that – as expected – we weren’t restricted to nine instances. Instead, the Auto Scaling Group fell back on launching unreserved instances when our On Demand Capacity Reservations ran out:

How does the solution react to adding a matching instance outside the Auto Scaling Group?
But what if someone else/another process in the account starts an EC2 instance of the same type for which we have the On Demand Capacity Reservations? Won’t they get that Reservation, and our Auto Scaling Group will be left short of its three instances per AZ, which would mean that we won’t have enough reservations for our minimum of six instances in case there are issues with an AZ?
This all comes down to the type of On Demand Capacity Reservation that we have created, or the “Eligibility”. Looking at our Capacity Reservations, we can see that they are all of the “targeted” type. This means that they are only used if explicitly referenced, like we’re doing in our Target Group for the Auto Scaling Group.

It’s time to prove that. First, we scale in our Auto Scaling Group so that only six instances are used, resulting in there being one unused capacity reservation in each AZ. Then, we try to add an EC2 instance manually, outside the target group.
First, scale in the Auto Scaling Group:
aws autoscaling set-desired-capacity \--auto-scaling-group-name $AUTOSCALING\_GROUP\_NAME \--desired-capacity 6
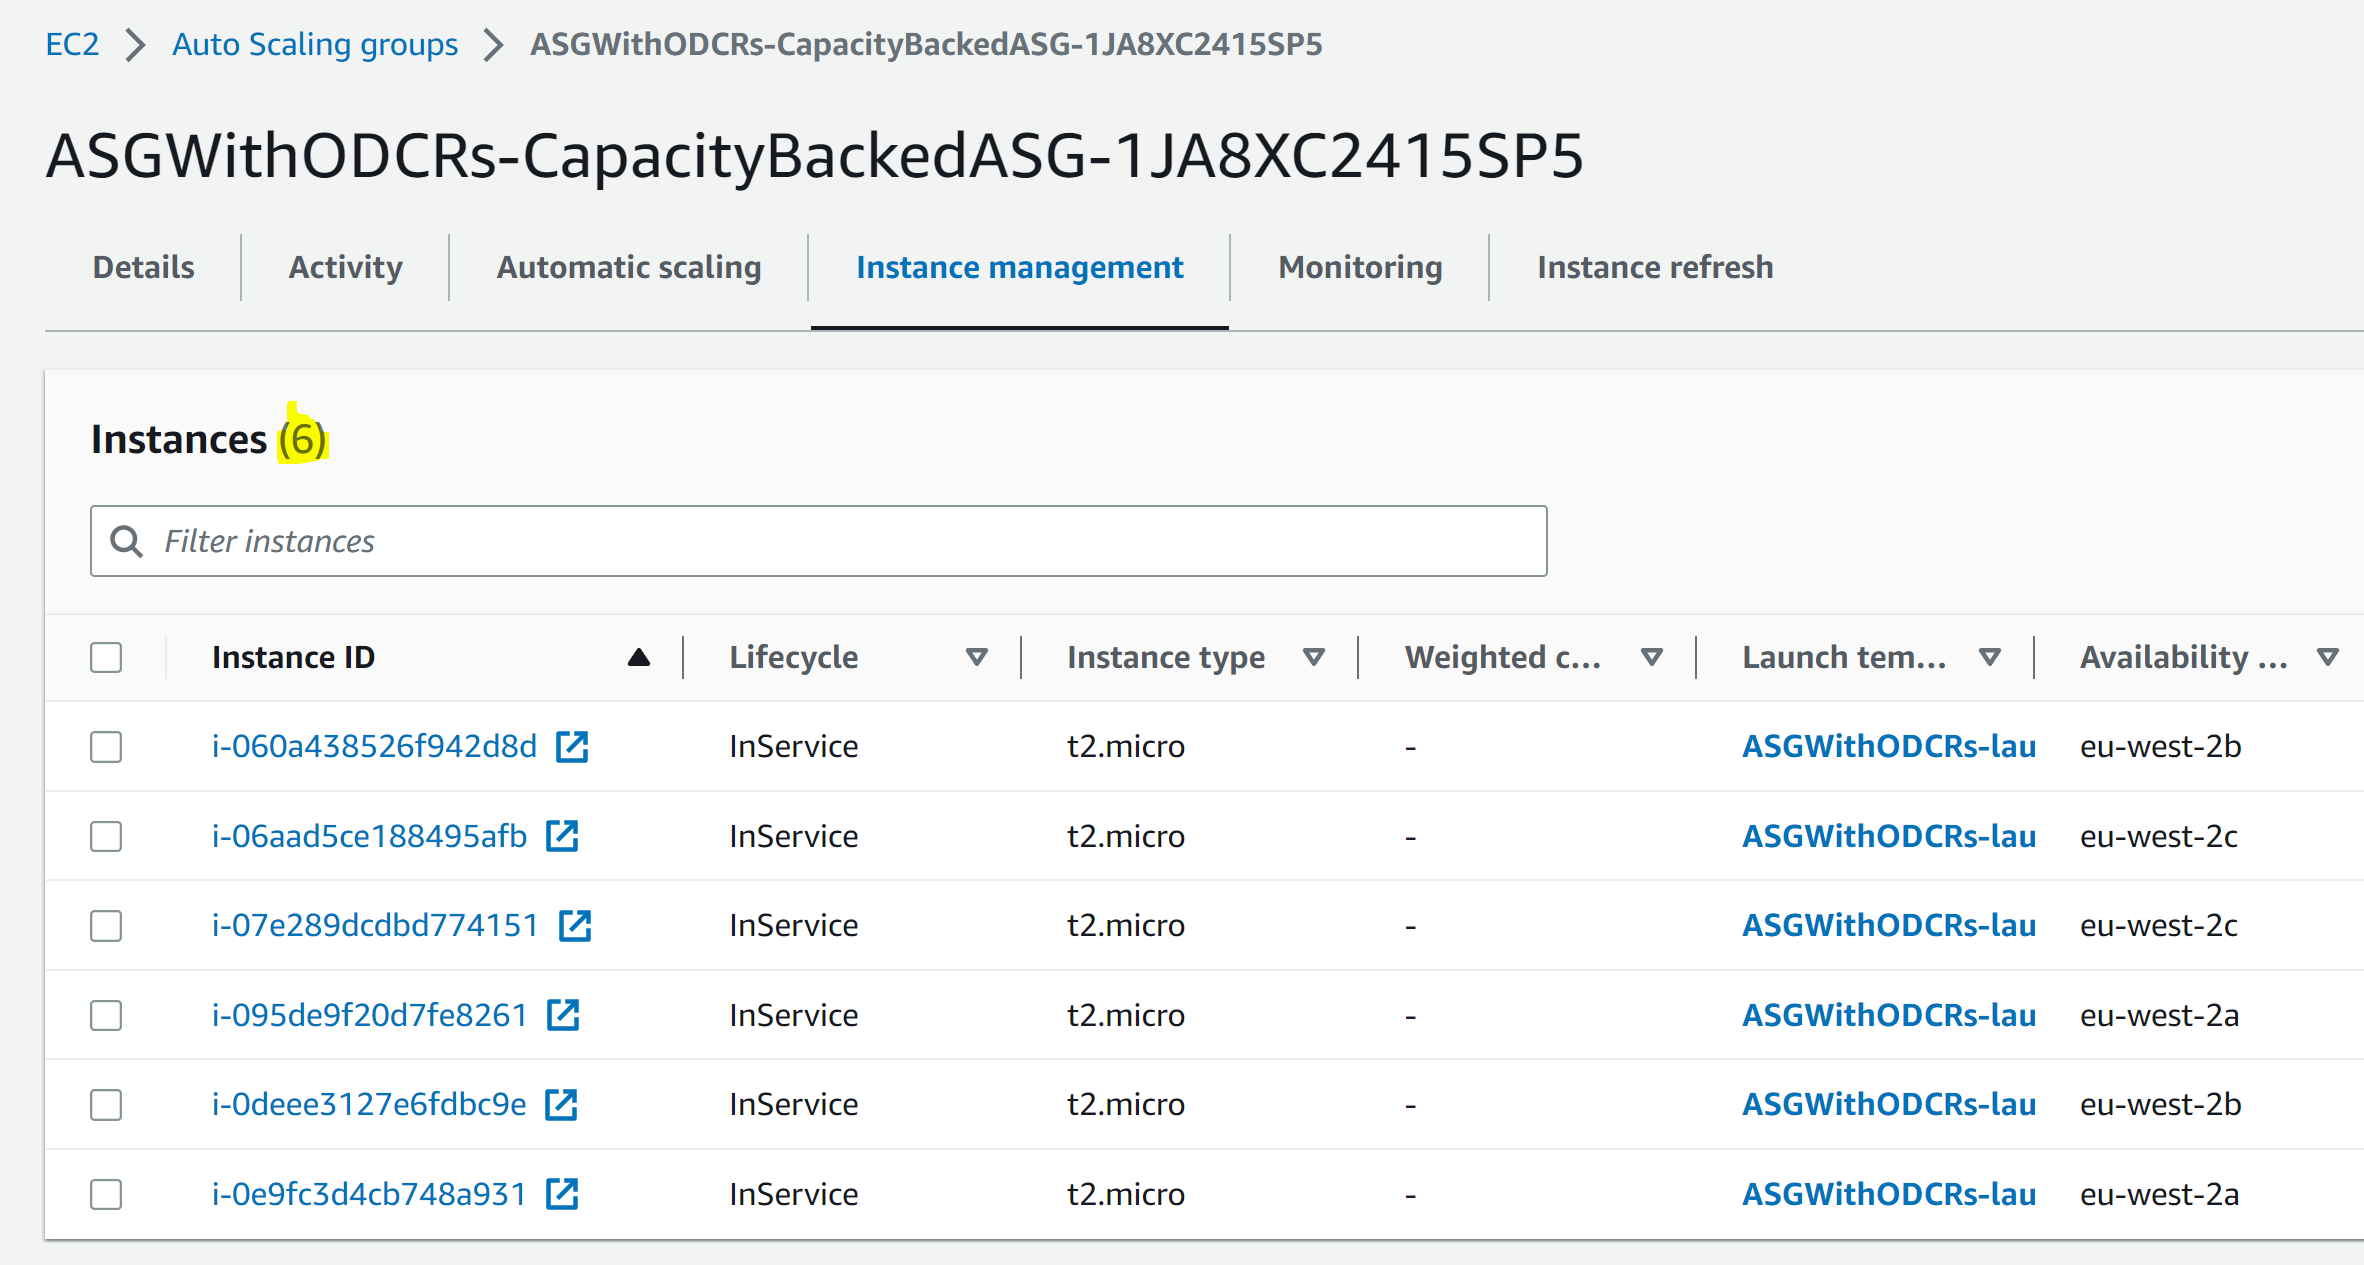
Then, spin up the new instance, and save its ID for later when we clean up:
export MANUALLY\_CREATED\_INSTANCE\_ID=$(aws ec2 run-instances \--image-id resolve:ssm:/aws/service/ami-amazon-linux-latest/amzn2-ami-hvm-x86\_64-gp2 \--instance-type t2.micro \--subnet-id $SUBNET\_FOR\_MANUALLY\_ADDED\_INSTANCE \--query 'Instances[0].InstanceId' --output text) 
We still have the three unutilized On Demand Capacity Reservations, as expected, proving that the On Demand Capacity Reservations with the “targeted” eligibility only get used when explicitly referenced:

How does the solution react to an AZ being removed?
Now we’re comfortable that the Auto Scaling Group can grow beyond the On Demand Capacity Reservations if needed, as long as there is capacity, and that other EC2 instances in our account won’t use the On Demand Capacity Reservations specifically purchased for the Auto Scaling Group. It’s time for the big test. How does it all behave when an AZ becomes unavailable?
For our purposes, we can simulate this scenario by changing the Auto Scaling Group to be across two AZs instead of the original three.
First, we scale out to seven instances so that we can see the impact of overflow outside the On Demand Capacity Reservations when we subsequently remove one AZ:
aws autoscaling set-desired-capacity \--auto-scaling-group-name $AUTOSCALING\_GROUP\_NAME \--desired-capacity 7Then, we change the Auto Scaling Group to only cover two AZs:
aws autoscaling update-auto-scaling-group \--auto-scaling-group-name $AUTOSCALING\_GROUP\_NAME \--vpc-zone-identifier $SUBNETS\_TO\_KEEPGive it some time, and we see that the Auto Scaling Group is now spread across two AZs, On Demand Capacity Reservations cover the minimum six instances as per our requirements, and the rest is handled by instances without Capacity Reservation:


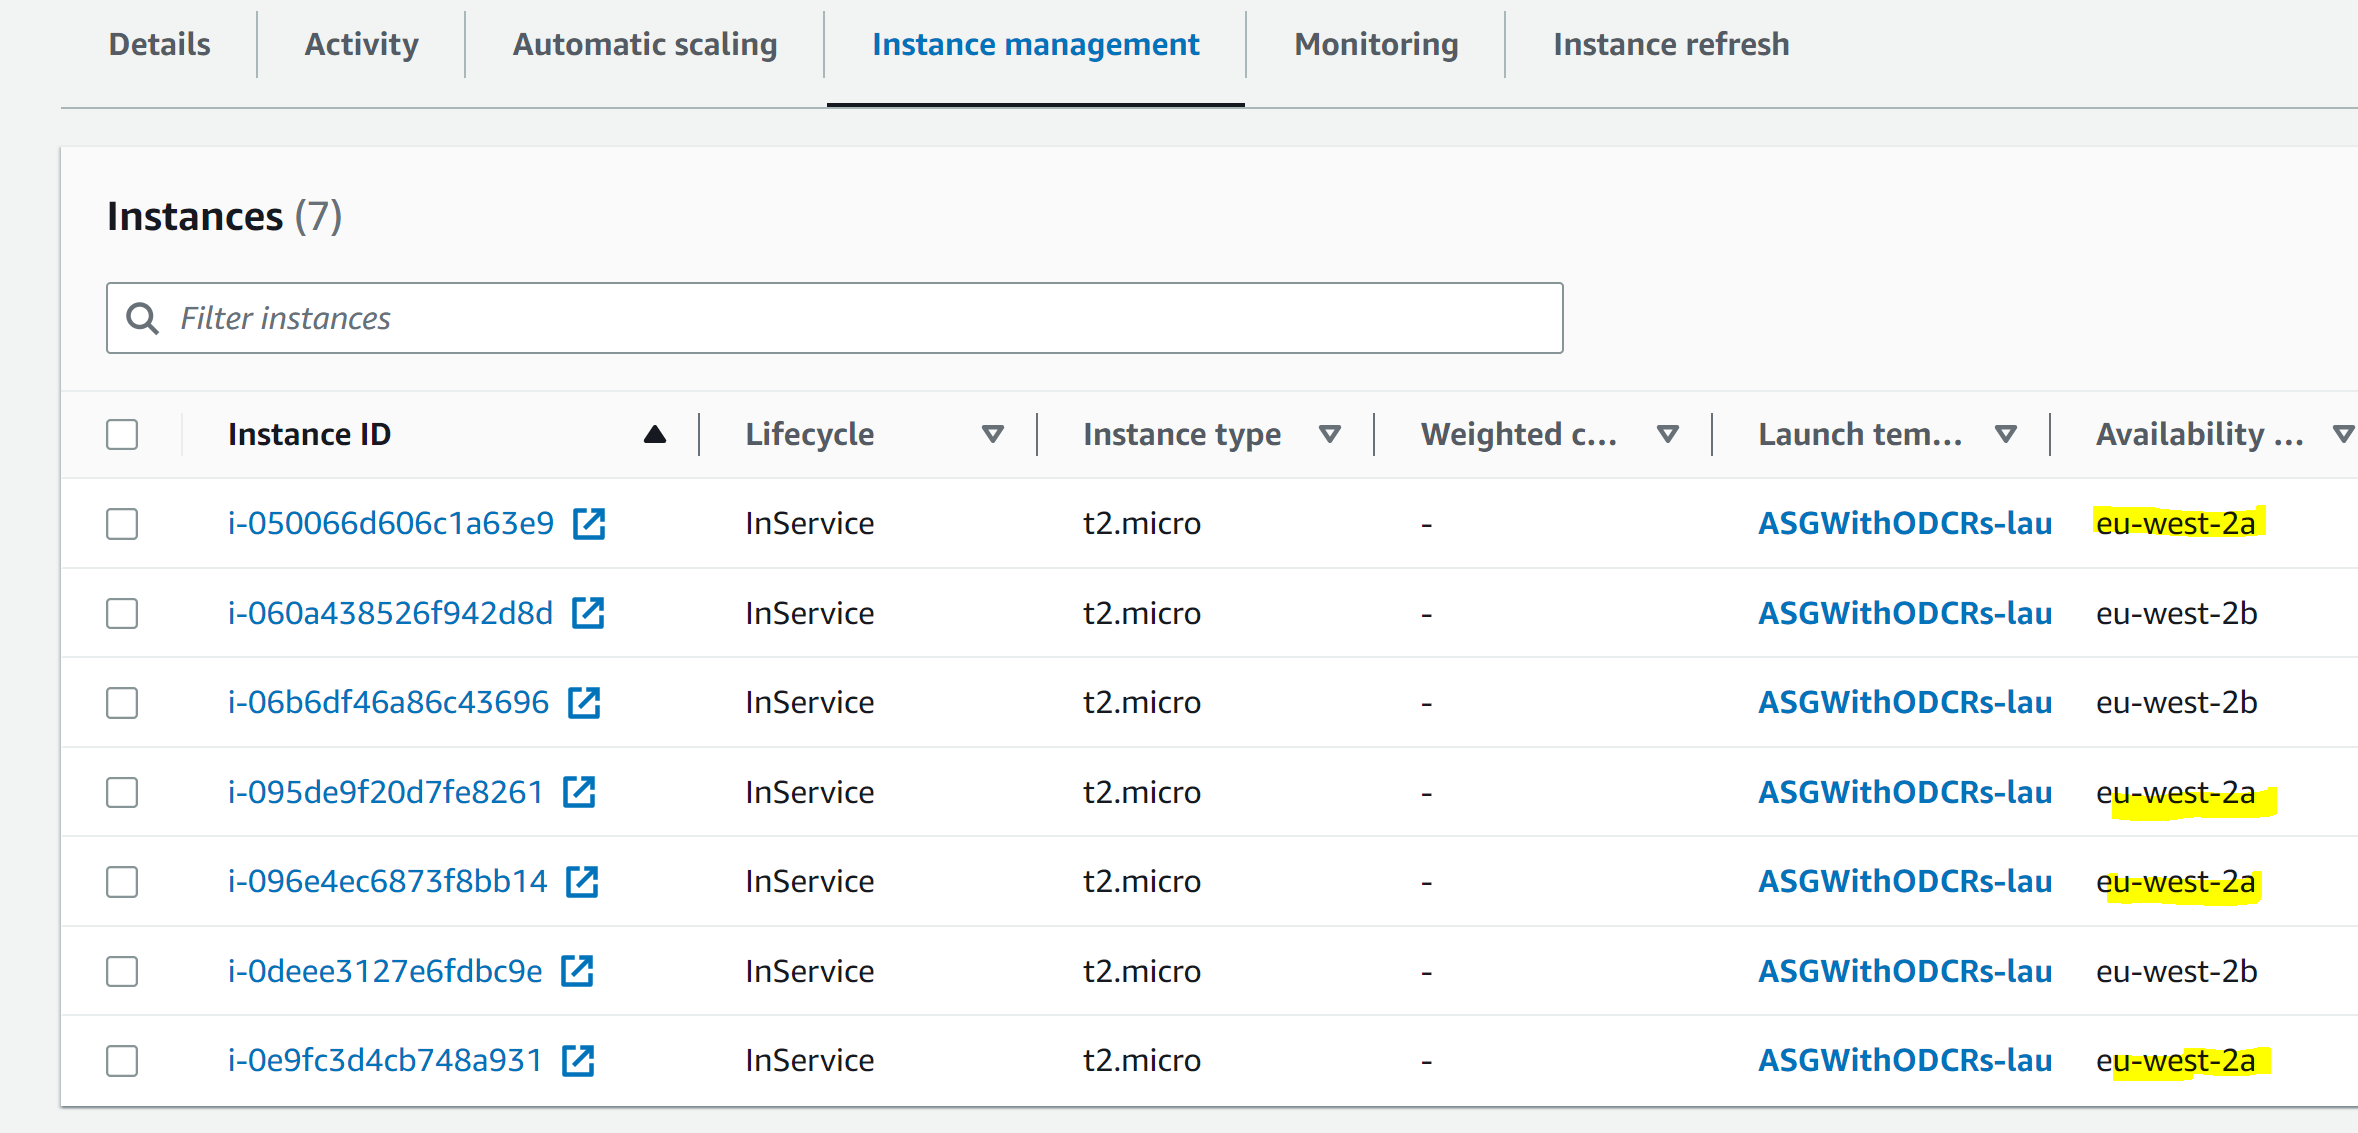
Cleanup
It’s time to clean up, as those Instances and On Demand Capacity Reservations come at a cost!
- First, remove the EC2 instance that we made:
aws ec2 terminate-instances --instance-ids $MANUALLY\_CREATED\_INSTANCE\_ID
- Then, delete the CloudFormation stack.
Conclusion
Using a combination of Auto Scaling Groups, Resource Groups, and On Demand Capacity Reservations (ODCRs), we have built a solution that provides High Availability backed by reserved capacity, for those types of workloads where the requirements for availability in the case of an AZ becoming temporarily unavailable outweigh the increased cost of reserving capacity, and where the best practices for architecting for flexibility cannot be followed due to limitations on applicable architectures.
We have tested the solution and confirmed that the Auto Scaling Group falls back on using unreserved capacity when the On Demand Capacity Reservations are exhausted. Moreover, we confirmed that targeted On Demand Capacity Reservations won’t risk getting accidentally used by other solutions in our account.
Now it’s time for you to try it yourself! Download the IaC template and give it a try! And if you are planning on using On Demand Capacity Reservations, then don’t forget to look into Savings Plans, as they significantly reduce the cost of that Reserved Capacity..
This blog post is written by Pranaya Anshu, EC2 PMM, and Sid Ambatipudi, EC2 Compute GTM Specialist.
Amazon EC2 Spot Instances are a powerful tool that thousands of customers use to optimize their compute costs. The National Football League (NFL) is an example of customer using Spot Instances, leveraging 4000 EC2 Spot Instances across more than 20 instance types to build its season schedule. By using Spot Instances, it saves 2 million dollars every season! Virtually any organization – small or big – can benefit from using Spot Instances by following best practices.
Overview of Spot Instances
Spot Instances let you take advantage of unused EC2 capacity in the AWS cloud and are available at up to a 90% discount compared to On-Demand prices. Through Spot Instances, you can take advantage of the massive operating scale of AWS and run hyperscale workloads at a significant cost saving. In exchange for these discounts, AWS has the option to reclaim Spot Instances when EC2 requires the capacity. AWS provides a two-minute notification before reclaiming Spot Instances, allowing workloads running on those instances to be gracefully shut down.
In this blog post, we explore four best practices that can help you optimize your Spot Instances usage and minimize the impact of Spot Instances interruptions: diversifying your instances, considering attribute-based instance type selection, leveraging Spot placement scores, and using the price-capacity-optimized allocation strategy. By applying these best practices, you’ll be able to leverage Spot Instances for appropriate workloads and ultimately reduce your compute costs. Note for the purposes of this blog, we will focus on the integration of Spot Instances with Amazon EC2 Auto Scaling groups.
Pre-requisites
Spot Instances can be used for various stateless, fault-tolerant, or flexible applications such as big data, containerized workloads, CI/CD, web servers, high-performance computing (HPC), and AI/ML workloads. However, as previously mentioned, AWS can interrupt Spot Instances with a two-minute notification, so it is best not to use Spot Instances for workloads that cannot handle individual instance interruption — that is, workloads that are inflexible, stateful, fault-intolerant, or tightly coupled.
Best practices
- Diversify your instances
The fundamental best practice when using Spot Instances is to be flexible. A Spot capacity pool is a set of unused EC2 instances of the same instance type (for example, m6i.large) within the same AWS Region and Availability Zone (for example, us-east-1a). When you request Spot Instances, you are requesting instances from a specific Spot capacity pool. Since Spot Instances are spare EC2 capacity, you want to base your selection (request) on as many spare pools of capacity as possible in order to increase your likelihood of getting Spot Instances. You should diversify across instance sizes, generations, instance types, and Availability Zones to maximize your savings with Spot Instances. For example, if you are currently using c5a.large in us-east-1a, consider including c6a instances (newer generation of instances), c5a.xl (larger size), or us-east-1b (different Availability Zone) to increase your overall flexibility. Instance diversification is beneficial not only for selecting Spot Instances, but also for scaling, resilience, and cost optimization.
To get hands-on experience with Spot Instances and to practice instance diversification, check out Amazon EC2 Spot Instances workshops. And once you’ve diversified your instances, you can leverage AWS Fault Injection Simulator (AWS FIS) to test your applications’ resilience to Spot Instance interruptions to ensure that they can maintain target capacity while still benefiting from the cost savings offered by Spot Instances. To learn more about stress testing your applications, check out the Back to Basics: Chaos Engineering with AWS Fault Injection Simulator video and AWS FIS documentation.
- Consider attribute-based instance type selection
We have established that flexibility is key when it comes to getting the most out of Spot Instances. Similarly, we have said that in order to access your desired Spot Instances capacity, you should select multiple instance types. While building and maintaining instance type configurations in a flexible way may seem daunting or time-consuming, it doesn’t have to be if you use attribute-based instance type selection. With attribute-based instance type selection, you can specify instance attributes — for example, CPU, memory, and storage — and EC2 Auto Scaling will automatically identify and launch instances that meet your defined attributes. This removes the manual-lift of configuring and updating instance types. Moreover, this selection method enables you to automatically use newly released instance types as they become available so that you can continuously have access to an increasingly broad range of Spot Instance capacity. Attribute-based instance type selection is ideal for workloads and frameworks that are instance agnostic, such as HPC and big data workloads, and can help to reduce the work involved with selecting specific instance types to meet specific requirements.
For more information on how to configure attribute-based instance selection for your EC2 Auto Scaling group, refer to Create an Auto Scaling Group Using Attribute-Based Instance Type Selection documentation. To learn more about attribute-based instance type selection, read the Attribute-Based Instance Type Selection for EC2 Auto Scaling and EC2 Fleet news blog or check out the Using Attribute-Based Instance Type Selection and Mixed Instance Groups section of the Launching Spot Instances workshop.
- Leverage Spot placement scores
Now that we’ve stressed the importance of flexibility when it comes to Spot Instances and covered the best way to select instances, let’s dive into how to find preferred times and locations to launch Spot Instances. Because Spot Instances are unused EC2 capacity, Spot Instances capacity fluctuates. Correspondingly, it is possible that you won’t always get the exact capacity at a specific time that you need through Spot Instances. Spot placement scores are a feature of Spot Instances that indicates how likely it is that you will be able to get the Spot capacity that you require in a specific Region or Availability Zone. Your Spot placement score can help you reduce Spot Instance interruptions, acquire greater capacity, and identify optimal configurations to run workloads on Spot Instances. However, it is important to note that Spot placement scores serve only as point-in-time recommendations (scores can vary depending on current capacity) and do not provide any guarantees in terms of available capacity or risk of interruption. To learn more about how Spot placement scores work and to get started with them, see the Identifying Optimal Locations for Flexible Workloads With Spot Placement Score blog and Spot placement scores documentation.
As a near real-time tool, Spot placement scores are often integrated into deployment automation. However, because of its logging and graphic capabilities, you may find it to be a valuable resource even before you launch a workload in the cloud. If you are looking to understand historical Spot placement scores for your workload, you should check out the Spot placement score tracker, a tool that automates the capture of Spot placement scores and stores Spot placement score metrics in Amazon CloudWatch. The tracker is available through AWS Labs, a GitHub repository hosting tools. Learn more about the tracker through the Optimizing Amazon EC2 Spot Instances with Spot Placement Scores blog.
When considering ideal times to launch Spot Instances and exploring different options via Spot placement scores, be sure to consider running Spot Instances at off-peak hours – or hours when there is less demand for EC2 Instances. As you may assume, there is less unused capacity – Spot Instances – available during typical business hours than after business hours. So, in order to leverage as much Spot capacity as you can, explore the possibility of running your workload at hours when there is reduced demand for EC2 instances and thus greater availability of Spot Instances. Similarly, consider running your Spot Instances in “off-peak Regions” – or Regions that are not experiencing business hours at that certain time.
On a related note, to maximize your usage of Spot Instances, you should consider using previous generation of instances if they meet your workload needs. This is because, as with off-peak vs peak hours, there is typically greater capacity available for previous generation instances than current generation instances, as most people tend to use current generation instances for their compute needs.
- Use the price-capacity-optimized allocation strategy
Once you’ve selected a diversified and flexible set of instances, you should select your allocation strategy. When launching instances, your Auto Scaling group uses the allocation strategy that you specify to pick the specific Spot pools from all your possible pools. Spot offers four allocation strategies: price-capacity-optimized, capacity-optimized, capacity-optimized-prioritized, and lowest-price. Each of these allocation strategies select Spot Instances in pools based on price, capacity, a prioritized list of instances, or a combination of these factors.
The price-capacity-optimized strategy launched in November 2022. This strategy makes Spot Instance allocation decisions based on the most capacity at the lowest price. It essentially enables Auto Scaling groups to identify the Spot pools with the highest capacity availability for the number of instances that are launching. In other words, if you select this allocation strategy, we will find the Spot capacity pools that we believe have the lowest chance of interruption in the near term. Your Auto Scaling groups then request Spot Instances from the lowest priced of these pools.
We recommend you leverage the price-capacity-optimized allocation strategy for the majority of your workloads that run on Spot Instances. To see how the price-capacity-optimized allocation strategy selects Spot Instances in comparison with lowest-price and capacity-optimized allocation strategies, read the Introducing the Price-Capacity-Optimized Allocation Strategy for EC2 Spot Instances blog post.
Clean-up
If you’ve explored the different Spot Instances workshops we recommended throughout this blog post and spun up resources, please remember to delete resources that you are no longer using to avoid incurring future costs.
Conclusion
Spot Instances can be leveraged to reduce costs across a wide-variety of use cases, including containers, big data, machine learning, HPC, and CI/CD workloads. In this blog, we discussed four Spot Instances best practices that can help you optimize your Spot Instance usage to maximize savings: diversifying your instances, considering attribute-based instance type selection, leveraging Spot placement scores, and using the price-capacity-optimized allocation strategy.
To learn more about Spot Instances, check out Spot Instances getting started resources. Or to learn of other ways of reducing costs and improving performance, including leveraging other flexible purchase models such as AWS Savings Plans, read the Increase Your Application Performance at Lower Costs eBook or watch the Seven Steps to Lower Costs While Improving Application Performance webinar.
This was written by Uma Ramadoss, Specialist Integration Services, and Chandan Rupakheti, Solutions Architect.
This blog post shows how you can save cost by automating the stopping and starting of an Amazon Managed Workflows for Apache Airflow (Amazon MWAA) environment. It describes how you can retain the data stored in a metadata database and presents an automated solution you can use in your AWS account.
Customers run end to end data pipelines at scale with MWAA. It is a common best practice to run non-production environments for development and testing. A nonproduction environment often does not need to run throughout the day due to factors such as working hours of the development team. As there is no automatic way to stop an MWAA environment when not in use and deleting an environment causes metadata loss, customers often run it continually and pay the full cost.
Overview
Amazon MWAA has a distributed architecture with multiple components such as scheduler, worker, webserver, queue, and database. Customers build data pipelines as Directed Acyclic Graphs (DAGs) and run in Amazon MWAA. The DAGs use variables and connections from the Amazon MWAA metadata database. The history of DAG runs and related data are stored in the same metadata database. The database also stores other information such as user roles and permissions.
When you delete the Amazon MWAA environment, all the components including the database are deleted so that you do not incur any cost. As this normal deletion results in loss of metadata, you need a customized solution to back up the data and to automate the deletion and recreation.
The sample application deletes and recreates your MWAA environment at a scheduled interval defined by you using Amazon EventBridge Scheduler. It exports all metadata into an Amazon S3 bucket before deletion and imports the metadata back to the environment after creation. As this is a managed database and you cannot access the database outside the Amazon MWAA environment, it uses DAGs to import and export the data. The entire process is orchestrated using AWS Step Functions.
Deployment architecture
The sample application is in a GitHub repository. Use the instructions in the readme to deploy the application.
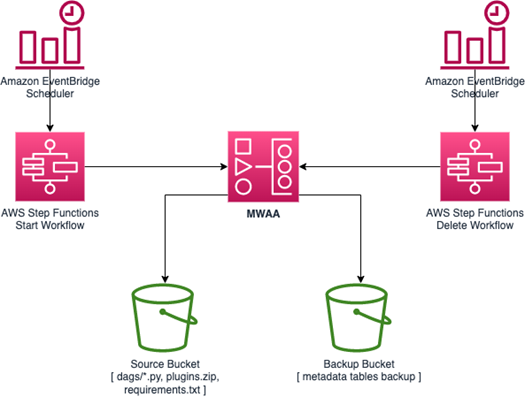
The sample application deploys the following resources –
- A Step Functions state machine to orchestrate the steps needed to delete the MWAA environment.
- A Step Functions state machine to orchestrate the steps needed to recreate the MWAA environment.
- EventBridge Scheduler rules to trigger the state machines at the scheduled time.
- An S3 bucket to store metadata database backup and environment details.
- Two DAG files uploaded to the source S3 bucket configured with the MWAA environment. The export DAG exports metadata from the MWAA metadata database to backup S3 bucket. The import DAG restores the metadata from the backup S3 bucket to the newly created MWAA environment.
- AWS Lambda functions for triggering the DAGs using MWAA CLI API.
- A Step Functions state machine to wait for the long-running MWAA creation and deletion process.
- Amazon EventBridge rule to notify on state machine failures.
- Amazon Simple Notification Service (Amazon SNS) topic as a target to the EventBridge rule for failure notifications.
- Amazon Interface VPC Endpoint for Step Functions for MWAA environment deployed in the private mode.
Stop workflow
At a scheduled time, Amazon EventBridge Scheduler triggers a Step Functions state machine to stop the MWAA environment. The state machine performs the following actions:

- Fetch Amazon MWAA environment details such as airflow configurations, IAM execution role, logging configurations and VPC details.
- If the environment is not in the “AVAILABLE” status, it fails the workflow by branching to the “Pausing unsuccessful” state.
- Otherwise, it runs the normal workflow and stores the environment details in an S3 bucket so that Start workflow can recreate the environment with this data.
- Trigger an MWAA DAG using AWS Lambda function to export metadata to the Amazon S3 bucket. This step uses Step Functions to wait for callback token integration.
- Resume the workflow when the task token is returned from the MWAA DAG.
- Delete Amazon MWAA environment.
- Wait to confirm the deletion.
Start workflow
At a scheduled time, EventBridge Scheduler triggers the Step Functions state machine to recreate the MWAA environment. The steps in the state machine perform the following actions:

- Retrieve the environment details stored in Amazon S3 bucket by the stop workflow.
- Create an MWAA environment with the same configuration as the original.
- Trigger an MWAA DAG through the Lambda function to restore the metadata from the S3 bucket to the newly created environment.
Cost savings
Consider a small MWAA environment in us-east-2 with a minimum of one worker, a maximum of one worker, and 1GB data storage. At the time of this writing, the monthly cost of the environment is $357.80. Let’s assume you use this environment between 6 am and 6 pm on weekdays.
The schedule in the env file of the sample application looks like:
MWAA\_PAUSE\_CRON\_SCHEDULE=’0 18 ? * MON-FRI *’MWAA\_RESUME\_CRON\_SCHEDULE=’30 5 ? * MON-FRI *’As MWAA environment creation takes anywhere between 20 and 30 minutes, the MWAA\_RESUME\_CRON\_SCHEDULE is set at 5.30 pm.
Assuming 21 weekdays per month, the monthly cost of the environment is $123.48 and is 65.46% less compared to running the environment continuously:
- 21 weekdays * 12 hours * 0.49 USD per hour = $123.48
Additional considerations
The sample application only restores at-store data. Though the deletion process pauses all the DAGs before making the backup, it cannot stop any running tasks or in-flight messages in the queue. It also does not backup tasks that are not in completed state. This can result in task history loss for the tasks that were running during the backup.
Over time, the metadata grows in size, which can increase latency in query performance. You can use a DAG as shown in the example to clean up the database regularly.
Avoid setting the catchup by default configuration flag in the environment setting to true or in the DAG definition unless it is required. Catch up feature runs all the DAG runs that are missed for any data interval. When the environment is created again, if the flag is true, it catches up with the missed DAG runs and can overload the environment.
Conclusion
Automating the deletion and recreation of Amazon MWAA environments is a powerful solution for cost optimization and efficient management of resources. By following the steps outlined in this blog post, you can ensure that your MWAA environment is deleted and recreated without losing any of the metadata or configurations. This allows you to deploy new code changes and updates more quickly and easily, without having to configure your environment each time manually.
The potential cost savings of running your MWAA environment for only 12 hours on weekdays are significant. The example shows how you can save up to 65% of your monthly costs by choosing this option. This makes it an attractive solution for organizations that are looking to reduce cost while maintaining a high level of performance.
Visit the samples repository to learn more about Amazon MWAA. It contains a wide variety of examples and templates that you can use to build your own applications.
For more serverless learning resources, visit Serverless Land.
This post is written by Daniel Lorch, Senior Consultant and David Mbonu, Senior Solutions Architect.
Amazon Simple Notification Service (Amazon SNS), a messaging service that provides high-throughput, push-based, many-to-many messaging between distributed systems, microservices, and event-driven serverless applications, now supports active tracing with AWS X-Ray.
With AWS X-Ray active tracing enabled for SNS, you can identify bottlenecks and monitor the health of event-driven applications by looking at segment details for SNS topics, such as resource metadata, faults, errors, and message delivery latency for each subscriber.
This blog post reviews common use cases where AWS X-Ray active tracing enabled for SNS provides a consistent view of tracing data across AWS services in real-world scenarios. We cover two architectural patterns which allow you to gain accurate visibility of your end-to-end tracing: SNS to Amazon Simple Queue Service (Amazon SQS) queues and SNS topics to Amazon Kinesis Data Firehose streams.
Getting started with the sample serverless application
To demonstrate AWS X-Ray active tracing for SNS, we will use the Wild Rydes serverless application as shown in the following figure. The application uses a microservices architecture which implements asynchronous messaging for integrating independent systems.

This is how the sample serverless application works:
- An Amazon API Gateway receives ride requests from users.
- An AWS Lambda function processes ride requests.
- An Amazon DynamoDB table serves as a store for rides.
- An SNS topic serves as a fan-out for ride requests.
- Individual SQS queues and Lambda functions are set up for processing requests via various back-office services (customer notification, customer accounting, and others).
- An SNS message filter is in place for the subscription of the extraordinary rides service.
- A Kinesis Data Firehose delivery stream archives ride requests in an Amazon Simple Storage Service (Amazon S3) bucket.
Deploying the sample serverless application
Prerequisites
Deployment steps using AWS SAM
The sample application is provided as an AWS SAM infrastructure as code template.
This demonstrative application will deploy an API without authorization. Please consider controlling and managing access to your APIs.
- Clone the GitHub repository:
git clone https://github.com/aws-samples/sns-xray-active-tracing-blog-source-codecd sns-xray-active-tracing-blog-source-code - Build the lab artifacts from source:
sam build - Deploy the sample solution into your AWS account:
export AWS\_REGION=$(aws --profile default configure get region)sam deploy \--stack-name wild-rydes-async-msg-2 \--capabilities CAPABILITY\_IAM \--region $AWS\_REGION \--guidedConfirm SubmitRideCompletionFunction may not have authorization defined, Is this okay? [y/N]: with yes.
- Wait until the stack reaches status CREATE\_COMPLETE.
See the sample application README.md for detailed deployment instructions.
Testing the application
Once the application is successfully deployed, generate messages and validate that the SNS topic is publishing all messages:
- Look up the API Gateway endpoint:
export AWS\_REGION=$(aws --profile default configure get region)aws cloudformation describe-stacks \--stack-name wild-rydes-async-msg-2 \--query 'Stacks[].Outputs[?OutputKey==`UnicornManagementServiceApiSubmitRideCompletionEndpoint`].OutputValue' \--output text - Store this API Gateway endpoint in an environment variable:
export ENDPOINT=$(aws cloudformation describe-stacks \--stack-name wild-rydes-async-msg-2 \--query 'Stacks[].Outputs[?OutputKey==`UnicornManagementServiceApiSubmitRideCompletionEndpoint`].OutputValue' \--output text) - Send requests to the submit ride completion endpoint by executing the following command five or more times with varying payloads:
curl -XPOST -i -H "Content-Type\:application/json" -d '{ "from": "Berlin", "to": "Frankfurt", "duration": 420, "distance": 600, "customer": "cmr", "fare": 256.50 }' $ENDPOINT - Validate that messages are being passed in the application using the CloudWatch service map:
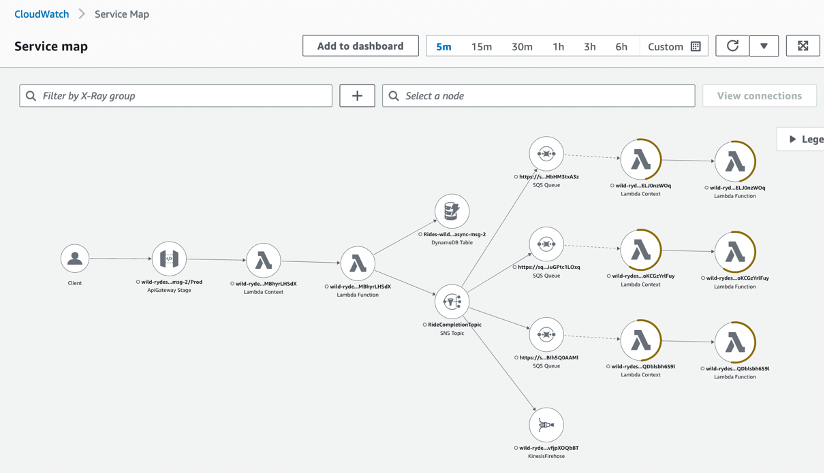
See the sample application README.md for detailed testing instructions.
The sample application shows various use-cases, which are described in the following sections.
Amazon SNS to Amazon SQS fanout scenario
A common application integration scenario for SNS is the Fanout scenario. In the Fanout scenario, a message published to an SNS topic is replicated and pushed to multiple endpoints, such as SQS queues. This allows for parallel asynchronous processing and is a common application integration pattern used in event-driven application architectures.
When an SNS topic fans out to SQS queues, the pattern is called topic-queue-chaining. This means that you add a queue, in our case an SQS queue, between the SNS topic and each of the subscriber services. As messages are buffered in a persistent manner in an SQS queue, no message is lost should a subscriber process run into issues for multiple hours or days, or experience exceptions or crashes.
By placing an SQS queue in front of each subscriber service, you can leverage the fact that a queue can act as a buffering load balancer. As every queue message is delivered to one of potentially many consumer processes, subscriber services can be easily scaled out and in, and the message load is distributed over the available consumer processes. In an event where suddenly a large number of messages arrives, the number of consumer processes has to be scaled out to cope with the additional load. This takes time and you need to wait until additional processes become operational. Since messages are buffered in the queue, you do not lose any messages in the process.
To summarize, in the Fanout scenario or the topic-queue-chaining pattern:
- SNS replicates and pushes the message to multiple endpoints.
- SQS decouples sending and receiving endpoints.

With AWS X-Ray active tracing enabled on the SNS topic, the CloudWatch service map shows us the complete application architecture, as follows.

Prior to the introduction of AWS X-Ray active tracing on the SNS topic, the AWS X-Ray service would not be able to reconstruct the full service map and the SQS nodes would be missing from the diagram.
To see the integration without AWS X-Ray active tracing enabled, open template.yaml and navigate to the resource RideCompletionTopic. Comment out the property TracingConfig: Active, redeploy and test the solution. The service map should then show an incomplete diagram where the SNS topic is linked directly to the consumer Lambda functions, omitting the SQS nodes.
For this use case, given the Fanout scenario, enabling AWS X-Ray active tracing on the SNS topic provides full end-to-end observability of the traces available in the application.
Amazon SNS to Amazon Kinesis Data Firehose delivery streams for message archiving and analytics
SNS is commonly used with Kinesis Data Firehose delivery streams for message archival and analytics use-cases. You can use SNS topics with Kinesis Data Firehose subscriptions to capture, transform, buffer, compress and upload data to Amazon S3, Amazon Redshift, Amazon OpenSearch Service, HTTP endpoints, and third-party service providers.
We will implement this pattern as follows:
- An SNS topic to replicate and push the message to its subscribers.
- A Kinesis Data Firehose delivery stream to capture and buffer messages.
- An S3 bucket to receive uploaded messages for archival.

In order to demonstrate this pattern, an additional consumer has been added to the SNS topic. The same Fanout pattern applies and the Kinesis Data Firehose delivery stream receives messages from the SNS topic alongside the existing consumers.
The Kinesis Data Firehose delivery stream buffers messages and is configured to deliver them to an S3 bucket for archival purposes. Optionally, an SNS message filter could be added to this subscription to select relevant messages for archival.
With AWS X-Ray active tracing enabled on the SNS topic, the Kinesis Data Firehose node will appear on the CloudWatch service map as a separate entity, as can be seen in the following figure. It is worth noting that the S3 bucket does not appear on the CloudWatch service map as Kinesis does not yet support AWS X-Ray active tracing at the time of writing of this blog post.

Prior to the introduction of AWS X-Ray active tracing on the SNS topic, the AWS X-Ray service would not be able to reconstruct the full service map and the Kinesis Data Firehose node would be missing from the diagram. To see the integration without AWS X-Ray active tracing enabled, open template.yaml and navigate to the resource RideCompletionTopic. Comment out the property TracingConfig: Active, redeploy and test the solution. The service map should then show an incomplete diagram where the Kinesis Data Firehose node is missing.
For this use case, given the data archival scenario with Kinesis Delivery Firehose, enabling AWS X-Ray active tracing on the SNS topic provides additional visibility on the Kinesis Data Firehose node in the CloudWatch service map.
Review faults, errors, and message delivery latency on the AWS X-Ray trace details page
The AWS X-Ray trace details page provides a timeline with resource metadata, faults, errors, and message delivery latency for each segment.
With AWS X-Ray active tracing enabled on SNS, additional segments for the SNS topic itself, but also the downstream consumers (AWS::SNS::Topic, AWS::SQS::Queue and AWS::KinesisFirehose) segments are available, providing additional faults, errors, and message delivery latency for these segments. This allows you to analyze latencies in your messages and their backend services. For example, how long a message spends in a topic, and how long it took to deliver the message to each of the topic’s subscriptions.

Enabling AWS X-Ray active tracing for SNS
AWS X-Ray active tracing is not enabled by default on SNS topics and needs to be explicitly enabled.
The example application used in this blog post demonstrates how to enable active tracing using AWS SAM.
You can enable AWS X-Ray active tracing using the SNS SetTopicAttributes API, SNS Management Console, or via AWS CloudFormation. See Active tracing in Amazon SNS in the Amazon SNS Developer Guide for more options.
Cleanup
To clean up the resources provisioned as part of the sample serverless application, follow the instructions as outlined in the sample application README.md.
Conclusion
AWS X-Ray active tracing for SNS enables end-to-end visibility in real-world scenarios involving patterns like SNS to SQS and SNS to Amazon Kinesis.
But it is not only useful for these patterns. With AWS X-Ray active tracing enabled for SNS, you can identify bottlenecks and monitor the health of event-driven applications by looking at segment details for SNS topics and consumers, such as resource metadata, faults, errors, and message delivery latency for each subscriber.
Enable AWS X-Ray active tracing for SNS to gain accurate visibility of your end-to-end tracing.
For more serverless learning resources, visit Serverless Land.
This post is written by Rahul Popat (Senior Solutions Architect) and Aneel Murari (Senior Solutions Architect)
Today, AWS X-Ray is announcing support for SnapStart-enabled AWS Lambda functions. Lambda SnapStart is a performance optimization that significantly improves the cold startup times for your functions. Announced at AWS re:Invent 2022, this feature delivers up to 10 times faster function startup times for latency-sensitive Java applications at no extra cost, and with minimal or no code changes.
X-Ray is a distributed tracing system that provides an end-to-end view of how an application is performing. X-Ray collects data about requests that your application serves and provides tools you can use to gain insight into opportunities for optimizations. Now you can use X-Ray to gain insights into the performance improvements of your SnapStart-enabled Lambda function.
With today’s feature launch, by turning on X-Ray tracing for SnapStart-enabled Lambda functions, you see separate subsegments corresponding to the Restore and Invoke phases for your Lambda function’s execution.
How does Lambda SnapStart work?
With SnapStart, the function’s initialization is done ahead of time when you publish a function version. Lambda takes an encrypted snapshot of the initialized execution environment and persists the snapshot in a tiered cache for low latency access.
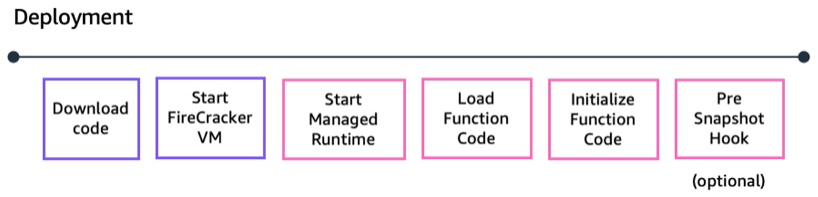
When the function is first invoked or scaled, Lambda resumes new execution environments from the cached snapshot instead of initializing them from scratch, improving startup latency. This results in reduced startup times.

X-Ray tracing before this feature launch
Using an example of a Hello World application written in Java, a Lambda function is configured with SnapStart and fronted by Amazon API Gateway:

Before today’s launch, X-Ray was not supported for SnapStart-enabled Lambda functions. So if you had enabled X-Ray tracing for API Gateway, the X-Ray trace for the sample application would look like:

The trace only shows the overall duration of the Lambda service call. You do not have insight into your function’s execution or the breakdown of different phases of Lambda function lifecycle.
Next, enable X-Ray for your Lambda function and see how you can view a breakdown of your function’s total execution duration.
Prerequisites for enabling X-Ray for SnapStart-enabled Lambda function
SnapStart is only supported for Lambda functions with Java 11 and newly launched Java 17 managed runtimes. You can only enable SnapStart for the published versions of your Lambda function. Once you’ve enabled SnapStart, Lambda publishes all subsequent versions with snapshots. You may also create a Lambda function alias, which points to the published version of your Lambda function.
Make sure that the Lambda function’s execution role has appropriate permissions to write to X-Ray.
Enabling AWS X-Ray for your Lambda function with SnapStart
You can enable X-Ray tracing for your Lambda function using AWS Management Console, AWS Command Line Interface (AWS CLI), AWS Serverless Application Model (AWS SAM), AWS CloudFormation template, or via AWS Cloud Deployment Kit (CDK).
This blog shows how you can achieve this via AWS Management Console and AWS SAM. For more information on enabling SnapStart and X-Ray using other methods, refer to AWS Lambda Developer Guide.
Enabling SnapStart and X-Ray via AWS Management Console
To enable SnapStart and X-Ray for Lambda function via the AWS Management Console:
- Navigate to your Lambda Function.
- On the Configuration tab, choose Edit and change the SnapStart attribute value from None to PublishedVersions.
- Choose Save.
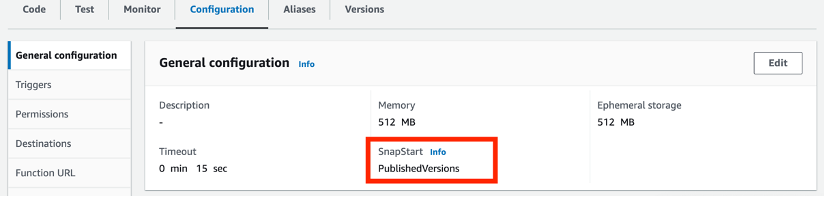
To enable X-Ray via the AWS Management Console:
- Navigate to your Lambda Function.
- On the Configuration tab, scroll down to the Monitoring and operations tools card and choose Edit.
- Under AWS X-Ray, enable Active tracing.
- Choose Save
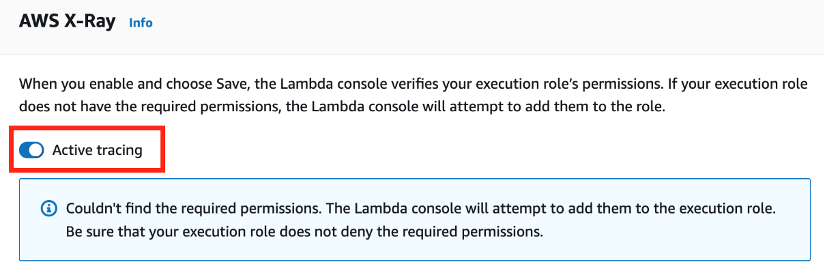
To publish a new version of Lambda function via the AWS Management Console:
- Navigate to your Lambda Function.
- On the Version tab, choose Publish new version.
- Verify that PublishedVersions is shown below SnapStart.
- Choose Publish.

To create an alias for a published version of your Lambda function via the AWS Management Console:
- Navigate to your Lambda Function.
- On the Aliases tab, choose Create alias.
- Provide a Name for an alias and select a Version of your Lambda function to point the alias to.
- Choose Save.

Enabling SnapStart and X-Ray via AWS SAM
To enable SnapStart and X-Ray for Lambda function via AWS SAM:
-
- Enable Lambda function versions and create an alias by adding a AutoPublishAlias property in template.yaml file. AWS SAM automatically publishes a new version for each new deployment and automatically assigns the alias to the newly published version.
Resources: my-function: type: AWS::Serverless::Function Properties: […] AutoPublishAlias: live - Enable SnapStart on Lambda function by adding the SnapStart property in template.yaml file.
Resources: my-function: type: AWS::Serverless::Function Properties: […] SnapStart: ApplyOn: PublishedVersions - Enable X-Ray for Lambda function by adding the Tracing property in template.yaml file.
Resources: my-function: type: AWS::Serverless::Function Properties: […] Tracing: Active
- Enable Lambda function versions and create an alias by adding a AutoPublishAlias property in template.yaml file. AWS SAM automatically publishes a new version for each new deployment and automatically assigns the alias to the newly published version.
You can find the complete AWS SAM template for the preceding example in this GitHub repository.
Using X-Ray to gain insights into SnapStart-enabled Lambda function’s performance
To demonstrate X-Ray integration for your Lambda function with SnapStart, you can build, deploy, and test the sample Hello World application using AWS SAM CLI. To do this, follow the instructions in the README file of the GitHub project.
The build and deployment output with AWS SAM looks like this:

Once your application is deployed to your AWS account, note that SnapStart and X-Ray tracing is enabled for your Lambda function. You should also see an alias `live` created against the published version of your Lambda function.

You should also have an API deployed via API Gateway, which is pointing to the `live` alias of your Lambda function as the backend integration.

Now, invoke your API via `curl` command or any other HTTP client. Make sure to replace the url with your own API’s url.
$ curl --location --request GET https://{rest-api-id}.execute-api.{region}.amazonaws.com/{stage}/hello
Navigate to Amazon CloudWatch and under the X-Ray service map, you see a visual representation of the trace data generated by your application.
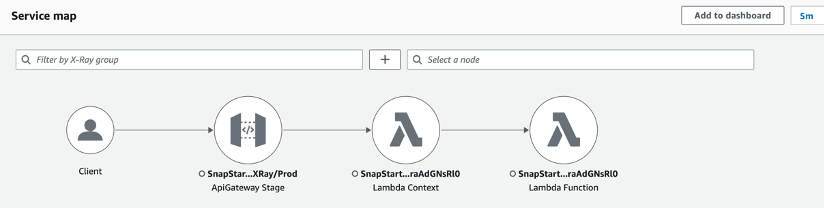
Under Traces, you can see the individual traces, Response code, Response time, Duration, and other useful metrics.

Select a trace ID to see the breakdown of total Duration on your API call.

You can now see the complete trace for the Lambda function’s invocation with breakdown of time taken during each phase. You can see the Restore duration and actual Invocation duration separately.
Restore duration shown in the trace includes the time it takes for Lambda to restore a snapshot on the microVM, load the runtime (JVM), and run any afterRestore hooks if specified in your code. Note that, the process of restoring snapshots can include time spent on activities outside the microVM. This time is not reported in the Restore sub-segment, but is part of the AWS::Lambda segment in X-Ray traces.
This helps you better understand the latency of your Lambda function’s execution, and enables you to identify and troubleshoot the performance issues and errors.
Conclusion
This blog post shows how you can enable AWS X-Ray for your Lambda function enabled with SnapStart, and measure the end-to-end performance of such functions using X-Ray console. You can now see a complete breakdown of your Lambda function’s execution time. This includes Restore duration along with the Invocation duration, which can help you to understand your application’s startup times (cold starts), diagnose slowdowns, or troubleshoot any errors and timeouts.
To learn more about the Lambda SnapStart feature, visit the AWS Lambda Developer Guide.
For more serverless learning resources, visit Serverless Land.
This post is written by Chetan Makvana, Sr. Solutions Architect.
Customers use modular architectural patterns and serverless operational models to build more sustainable, scalable, and resilient applications in modern application development. AWS Lambda is a popular choice for building these applications.
If customers have invested in container tooling for their development workflows, they deploy to Lambda using the container image packaging format for workloads like machine learning inference or data intensive workloads. Using functions deployed as container images, customers benefit from the same operation simplicity, automation scaling, high availability, and native integration with many services.
Containerized applications often have several distinct environments and accounts, such as dev, test, and prod. An application has to go through a process of deployment and testing in these environments. One common pattern for deploying containerized applications is to have a central AWS create a single container image, and carry out deployment across other AWS accounts. To achieve automated deployment of the application across different environments, customers use CI/CD pipelines with familiar container tooling.
This blog post explores how to use AWS Serverless Application Model (AWS SAM) Pipelines to create a CI/CD deployment pipeline and deploy a container-based Lambda function across multiple accounts.
Solution overview
This example comprises three accounts: tooling, test, and prod. The tooling account is a central account where you provision the pipeline, and build the container. The pipeline deploys the container into Lambda in the test and prod accounts using AWS CodeBuild. It also requires the necessary resources in the test and prod account. This consists of an Identity and Access Management (IAM) role that trusts the tooling account and provides the required deployment-specific permissions. AWS CodeBuild assumes this IAM role in the tooling account to carry out deployment.
The solution uses AWS SAM Pipelines to create CI/CD deployment pipeline resources. It provides commands to generate the required AWS infrastructure resources and a pipeline configuration file that CI/CD system can use to deploy using AWS SAM. Find the example code for this solution in the GitHub repository.
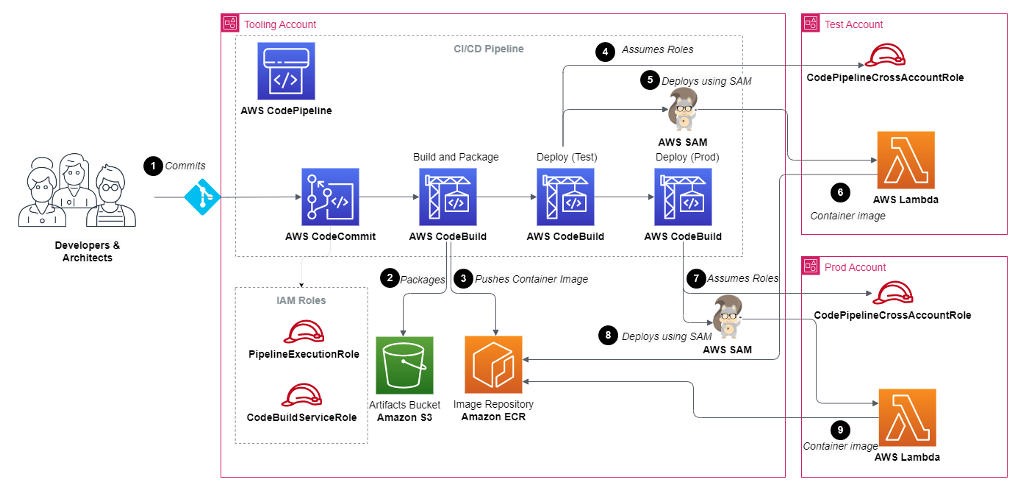
Full solution architecture
AWS CodePipeline goes through these steps to deploy the container-based Lambda function in the test and prod accounts:
- The developer commits the code of Lambda function into AWS CodeCommit or other source control repositories, which triggers the CI/CD workflow.
- AWS CodeBuild builds the code, creates a container image, and pushes the image to the Amazon Elastic Container Registry (ECR) repository using AWS SAM.
- AWS CodeBuild assumes a cross-account role for the test account.
- AWS CodeBuild uses AWS SAM to deploy the Lambda function by pulling image from Amazon ECR.
- If deployment is successful, AWS CodeBuild deploys the same image in prod account using AWS SAM.
Deploying the example
Prerequisites
- An AWS account. The IAM user that you use must have sufficient permissions to make necessary AWS service calls and manage AWS resources.
- AWS CLI installed and configured.
- Git installed.
- AWS SAM installed.
- Setup .aws/credentials named profiles for tooling, test and prod accounts so you can run CLI and AWS SAM commands against them.
- Set the TOOLS\_ACCOUNT\_ID, TEST\_ACCOUNT\_ID, and PROD\_ACCOUNT\_ID env variables:
export TOOLS\_ACCOUNT\_ID=<Tooling Account Id>export TEST\_ACCOUNT\_ID=<Test Account Id>export PROD\_ACCOUNT\_ID=<Prod Account Id>
Creating a Git Repository and pushing the code
Run the following command in the tooling account from your terminal to create a new CodeCommit repository:
aws codecommit create-repository --repository-name lambda-container-repo --profile toolingInitialize the Git repository and push the code.
cd ~/environment/cicd-lambda-containergit init -b maingit add .git commit -m "Initial commit"git remote add origin codecommit://lambda-container-repogit push -u origin mainCreating cross-account roles in test and prod accounts
For the pipeline to gain access to the test and production environment, it must assume an IAM role. In cross-account scenario, the IAM role for the pipeline must be created on the test and production accounts.
Change directory to the directory templates and run the following command to deploy roles to test and prod using respective named profiles.
Test Profile
cd ~/environment/cicd-lambda-container/templatesaws cloudformation deploy --template-file crossaccount\_pipeline\_roles.yml --stack-name codepipeline-crossaccount-roles --capabilities CAPABILITY\_NAMED\_IAM --profile test --parameter-overrides ToolAccountID=${TOOLS\_ACCOUNT\_ID}aws cloudformation describe-stacks --stack-name codepipeline-crossaccount-roles --query "Stacks[0].Outputs" --output json --profile testOpen the codepipeline\_parameters.json file from the root directory. Replace the value of TestCodePipelineCrossAccountRoleArn and TestCloudFormationCrossAccountRoleArn with the CloudFormation output value of CodePipelineCrossAccountRole and CloudFormationCrossAccountRole respectively.
Prod Profile
aws cloudformation deploy --template-file crossaccount\_pipeline\_roles.yml --stack-name codepipeline-crossaccount-roles --capabilities CAPABILITY\_NAMED\_IAM --profile prod --parameter-overrides ToolAccountID=${TOOLS\_ACCOUNT\_ID}aws cloudformation describe-stacks --stack-name codepipeline-crossaccount-roles --query "Stacks[0].Outputs" --output json --profile prodOpen the codepipeline\_parameters.json file from the root directory. Replace the value of ProdCodePipelineCrossAccountRoleArn and ProdCloudFormationCrossAccountRoleArn with the CloudFormation output value of CodePipelineCrossAccountRole and CloudFormationCrossAccountRole respectively.
Creating the required IAM roles and infrastructure in the tooling account
Change to the templates directory and run the following command using tooling named profile:
aws cloudformation deploy --template-file tooling\_resources.yml --stack-name tooling-resources --capabilities CAPABILITY\_NAMED\_IAM --parameter-overrides TestAccountID=${TEST\_ACCOUNT\_ID} ProdAccountID=${PROD\_ACCOUNT\_ID} --profile toolingaws cloudformation describe-stacks --stack-name tooling-resources --query "Stacks[0].Outputs" --output json --profile toolingOpen the codepipeline\_parameters.json file from the root directory. Replace value of ImageRepositoryURI, ArtifactsBucket, ToolingCodePipelineExecutionRoleArn, and ToolingCloudFormationExecutionRoleArn with the corresponding CloudFormation output value.
Updating cross-account IAM roles
The cross-account IAM roles on the test and production account require permission to access artifacts that contain application code (S3 bucket and ECR repository). Note that the cross-account roles are deployed twice. This is because there is a circular dependency on the roles in the test and prod accounts and the pipeline artifact resources provisioned in the tooling account.
The pipeline must reference and resolve the ARNs of the roles it needs to assume to deploy the application to the test and prod accounts, so the roles must be deployed before the pipeline is provisioned. However, the policies attached to the roles need to include the S3 bucket and ECR repository. But the S3 bucket and ECR repository don’t exist until the resources deploy in the preceding step. By deploying the roles twice, once without a policy so their ARNs resolve, and a second time to attach policies to the existing roles that reference the resources in the tooling account.
Replace ImageRepositoryArn and ArtifactBucketArn with output value from the above step in the below command and run it from the templates directory using Test and Prod named profiles.
Test Profile
aws cloudformation deploy --template-file crossaccount\_pipeline\_roles.yml --stack-name codepipeline-crossaccount-roles --capabilities CAPABILITY\_NAMED\_IAM --profile test --parameter-overrides ToolAccountID=${TOOLS\_ACCOUNT\_ID} ImageRepositoryArn=<ImageRepositoryArn value> ArtifactsBucketArn=<ArtifactsBucketArn value>Prod Profile
aws cloudformation deploy --template-file crossaccount\_pipeline\_roles.yml --stack-name codepipeline-crossaccount-roles --capabilities CAPABILITY\_NAMED\_IAM --profile prod --parameter-overrides ToolAccountID=${TOOLS\_ACCOUNT\_ID} ImageRepositoryArn=<ImageRepositoryArn value> ArtifactsBucketArn=<ArtifactsBucketArn value>Deploying the pipeline
Replace DeploymentRegion value with the current Region and CodeCommitRepositoryName value with the CodeCommit repository name in codepipeline\_parameters.json file.
Push the changes to CodeCommit repository using Git commands.
Replace CodeCommitRepositoryName value with the CodeCommit repository name created in the first step and run the following command from the root directory of the project using tooling named profile.
sam deploy -t codepipeline.yaml --stack-name cicd-lambda-container-pipeline --capabilities=CAPABILITY\_IAM --parameter-overrides CodeCommitRepositoryName=<CodeCommit Repository Name> --profile toolingCleaning Up
- Run the following command in root directory of the project to delete the pipeline:
sam delete --stack-name cicd-lambda-container-pipeline --profile tooling - Empty the artifacts bucket. Replace the artifacts bucket name with the output value from the preceding step:
aws s3 rm s3://<Arifacts bucket name> --recursive --profile tooling - Delete the Lambda functions from the test and prod accounts:
aws cloudformation delete-stack --stack-name lambda-container-app-test --profile testaws cloudformation delete-stack --stack-name lambda-container-app-prod --profile prod - Delete cross-account roles from the test and prod accounts:
aws cloudformation delete-stack --stack-name codepipeline-crossaccount-roles --profile testaws cloudformation delete-stack --stack-name codepipeline-crossaccount-roles --profile prod - Delete the ECR repository:
aws ecr delete-repository --repository-name image-repository --profile tooling --force - Delete resources from the tooling account:
aws cloudformation delete-stack --stack-name tooling-resources --profile tooling
Conclusion
This blog post discusses how to automate deployment of container-based Lambda across multiple accounts using AWS SAM Pipelines.
Navigate to the GitHub repository and review the implementation to see how CodePipeline pushes container image to Amazon ECR, and deploys image to Lambda using cross-account role. Examine the codepipeline.yml file to see how the AWS SAM Pipelines creates CI/CD resources using this template.
For more serverless learning resources, visit Serverless Land.
Anthony Liguori is an AWS VP and Distinguished Engineer for EC2.
Customers around the world trust AWS to keep their data safe, and keeping their workloads secure and confidential is foundational to how we operate. Since the inception of AWS, we have relentlessly innovated on security, privacy tools, and practices to meet, and even exceed, our customers’ expectations.
The AWS Nitro System is the underlying platform for all modern AWS compute instances which has allowed us to deliver the data isolation, performance, cost, and pace of innovation that our customers require. It’s a pioneering design of specialized hardware and software that protects customer code and data from unauthorized access during processing.
When we launched the Nitro System in 2017, we delivered a unique architecture that restricts any operator access to customer data. This means no person, or even service, from AWS can access data when it is being used in an Amazon EC2 instance. We knew that designing the system this way would present several architectural and operational challenges for us. However, we also knew that protecting customers’ data in this way was the best way to support our customer’s needs.
When AWS made its Digital Sovereignty Pledge last year, we committed to providing greater transparency and assurances to customers about how AWS services are designed and operated, especially when it comes to handling customer data. As part of that increased transparency, we engaged NCC Group, a leading cybersecurity consulting firm based in the United Kingdom, to conduct an independent architecture review of the Nitro System and the security assurances we make to our customers. NCC has now issued its report and affirmed our claims.
The report states, “As a matter of design, NCC Group found no gaps in the Nitro System that would compromise [AWS] security claims.” Specifically, the report validates the following statements about our Nitro System production hosts:
- There is no mechanism for a cloud service provider employee to log in to the underlying host.
- No administrative API can access customer content on the underlying host.
- There is no mechanism for a cloud service provider employee to access customer content stored on instance storage and encrypted EBS volumes.
- There is no mechanism for a cloud service provider employee to access encrypted data transmitted over the network.
- Access to administrative APIs always requires authentication and authorization.
- Access to administrative APIs is always logged.
- Hosts can only run tested and signed software that is deployed by an authenticated and authorized deployment service. No cloud service provider employee can deploy code directly onto hosts.
The report details NCC’s analysis for each of these claims. You can also find additional details about the scope, methodology, and steps that NCC used to evaluate the claims.
How Nitro System protects customer data
At AWS, we know that our customers, especially those who have sensitive or confidential data, may have worries about putting that data in the cloud. That’s why we’ve architected the Nitro System to ensure that your confidential information is as secure as possible. We do this in several ways:
There is no mechanism for any system or person to log in to Amazon EC2 servers, read the memory of EC2 instances, or access any data on encrypted Amazon Elastic Block Store (EBS) volumes.
If any AWS operator, including those with the highest privileges, needs to perform maintenance work on the EC2 server, they can do so only by using a strictly limited set of authenticated, authorized, and audited administrative APIs. Critically, none of these APIs have the ability to access customer data on the EC2 server. These restrictions are built into the Nitro System itself, and no AWS operator can circumvent these controls and protections.
The Nitro System also protects customers from AWS system software through the innovative design of our lightweight Nitro Hypervisor, which manages memory and CPU allocation. Typical commercial hypervisors provide administrators with full access to the system, but with the Nitro System, the only interface operators can use is a restricted API. This means that customers and operators cannot interact with the system in unapproved ways and there is no equivalent of a “root” user. This approach enhances security and allows AWS to update systems in the background, fix system bugs, monitor performance, and even perform upgrades without impacting customer operations or customer data. Customers are unaffected during system upgrades, and their data remains protected.
Finally, the Nitro System can also provide customers an extra layer of data isolation from their own operators and software. AWS created AWS Nitro Enclaves, which allow for isolated compute environments, which is ideal for organizations that need to process personally identifiable information, as well as healthcare, financial, and intellectual property data within their compute instances. These enclaves do not share memory or CPU cores with the customer instance. Further, Nitro Enclaves have cryptographic attestation capabilities that let customers verify that all of the software deployed has been validated and not compromised.
All of these prongs of the Nitro System’s security and confidential compute capabilities required AWS to invest time and resources into building the system’s architecture. We did so because we wanted to ensure that our customers felt confident entrusting us with their most sensitive and confidential data, and we have worked to continue earning that trust. We are not done and this is just one step AWS is taking to increase the transparency about how our services are designed and operated. We will continue to innovate on and deliver unique features that further enhance our customers’ security without compromising on performance.
Learn more:
Watch Anthony speak about AWS Nitro System Security here.
- Read the NCC report.
- Read this whitepaper on the security design of the AWS Nitro System.
- Please visit this webpage to learn more about our ongoing commitment to Digital Sovereignty
- Read Matt Garman’s blog about the NCC Report.
- We’d love to hear your thoughts and feedback
This post is written by Dhiraj Mahapatro, Principal Specialist SA, and Sascha Moellering, Principal Specialist SA, and Emily Shea, WW Lead, Integration Services.
Many serverless services are a natural fit for event-driven architectures (EDA), as events invoke them and only run when there is an event to process. When building in the cloud, many services emit events by default and have built-in features for managing events. This combination allows customers to build event-driven architectures easier and faster than ever before.
The insurance claims processing sample application in this blog series uses event-driven architecture principles and serverless services like AWS Lambda, AWS Step Functions, Amazon API Gateway, Amazon EventBridge, and Amazon SQS.
When building an event-driven architecture, it’s likely that you have existing services to integrate with the new architecture, ideally without needing to make significant refactoring changes to those services. As services communicate via events, extending applications to new and existing microservices is a key benefit of building with EDA. You can write those microservices in different programming languages or running on different compute options.
This blog post walks through a scenario of integrating an existing, containerized service (a settlement service) to the serverless, event-driven insurance claims processing application described in this blog post.
Overview of sample event-driven architecture
The sample application uses a front-end to sign up a new user and allow the user to upload images of their car and driver’s license. Once signed up, they can file a claim and upload images of their damaged car. Previously, it did not yet integrate with a settlement service for completing the claims and settlement process.
In this scenario, the settlement service is a brownfield application that runs Spring Boot 3 on Amazon ECS with AWS Fargate. AWS Fargate is a serverless, pay-as-you-go compute engine that lets you focus on building container applications without managing servers.
The Spring Boot application exposes a REST endpoint, which accepts a POST request. It applies settlement business logic and creates a settlement record in the database for a car insurance claim. Your goal is to make settlement work with the new EDA application that is designed for claims processing without re-architecting or rewriting. Customer, claims, fraud, document, and notification are the other domains that are shown as blue-colored boxes in the following diagram:

Project structure
The application uses AWS Cloud Development Kit (CDK) to build the stack. With CDK, you get the flexibility to create modular and reusable constructs imperatively using your language of choice. The sample application uses TypeScript for CDK.
The following project structure enables you to build different bounded contexts. Event-driven architecture relies on the choreography of events between domains. The object oriented programming (OOP) concept of CDK helps provision the infrastructure to separate the domain concerns while loosely coupling them via events.
You break the higher level CDK constructs down to these corresponding domains:
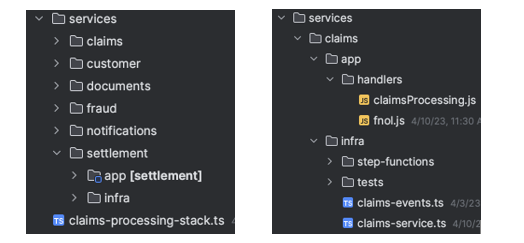
Application and infrastructure code are present in each domain. This project structure creates a seamless way to add new domains like settlement with its application and infrastructure code without affecting other areas of the business.
With the preceding structure, you can use the settlement-service.ts CDK construct inside claims-processing-stack.ts:
const settlementService = new SettlementService(this, "SettlementService", { bus,});The only information the SettlementService construct needs to work is the EventBridge custom event bus resource that is created in the claims-processing-stack.ts.
To run the sample application, follow the setup steps in the sample application’s README file.
Existing container workload
The settlement domain provides a REST service to the rest of the organization. A Docker containerized Spring Boot application runs on Amazon ECS with AWS Fargate. The following sequence diagram shows the synchronous request-response flow from an external REST client to the service:

- External REST client makes POST /settlement call via an HTTP API present in front of an internal Application Load Balancer (ALB).
- SettlementController.java delegates to SettlementService.java.
- SettlementService applies business logic and calls SettlementRepository for data persistence.
- SettlementRepository persists the item in the Settlement DynamoDB table.
A request to the HTTP API endpoint looks like:
curl --location <settlement-api-endpoint-from-cloudformation-output> \--header 'Content-Type: application/json' \--data '{ "customerId": "06987bc1-1234-1234-1234-2637edab1e57", "claimId": "60ccfe05-1234-1234-1234-a4c1ee6fcc29", "color": "green", "damage": "bumper\_dent"}'The response from the API call is:

You can learn more here about optimizing Spring Boot applications on AWS Fargate.
Extending container workload for events
To integrate the settlement service, you must update the service to receive and emit events asynchronously. The core logic of the settlement service remains the same. When you file a claim, upload damaged car images, and the application detects no document fraud, the settlement domain subscribes to Fraud.Not.Detected event and applies its business logic. The settlement service emits an event back upon applying the business logic.
The following sequence diagram shows a new interface in settlement to work with EDA. The settlement service subscribes to events that a producer emits. Here, the event producer is the fraud service that puts an event in an EventBridge custom event bus.

- Producer emits Fraud.Not.Detected event to EventBridge custom event bus.
- EventBridge evaluates the rules provided by the settlement domain and sends the event payload to the target SQS queue.
- SubscriberService.java polls for new messages in the SQS queue.
- On message, it transforms the message body to an input object that is accepted by SettlementService.
- It then delegates the call to SettlementService, similar to how SettlementController works in the REST implementation.
- SettlementService applies business logic. The flow is like the REST use case from 7 to 10.
- On receiving the response from the SettlementService, the SubscriberService transforms the response to publish an event back to the event bus with the event type as
Settlement.Finalized.
The rest of the architecture consumes this Settlement.Finalized event.
Using EventBridge schema registry and discovery
Schema enforces a contract between a producer and a consumer. A consumer expects the exact structure of the event payload every time an event arrives. EventBridge provides schema registry and discovery to maintain this contract. The consumer (the settlement service) can download the code bindings and use them in the source code.
Enable schema discovery in EventBridge before downloading the code bindings and using them in your repository. The code bindings provide a marshaller that unmarshals the incoming event from SQS queue to a plain old Java object (POJO) FraudNotDetected.java. You download the code bindings using the choice of your IDE. AWS Toolkit for IntelliJ makes it convenient to download and use them.

The final architecture for the settlement service with REST and event-driven architecture looks like:
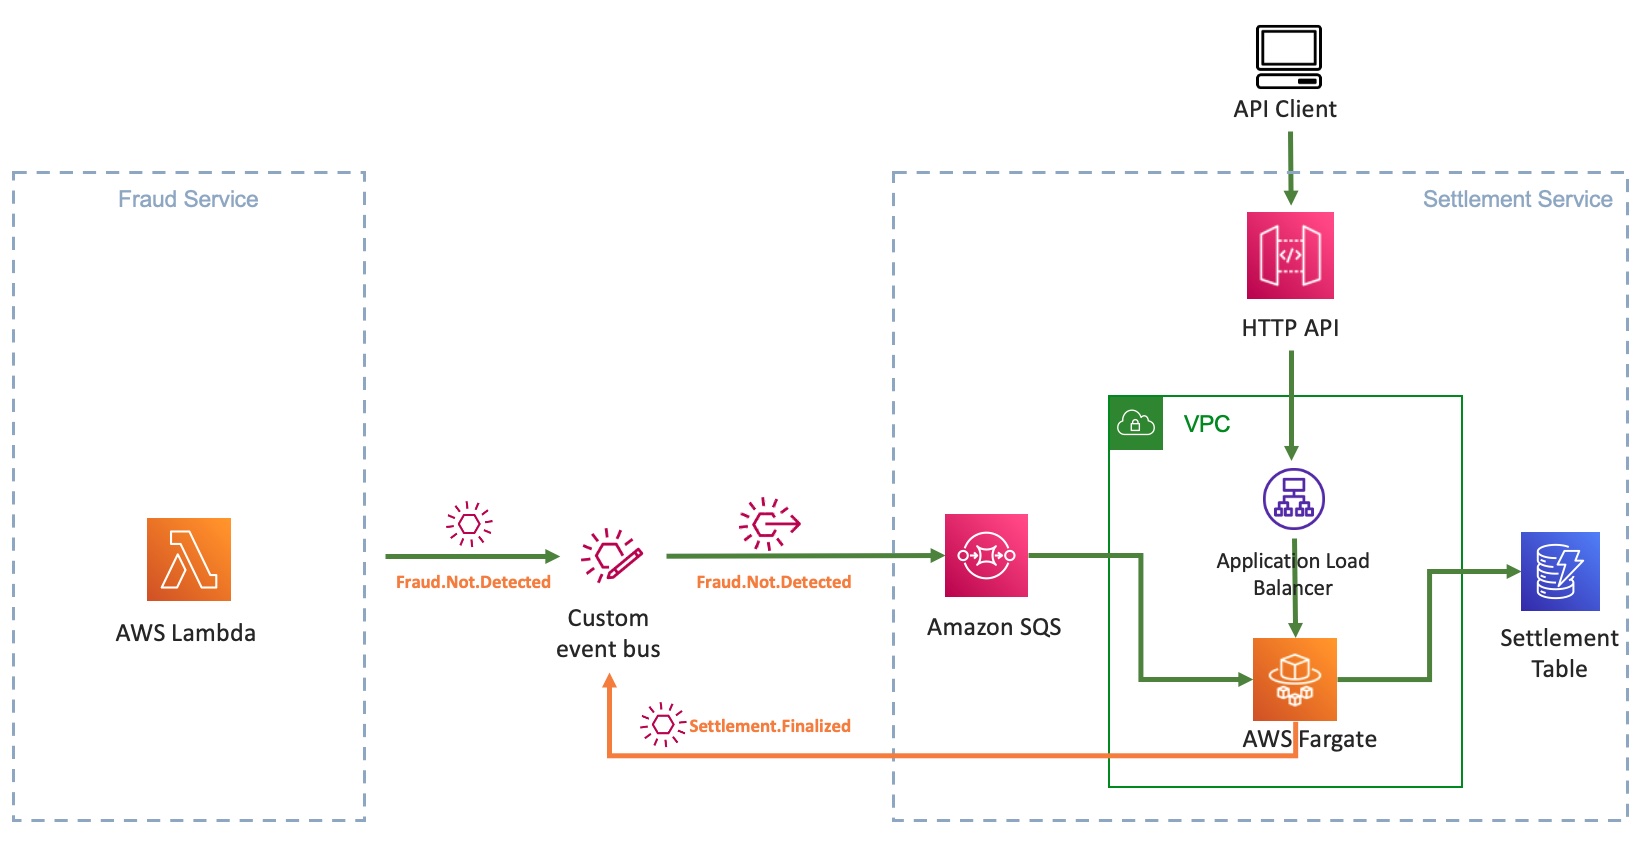
Transition to become fully event-driven
With the new capability to handle events, the Spring Boot application now supports both the REST endpoint and the event-driven architecture by running the same business logic through different interfaces. In this example scenario, as the event-driven architecture matures and the rest of the organization adopts it, the need for the POST endpoint to save a settlement may diminish. In the future, you can deprecate the endpoint and fully rely on polling messages from the SQS queue.
You start with using an ALB and Fargate service CDK ECS pattern:
const loadBalancedFargateService = new ecs\_patterns.ApplicationLoadBalancedFargateService( this, "settlement-service", { cluster: cluster, taskImageOptions: { image: ecs.ContainerImage.fromDockerImageAsset(asset), environment: { "DYNAMODB\_TABLE\_NAME": this.table.tableName }, containerPort: 8080, logDriver: new ecs.AwsLogDriver({ streamPrefix: "settlement-service", mode: ecs.AwsLogDriverMode.NON\_BLOCKING, logRetention: RetentionDays.FIVE\_DAYS, }) }, memoryLimitMiB: 2048, cpu: 1024, publicLoadBalancer: true, desiredCount: 2, listenerPort: 8080 });To adapt to EDA, you update the resources to retrofit the SQS queue to receive messages and EventBridge to put events. Add new environment variables to the ApplicationLoadBalancerFargateService resource:
environment: { "SQS\_ENDPOINT\_URL": queue.queueUrl, "EVENTBUS\_NAME": props.bus.eventBusName, "DYNAMODB\_TABLE\_NAME": this.table.tableName}Grant the Fargate task permission to put events in the custom event bus and consume messages from the SQS queue:
props.bus.grantPutEventsTo(loadBalancedFargateService.taskDefinition.taskRole);queue.grantConsumeMessages(loadBalancedFargateService.taskDefinition.taskRole);When you transition the settlement service to become fully event-driven, you do not need the HTTP API endpoint and ALB anymore, as SQS is the source of events.
A better alternative is to use QueueProcessingFargateService ECS pattern for the Fargate service. The pattern provides auto scaling based on the number of visible messages in the SQS queue, besides CPU utilization. In the following example, you can also add two capacity provider strategies while setting up the Fargate service: FARGATE\_SPOT and FARGATE. This means, for every one task that is run using FARGATE, there are two tasks that use FARGATE\_SPOT. This can help optimize cost.
const queueProcessingFargateService = new ecs\_patterns.QueueProcessingFargateService(this, 'Service', { cluster, memoryLimitMiB: 1024, cpu: 512, queue: queue, image: ecs.ContainerImage.fromDockerImageAsset(asset), desiredTaskCount: 2, minScalingCapacity: 1, maxScalingCapacity: 5, maxHealthyPercent: 200, minHealthyPercent: 66, environment: { "SQS\_ENDPOINT\_URL": queueUrl, "EVENTBUS\_NAME": props?.bus.eventBusName, "DYNAMODB\_TABLE\_NAME": tableName }, capacityProviderStrategies: [ { capacityProvider: 'FARGATE\_SPOT', weight: 2, }, { capacityProvider: 'FARGATE', weight: 1, }, ],});This pattern abstracts the automatic scaling behavior of the Fargate service based on the queue depth.
Running the application
To test the application, follow How to use the Application after the initial setup. Once complete, you see that the browser receives a Settlement.Finalized event:
{ "version": "0", "id": "e2a9c866-cb5b-728c-ce18-3b17477fa5ff", "detail-type": "Settlement.Finalized", "source": "settlement.service", "account": "123456789", "time": "2023-04-09T23:20:44Z", "region": "us-east-2", "resources": [], "detail": { "settlementId": "377d788b-9922-402a-a56c-c8460e34e36d", "customerId": "67cac76c-40b1-4d63-a8b5-ad20f6e2e6b9", "claimId": "b1192ba0-de7e-450f-ac13-991613c48041", "settlementMessage": "Based on our analysis on the damage of your car per claim id b1192ba0-de7e-450f-ac13-991613c48041, your out-of-pocket expense will be $100.00." }}Cleaning up
The stack creates a custom VPC and other related resources. Be sure to clean up resources after usage to avoid the ongoing cost of running these services. To clean up the infrastructure, follow the clean-up steps shown in the sample application.
Conclusion
The blog explains a way to integrate existing container workload running on AWS Fargate with a new event-driven architecture. You use EventBridge to decouple different services from each other that are built using different compute technologies, languages, and frameworks. Using AWS CDK, you gain the modularity of building services decoupled from each other.
This blog shows an evolutionary architecture that allows you to modernize existing container workloads with minimal changes that still give you the additional benefits of building with serverless and EDA on AWS.
The major difference between the event-driven approach and the REST approach is that you unblock the producer once it emits an event. The event producer from the settlement domain that subscribes to that event is loosely coupled. The business functionality remains intact, and no significant refactoring or re-architecting effort is required. With these agility gains, you may get to the market faster
The sample application shows the implementation details and steps to set up, run, and clean up the application. The app uses ECS Fargate for a domain service, but you do not limit it to just Fargate. You can also bring container-based applications running on Amazon EKS similarly to event-driven architecture.
Learn more about event-driven architecture on Serverless Land.
This blog is written by Thomas Moore, Senior Solutions Architect and Josh Hart, Senior Solutions Architect.
Applications often require a way for users to upload files. The traditional approach is to use an SFTP service (such as the AWS Transfer Family), but this requires specific clients and management of SSH credentials. Modern applications instead need a way to upload to Amazon S3 via HTTPS. Typical file upload use cases include:
- Sharing datasets between businesses as a direct replacement for traditional FTP workflows.
- Uploading telemetry and logs from IoT devices and mobile applications.
- Uploading media such as videos and images.
- Submitting scanned documents and PDFs.
If you have control over the application that sends the uploads, then you can integrate with the AWS SDK from within the browser with a framework such as AWS Amplify. To learn more, read Allowing external users to securely and directly upload files to Amazon S3.
Often you must provide end users direct access to upload files via an endpoint. You could build a bespoke service for this purpose, but this results in more code to build, maintain, and secure.
This post explores three different approaches to securely upload content to an Amazon S3 bucket via HTTPS without the need to build a dedicated API or client application.
Using Amazon API Gateway as a direct proxy
The simplest option is to use API Gateway to proxy an S3 bucket. This allows you to expose S3 objects as REST APIs without additional infrastructure. By configuring an S3 integration in API Gateway, this allows you to manage authentication, authorization, caching, and rate limiting more easily.
This pattern allows you to implement an authorizer at the API Gateway level and requires no changes to the client application or caller. The limitation with this approach is that API Gateway has a maximum request payload size of 10 MB. For step-by-step instructions to implement this pattern, see this knowledge center article.
This is an example implementation (you can deploy this from Serverless Land):

Using API Gateway with presigned URLs
The second pattern uses S3 presigned URLs, which allow you to grant access to S3 objects for a specific period, after which the URL expires. This time-bound access helps prevent unauthorized access to S3 objects and provides an additional layer of security.
They can be used to control access to specific versions or ranges of bytes within an object. This granularity allows you to fine-tune access permissions for different users or applications, and ensures that only authorized parties have access to the required data.
This avoids the 10 MB limit of API Gateway as the API is only used to generate the presigned URL, which is then used by the caller to upload directly to S3. Presigned URLs are straightforward to generate and use programmatically, but it does require the client to make two separate requests: one to generate the URL and one to upload the object. To learn more, read Uploading to Amazon S3 directly from a web or mobile application.
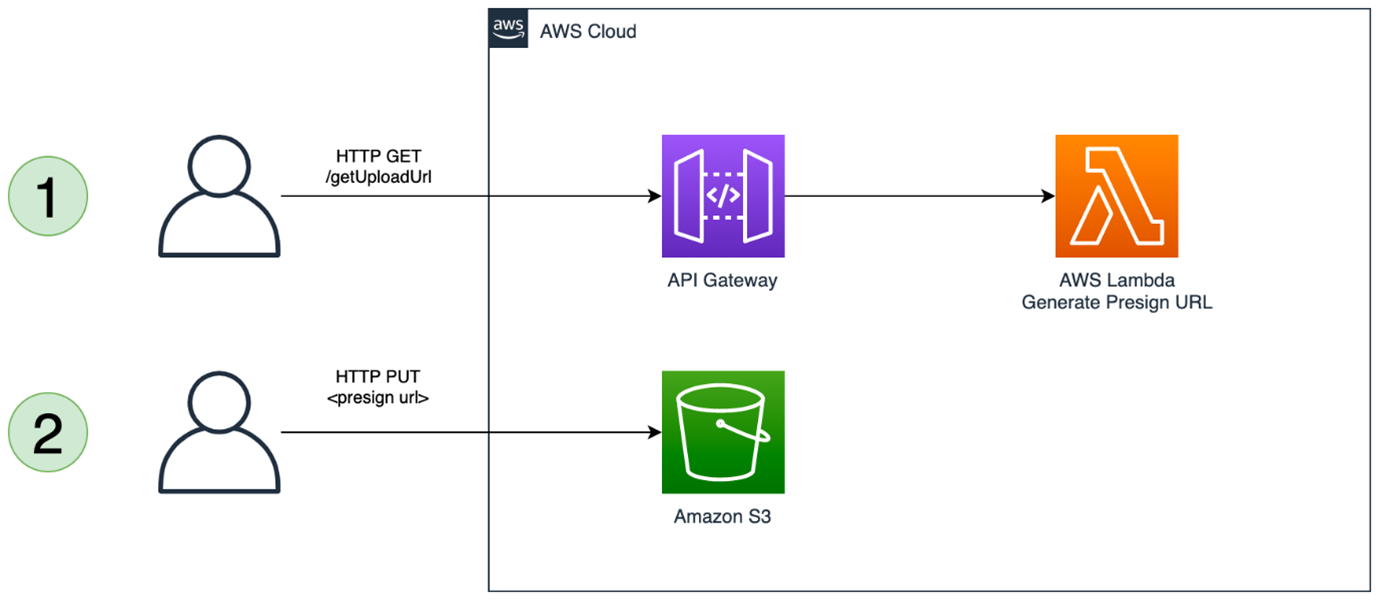
This pattern is limited by the 5GB maximum request size of the S3 Put Object API call. One way to work around this limit with this pattern is to leverage S3 multipart uploads. This requires that the client split the payload into multiple segments and send a separate request for each part.
This adds some complexity to the client and is used by libraries such as AWS Amplify that abstract away the multipart upload implementation. This allows you to upload objects up to 5TB in size. For more details, see uploading large objects to Amazon S3 using multipart upload and transfer acceleration.
An example of this pattern is available on Serverless Land.
Using Amazon CloudFront with Lambda@Edge
The final pattern leverages Amazon CloudFront instead of API Gateway. CloudFront is primarily a content delivery network (CDN) that caches and delivers content from an S3 bucket or other origin. However, CloudFront can also be used to upload data to an S3 bucket. Without any additional configuration, this would essentially make the S3 bucket publicly writable. To secure the solution so that only authenticated users can upload objects, you can use a Lambda@Edge function to verify the users’ permissions.
The maximum size of the object that you can upload with this pattern is 5GB. If you need to upload files larger than 5GB, then you must use multipart uploads. To implement this, deploy the example Serverless Land pattern:

This pattern uses an origin access identity (OAI) to limit access to the S3 bucket to only come from CloudFront. The default OAI has s3:GetObject permission, which is changed to s3:PutObject to allow uploads explicitly and prevent and read operations:
{ "Version": "2008-10-17", "Id": "PolicyForCloudFrontPrivateContent", "Statement": [ { "Sid": "1", "Effect": "Allow", "Principal": { "AWS": "arn:aws:iam::cloudfront:user/CloudFront Origin Access Identity <origin access identity ID>" }, "Action": [ "s3:PutObject" ], "Resource": "arn:aws:s3::: DOC-EXAMPLE-BUCKET/*" } ]}As CloudFront is not used to cache content, the managed cache policy is set to CachingDisabled.
There are multiple options for implementing the authorization in the Lambda@Edge function. The sample repository uses an Amazon Cognito authorizer that validates a JSON Web Token (JWT) sent as an HTTP authorization header.
Using a JWT is secure as it implies this token is dynamically vended by an Identity Provider, such as Amazon Cognito. This does mean that the caller needs a mechanism to obtain this JWT token. You are in control of this authorizer function, and the exact implementation depends on your use-case. You could instead use an API Key or integrate with an alternate identity provider such as Auth0 or Okta.
Lambda@Edge functions do not currently support environment variables. This means that the configuration parameters are dynamically resolved at runtime. In the example code, AWS Systems Manager Parameter Store is used to store the Amazon Cognito user pool ID and app client ID that is required for the token verification. For more details on how to choose where to store your configuration parameters, see Choosing the right solution for AWS Lambda external parameters.
To verify the JWT token, the example code uses the aws-jwt-verify package. This supports JWTs issued by Amazon Cognito and third-party identity providers.
The Serverless Land pattern uses an Amazon Cognito identity provider to do authentication in the Lambda@Edge function. This code snippet shows an example using a pre-shared key for basic authorization:
import jsondef lambda\_handler(event, context): print(event) response = event["Records"][0]["cf"]["request"] headers = response["headers"] if 'authorization' not in headers or headers['authorization'] == None: return unauthorized() if headers['authorization'] == 'my-secret-key': return request return response def unauthorized(): response = { 'status': "401", 'statusDescription': 'Unauthorized', 'body': 'Unauthorized' } return responseThe Lambda function is associated with the CloudFront distribution by creating a Lambda trigger. The CloudFront event is set Viewer request to meaning the function is invoked in reaction to PUT events from the client.
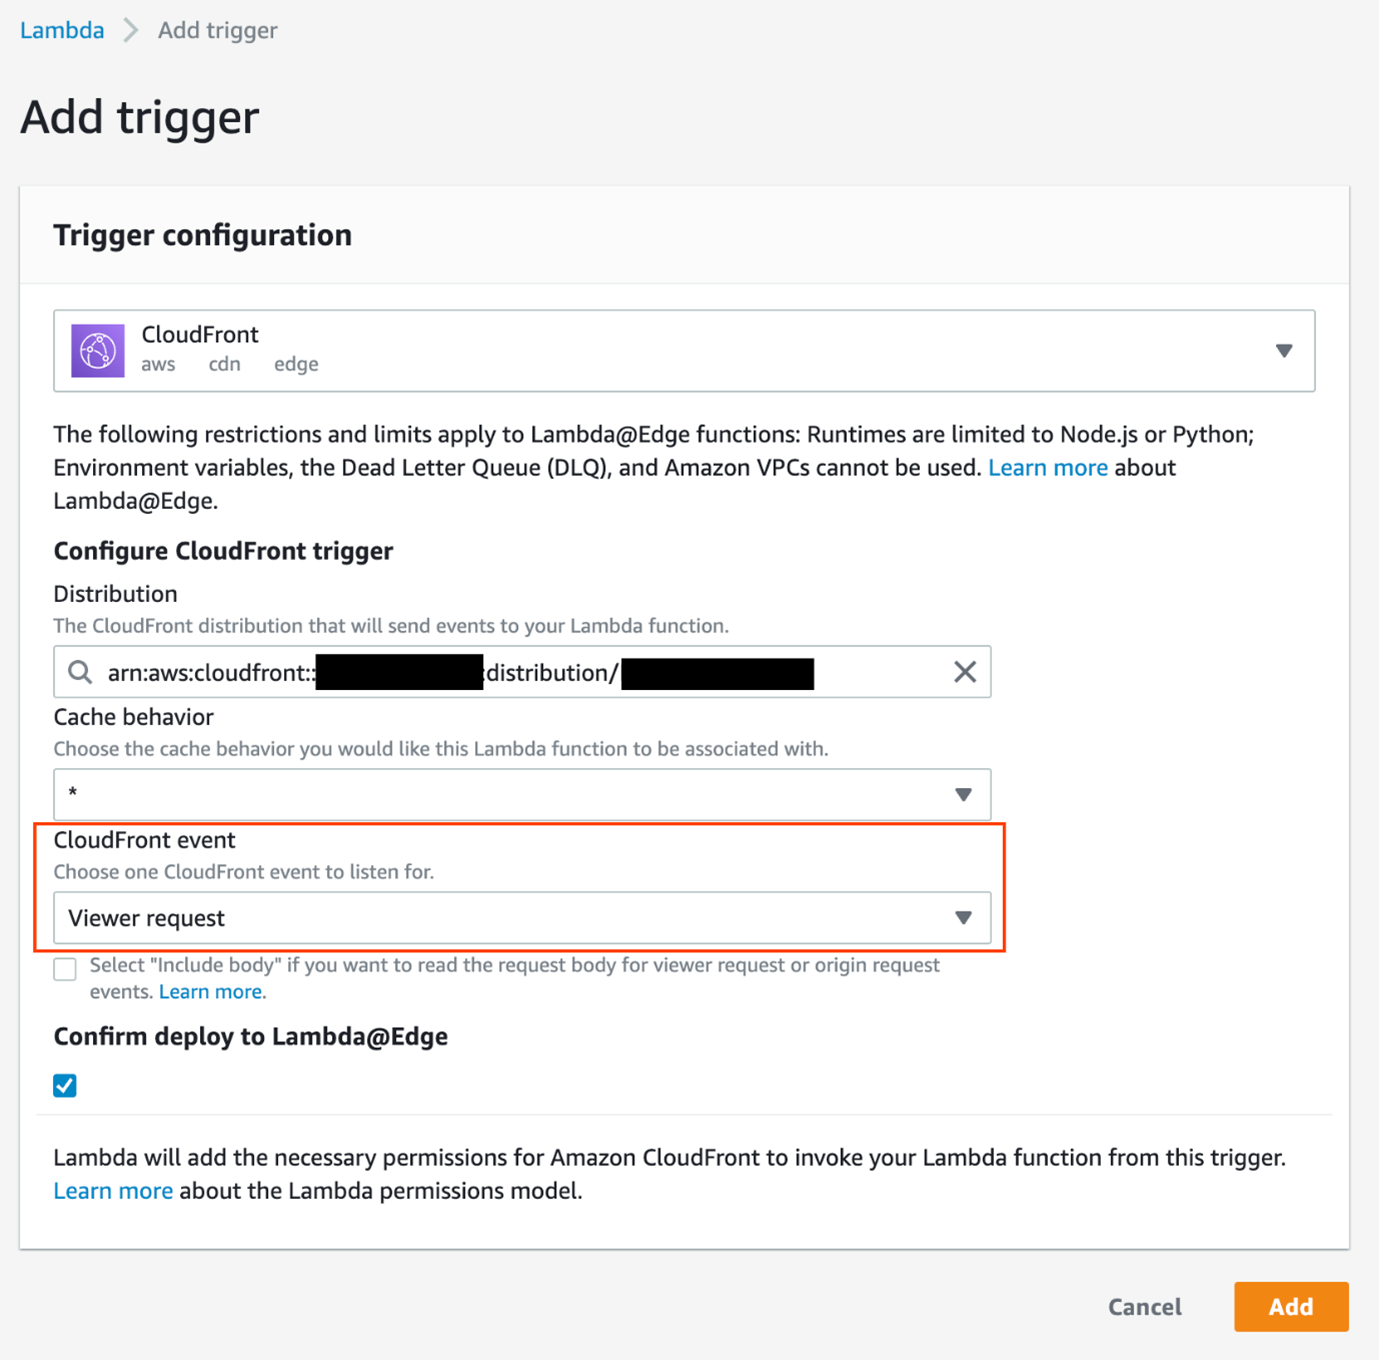
The solution can be tested with an API testing client, such as Postman. In Postman, issue a PUT request to https://<your-cloudfront-domain>/<object-name> with a binary payload as the body. You receive a 401 Unauthorized response.
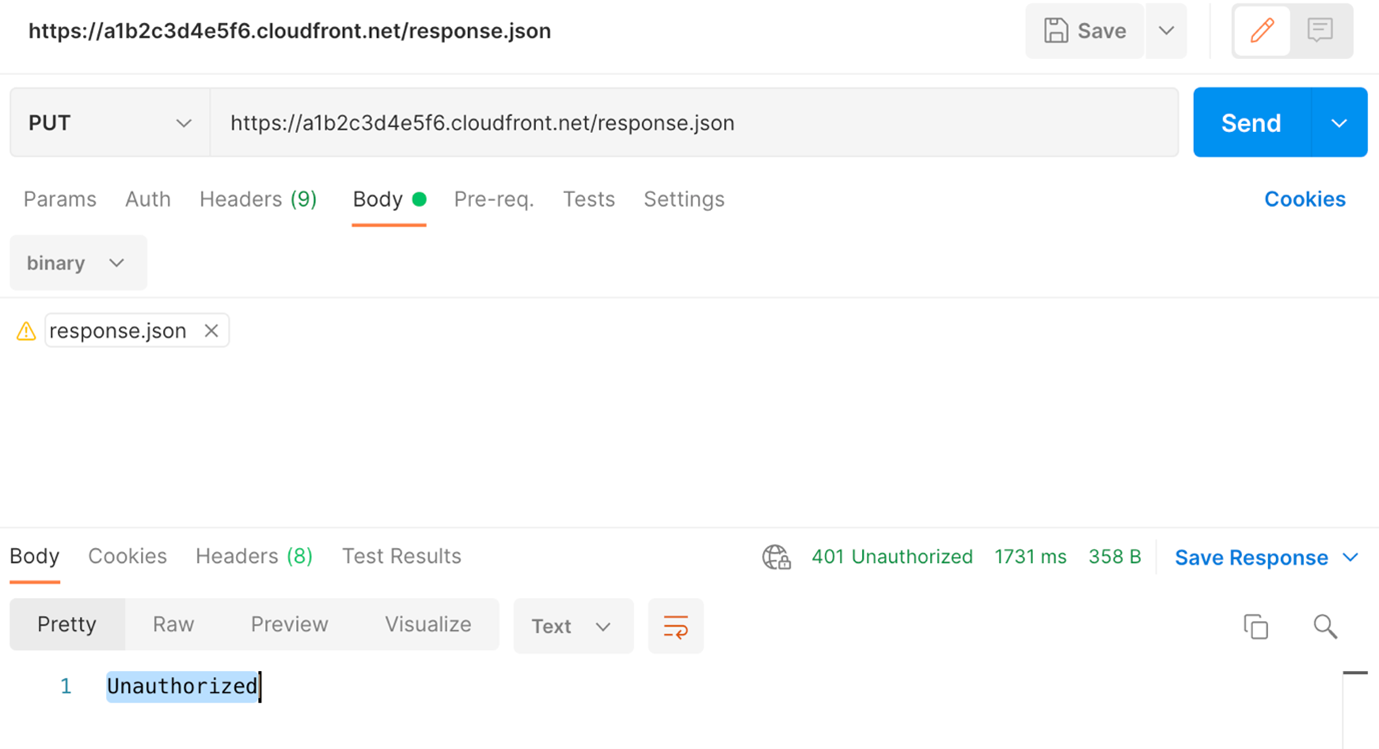
Next, add the Authorization header with a valid token and submit the request again. For more details on how to obtain a JWT from Amazon Cognito, see the README in the repository. Now the request works and you receive a 200 OK message.
To troubleshoot, the Lambda function logs to Amazon CloudWatch Logs. For Lambda@Edge functions, look for the logs in the Region closest to the request, and not the same Region as the function.
The Lambda@Edge function in this example performs basic authorization. It validates the user has access to the requested resource. You can perform any custom authorization action here. For example, in a multi-tenant environment, you could restrict the prefix so that specific tenants only have permission to write to their own prefix, and validate the requested object name in the function.
Additionally, you could implement controls traditionally performed by the API Gateway such as throttling by tenant or user. Another use for the function is to validate the file type. If users can only upload images, you could validate the content-length to ensure the images are a certain size and the file extension is correct.
Conclusion
Which option you choose depends on your use case. This table summarizes the patterns discussed in this blog post:
| API Gateway as a proxy | Presigned URLs with API Gateway | CloudFront with Lambda@Edge | |
| Max Object Size | 10 MB | 5 GB (5 TB with multipart upload) | 5 GB |
| Client Complexity | Single HTTP Request | Multiple HTTP Requests | Single HTTP Request |
| Authorization Options | Amazon Cognito, IAM, Lambda Authorizer | Amazon Cognito, IAM, Lambda Authorizer | Lambda@Edge |
| Throttling | API Key throttling | API Key throttling | Custom throttling |
Each of the available methods has its strengths and weaknesses and the choice of which one to use depends on your specific needs. The maximum object size supported by S3 is 5 TB, regardless of which method you use to upload objects. Additionally, some methods have more complex configuration that requires more technical expertise. Considering these factors with your specific use-case can help you make an informed decision on the best API option for uploading to S3.
For more serverless learning resources, visit Serverless Land.
This blog post is written by Abeer Naffa’, Sr. Solutions Architect, Solutions Builder AWS, David Filiatrault, Principal Security Consultant, and Jared Thompson Hybrid Edge SA Specialist.
In this post, we discuss how you can leverage AWS Control Tower landing zone and AWS Organizations custom policies – guardrails – at the root level, known as Service Control Policies (SCPS) to enable certain data residency requirements on AWS Local Zones. Using the suggested controls lets you limit the ability to store data, process data outside a geographic location, and keep your data within specific Local Zone(s).
Data residency is a critical consideration for organizations that collect and store sensitive information, such as Personal Identifiable Information (PII), financial data, and healthcare data. With the rise of cloud computing and the global nature of the Internet, it can be challenging for organizations to make sure that their data is being stored and processed in compliance with local laws and regulations.
One potential solution for addressing data residency challenges with AWS is utilizing Local Zones, which places AWS infrastructure in large metro areas. This enables organizations to store and process data in specific geographic locations. By using Local Zones, organizations can architect their environment to meet data residency requirements when an AWS Region is unavailable within the same legal jurisdiction. Local Zones can be configured to utilize landing zone to further adhere to data residency requirements.
A landing zone is a well-architected, multi-account AWS environment that is scalable and secure. This is a starting point from which your organization can quickly launch and deploy workloads and applications with confidence in your security and infrastructure environment.
When leveraging a Local Zone to meet data residency requirements, you must have control over the in-scope data movement from the Local Zones to the AWS Region. This can be accomplished by implementing landing zone best practices and the suggested guardrails. The main focus of this post is the custom policies that restrict data snapshots, prohibit data creation within the Region, and limit data transfer to the Region. Furthermore, this post covers which prerequisites organizations should consider before implementing these guardrails.
Prerequisites
Landing zones best practices and custom guardrails can help when data must remain in a specific locality where the Local Zone is also located. This can be completed by defining and enforcing policies for data storage and usage within the landing zone organization that you set up. The following prerequisites should be considered before implementing the suggested guardrails:
- AWS Local Zones
Local Zones are enabled through the Amazon Elastic Compute Cloud (Amazon EC2) console or the AWS Command Line Interface (AWS CLI).
You can start using available AWS services on the designated Local Zone directly from the console. Moreover, you can manage the Local Zone using the same tools and interfaces that you use in AWS Region.
2. AWS Control Tower landing zone
AWS Control Tower is a managed service that provides a pre-packaged set of best-practice blueprints for setting up and governing multi-account AWS environments. You must have Control Tower fully implemented in your environment before you can deploy custom guardrails.
Control Tower launches a key resource associated with your account, called a landing zone, which serves as a home for your organizations and their accounts.
Note that Control Tower relies on Organizations to create and manage multi-account structures.
- Set up the data residency guardrails
Using Organizations, you must make sure that the Local Zone is enabled within a workload account in the landing zones.

Figure 1: Landing Zones Accelerator – Local Zones workload on AWS high level Architecture
Utilizing Local Zones for regulated components
The availability of Local Zones provides an excellent opportunity to meet data residency requirements and comply with local regulations that restrict the use of the Region outside of your required geo-political boundary. By leveraging Local Zones, organizations can maintain compliance while utilizing AWS services to support their business needs. AWS owns and manages the infrastructure, including hardware, software, and networking for Local Zones. However, as part of the shared responsibility model, customers are responsible for the security of their applications and data, including access control, data encryption, etc.
You must also comply with all applicable regulations and security standards, such as HIPAA, PCI DSS, and GDPR. You should conduct regular security assessments and implement appropriate security controls to protect their applications and data.
In this post, we consider a scenario where there is a single Local Zones location in a metro. However, you must analyze the specific requirements of your workloads and the relevant regulations that apply to determine the most appropriate high availability configurations for your case.
Local Zones workload data residency guardrails
Organizations provides central governance and management for multiple accounts. Central security administrators use SCPs with Organizations to establish controls to which all AWS Identity and Access Management (IAM) principals (users and roles) adhere.
Now you can use SCPs to set permission guardrails. The suggested preventative controls that leverage the implementation of SCPs for data residency on Local Zones are shown in the next paragraph. SCPs let you set permission guardrails by defining the maximum available permissions for IAM entities in an account and all accounts within the Organization root or Organizational Unit (OU). If an SCP denies an action for an account, then none of the entities in any member account, including the member account’s root user, can take that action, even if their IAM permissions let them. The guardrails set in SCPs apply to all IAM entities in the account, which include all users, roles, and the account root user.
Upon finalizing these prerequisites, you can create the guardrails for the chosen OU.
| Note that although the following guidelines serve as helpful guardrails – SCPs – for data residency, you should consult internally with legal and security teams for specific organizational requirements. |
To exercise better control over the workload in Local Zones and prevent data transfer from Local Zones or data storage outside of the Local Zones, consider implementing the following guardrails:
- When your data residency requirements require restricting data transfer/saving to the Region, consider the following guardrails:
a. Deny copying data from Local Zones to the Region for Amazon EC2), Amazon Relational Database Service (Amazon RDS), Amazon ElastiCache, and data sync “DenyCopyToRegion”.
| As the available services in Local Zones can vary based on location, you must review the services available in the chosen Local Zone and Adjust the SCPs accordingly. |
b. Deny Amazon Simple Storage Service (Amazon S3) put action to the Region “DenyPutObjectToRegionalBuckets”.
| If your data residency requirements mandate restrictions on data storage in the Region, then consider implementing this guardrail to prevent the use of Amazon S3 in the Region. |
c. If your data residency requirements mandate restrictions on data storage in the Region, then consider implementing “DenyDirectTransferToRegion”
| Out of Scope is metadata such as tags or operational data such as AWS Key Management Service (AWS KMS) keys. |
{ "Version": "2012-10-17", "Statement": [ { "Sid": "DenyCopyToRegion", "Action": [ "ec2:ModifyImageAttribute", "ec2:CopyImage", "ec2:CreateImage", "ec2:CreateInstanceExportTask", "ec2:ExportImage", "ec2:ImportImage", "ec2:ImportInstance", "ec2:ImportSnapshot", "ec2:ImportVolume", "rds:CreateDBSnapshot", "rds:CreateDBClusterSnapshot", "rds:ModifyDBSnapshotAttribute", "elasticache:CreateSnapshot", "elasticache:CopySnapshot", "datasync:Create*", "datasync:Update*" ], "Resource": "*", "Effect": "Deny" }, { "Sid": "DenyDirectTransferToRegion", "Action": [ "dynamodb:PutItem", "dynamodb:CreateTable", "ec2:CreateTrafficMirrorTarget", "ec2:CreateTrafficMirrorSession", "rds:CreateGlobalCluster", "es:Create*", "elasticfilesystem:C*", "elasticfilesystem:Put*", "storagegateway:Create*", "neptune-db:connect", "glue:CreateDevEndpoint", "glue:UpdateDevEndpoint", "datapipeline:CreatePipeline", "datapipeline:PutPipelineDefinition", "sagemaker:CreateAutoMLJob", "sagemaker:CreateData*", "sagemaker:CreateCode*", "sagemaker:CreateEndpoint", "sagemaker:CreateDomain", "sagemaker:CreateEdgePackagingJob", "sagemaker:CreateNotebookInstance", "sagemaker:CreateProcessingJob", "sagemaker:CreateModel*", "sagemaker:CreateTra*", "sagemaker:Update*", "redshift:CreateCluster*", "ses:Send*", "ses:Create*", "sqs:Create*", "sqs:Send*", "mq:Create*", "cloudfront:Create*", "cloudfront:Update*", "ecr:Put*", "ecr:Create*", "ecr:Upload*", "ram:AcceptResourceShareInvitation" ], "Resource": "*", "Effect": "Deny" }, { "Sid": "DenyPutObjectToRegionalBuckets", "Action": [ "s3:PutObject" ], "Resource": ["arn:aws:s3:::*"], "Effect": "Deny" } ]}- If your data residency requirements require limitations on data storage in the Region, then consider implementing this guardrail “DenyAllSnapshots” to restrict the use of snapshots in the Region.
| Note that the following guardrail restricts the creation of snapshots on AWS Outposts as well. If you’re using Outposts in the same AWS account, then you may need to customize this guardrail to make sure that it aligns with your organization’s specific needs and requirements. For more information on data residency considerations for Outposts, please refer to Architecting for data residency with AWS Outposts rack and landing zone guardrails. |
{ "Version": "2012-10-17", "Statement": [ { "Sid": "DenyAllSnapshots", "Effect":"Deny", "Action":[ "ec2:CreateSnapshot", "ec2:CreateSnapshots", "ec2:CopySnapshot", "ec2:ModifySnapshotAttribute" ], "Resource":"arn:aws:ec2:*::snapshot/*" } ]}- This guardrail helps prevent the launch of EC2 instances or the creation of network interfaces by subnet as opposed to Local Zones You should keep data residency workloads within the Local Zones rather than the Region to make sure of better control over regulated workloads. This approach can help your organization achieve better control over data residency workloads and improve governance over your Organization.
Make sure to update the Local Zones subnets < localzones\_subnet\_arns>.
{"Version": "2012-10-17", "Statement":[{ "Sid": "DenyNotLocalZonesSubnet", "Effect":"Deny", "Action": [ "ec2:RunInstances", "ec2:CreateNetworkInterface" ], "Resource": [ "arn:aws:ec2:*:*:network-interface/*" ], "Condition": { "ForAllValues:ArnNotEquals": { "ec2:Subnet": ["<localzones\_subnet\_arns>"] } } }]}Additional considerations
When implementing data residency guardrails on Local Zones, consider backup and disaster recovery strategies to make sure that your data is protected in the event of an outage or other unexpected events. This may include creating regular backups of your data, implementing disaster recovery plans and procedures, and using redundancy and failover systems to minimize the impact of any potential disruptions. Additionally, you should make sure that your backup and disaster recovery systems are compliant with any relevant data residency regulations and requirements. You should also test your backup and disaster recovery systems regularly to make sure that they are functioning as intended.
Additionally, the provided SCPs for Local Zones in the above example do not block the “logs:PutLogEvents”. Therefore, even if you implemented data residency guardrails on Local Zones, the application may log data to Amazon CloudWatch Logs in the Region.
HighlightsBy default, application-level logs on Local Zones are not automatically sent to CloudWatch Logs in the Region. You can configure CloudWatch Logs agent on Local Zones to collect and send your application-level logs to CloudWatch Logs. logs:PutLogEvents does transmit data to the Region, but it is not blocked by the provided SCPs, as it’s expected that most use cases still want to be able to use this logging API. However, if blocking is desired, then add the action to the first recommended guardrail. If you want specific roles to be allowed, then combine with the ArnNotLike condition example referenced in the Customization Guide. |
Conclusion
The combined use of Local Zones and the suggested guardrails via Organizations policies enables you to exercise better control over the movement of the data. By creating a landing zone for your organization, you can apply SCPs to your Local Zones that will help make sure that your data remains within a specific geographic location, as required by the data residency regulations.
Note that, although custom guardrails can help you manage data residency on Local Zones, it’s critical to thoroughly review your policies, procedures, and configurations. This lets you make sure that they are compliant with all relevant data residency regulations and requirements. Regularly testing and monitoring your systems can help make sure that your data is protected and your organization stays compliant.
References
This post was written by Mark Sailes, Senior Specialist Solutions Architect, Serverless.
You can now develop AWS Lambda functions with the Amazon Corretto distribution of Java 17. This version of Corretto comes with long-term support (LTS), which means it will receive updates and bug fixes for an extended period, providing stability and reliability to developers who build applications on it. This runtime also supports AWS Lambda SnapStart, so you can upgrade to the latest managed runtime without losing your performance improvements.
Java 17 comes with new language features for developers, including Java records, sealed classes, and multi-line strings. It also comes with improvements to further optimize running Java on ARM CPU architectures, such as Graviton.
This blog explains how to get started using Java 17 with Lambda, how to use the new language features, and what else has changed with the runtime.
New language features
In Java, it is common to pass data using an immutable object. Before Java 17, this resulted in boiler plate code or the use of an external library like Lombok. For example, a generic Person object may look like this:
public class Person { private final String name; private final int age; public Person(String name, int age) { this.name = name; this.age = age; } public String getName() { return name; } public int getAge() { return age; } @Override public boolean equals(Object o) { if (this == o) return true; if (o == null || getClass() != o.getClass()) return false; Person person = (Person) o; if (age != person.age) return false; return Objects.equals(name, person.name); } @Override public int hashCode() { return Objects.hash(name, age); } @Override public String toString() { return "Person{" + "name='" + name + '\'' + ", age=" + age + '}'; }}In Java 17, you can replace this entire class with a record, expressed as:
public record Person(String name, int age) {}The equals, hashCode, and toString methods, as well as the private, final fields and public constructor, are generated by the Java compiler. This simplifies the code that you have to maintain.
The Java 17 managed runtime introduces a new feature allowing developers to use records as the object to represent event data in the handler method. Records were introduced in Java 14 and provide a simpler syntax to declare classes primarily used to store data. Records allow developers to define an immutable class with a set of named properties and methods to access those properties, making them perfect for event data. This feature simplifies code, making it easier to read and maintain. Additionally, it can provide better performance since records are immutable by default, and Java’s runtime can optimize the memory allocation and garbage collection process. To use records as the parameter for the event handler method, define the record with the required properties, and pass the record to the method. The ability to use records as the object to represent event data in the handler method is a useful addition to the Java language, providing a concise and efficient way to define event data structures.
For example, the following Lambda function uses a Person record to represent the event data:
public class App implements RequestHandler<Person, APIGatewayProxyResponseEvent> { public APIGatewayProxyResponseEvent handleRequest(Person person, Context context) { String id = UUID.randomUUID().toString(); Optional<Person> savedPerson = createPerson(id, person.name(), person.age()); if (savedPerson.isPresent()) { return new APIGatewayProxyResponseEvent().withStatusCode(200); } else { return new APIGatewayProxyResponseEvent().withStatusCode(500); } }Garbage collection
Java 17 makes available two new Java garbage collectors (GCs): Z Garbage Collector (ZGC) introduced in Java 15 and Shenandoah introduced in Java 12.
You can evaluate GCs against three axes:
- Throughput: the amount of work that can be done.
- Latency: how long work takes to complete.
- Memory footprint: how much additional memory is required.
Both the ZGC and Shenandoah GCs trade throughput and footprint to focus on reducing latency where possible. They perform all expensive work concurrently, without stopping the execution of application threads for more than a few milliseconds.
In the Java 17 managed runtime, Lambda continues to use the Serial GC as it does in Java 11. This is a low footprint GC well-suited for single processor machines, which is often the case when using Lambda functions.
You can change the default GC using the JAVA\_TOOL\_OPTIONS environment variable to an alternative if required. For example, if you were running with more memory and therefore multiple CPUs consider the Parallel GC. To use this, set JAVA\_TOOL\_OPTIONS to -XX:+UseParallelGC.
Runtime JVM configuration changes
In the Java 17 runtime, the JVM flag for tiered compilation is now set to stop at level 1 by default. In previous versions, you would have to do this by setting the JAVA\_TOOL\_OPTIONS to -XX:+TieredCompilation -XX:TieredStopAtLevel=1.
This is helpful in the majority of synchronous workloads because it can reduce startup latency by up to 60%. For more information on configuring tiered compilation, see “Optimizing AWS Lambda function performance for Java“.
If you are running a workload that processes large numbers of batches, simulates events, or any other highly repetitive action, you might find that this slows the duration of your function. An example of this would be Monte Carlo simulations. To change back to the previous settings, set JAVA\_TOOL\_OPTIONS to -XX:-TieredCompilation.
Using Java 17 in Lambda
AWS Management Console
To use the Java 17 runtime to develop your Lambda functions, set the runtime value to Java 17 when creating or updating a function.

To update an existing Lambda function to Java 17, navigate to the function in the Lambda console, then choose Edit in the Runtime settings panel. The new version is available in the Runtime dropdown:

AWS Serverless Application Model (AWS SAM)
In AWS SAM, set the Runtime attribute to java17 to use this version:
AWSTemplateFormatVersion: '2010-09-09'Transform: AWS::Serverless-2016-10-31Description: Simple Lambda FunctionResources: HelloWorldFunction: Type: AWS::Serverless::Function Properties: CodeUri: HelloWorldFunction Handler: helloworld.App::handleRequest Runtime: java17 MemorySize: 1024AWS SAM supports the generation of this template with Java 17 out of the box for new serverless applications using the sam init command. Refer to the AWS SAM documentation here.
AWS Cloud Development Kit (AWS CDK)
In the AWS CDK, set the runtime attribute to Runtime.JAVA\_17 to use this version. In Java:
import software.amazon.awscdk.core.Construct;import software.amazon.awscdk.core.Stack;import software.amazon.awscdk.core.StackProps;import software.amazon.awscdk.services.lambda.Code;import software.amazon.awscdk.services.lambda.Function;import software.amazon.awscdk.services.lambda.Runtime;public class InfrastructureStack extends Stack { public InfrastructureStack(final Construct parent, final String id, final StackProps props) { super(parent, id, props); Function.Builder.create(this, "HelloWorldFunction") .runtime(Runtime.JAVA\_17) .code(Code.fromAsset("target/hello-world.jar")) .handler("helloworld.App::handleRequest") .memorySize(1024) .build(); }}Application frameworks
Java application frameworks Spring and Micronaut have announced that their latest versions Spring Boot 3 and Micronaut 4 require Java 17 as a minimum. Quarkus 3 continues to support Java 11. Java 17 is faster than 8 or 11, and framework developers want to pass on the performance improvements to customers. They also want to use the improvements to the Java language in their own code and show code examples with the most modern ways of working.
To try Micronaut 4 and Java 17, you can use the Micronaut launch web service to generate an example project that includes all the application code and AWS Cloud Development Kit (CDK) infrastructure as code you need to deploy it to Lambda.
The following command creates a Micronaut application, which uses the common controller pattern to handle REST requests. The infrastructure code will create an Amazon API Gateway and proxy all its requests to the Lambda function.
curl --location --request GET 'https://launch.micronaut.io/create/default/blog.example.lambda-java-17?lang=JAVA&build=MAVEN&test=JUNIT&javaVersion=JDK\_17&features=amazon-api-gateway&features=aws-cdk&features=crac' --output lambda-java-17.zipUnzip the downloaded file then run the following Maven command to generate the deployable artifact.
./mvnw packageFinally, deploy the resources to AWS with CDK:
cd infracdk deployConclusion
This blog post describes how to create a new Lambda function running the Amazon Corretto Java 17 managed runtime. It introduces the new records language feature to model the event being sent to your Lambda function and explains how changes to the default JVM configuration might affect the performance of your functions.
If you’re interested in learning more, visit serverlessland.com. If this has inspired you to try migrating an existing application to Lambda, read our re-platforming guide.
This blog post is written by Steve Cole, Principal Specialist SA, and Robert McCone, Sr. Specialist SA.
Getting the compute resources you need, even vCPUS numbering in the millions, and completing a workload using Amazon EC2 Spot Instances is just a configuration away. In this post you will learn how to use Spot placement scores to reduce interruptions, acquire greater capacity, and identify optimal configurations, times, and locations to run workloads on Spot Instances. Amazon EC2 Spot Instances let you take advantage of unused EC2 capacity in the AWS cloud and are available at up to a 90% discount compared to On-Demand prices. Spot placement scores is a feature that many customers use to identify optimal instance types or to choose the best Availability Zone (AZ) for ephemeral work like data analytics or high-performance computing. As a real-time tool, Spot placement scores are often integrated into deployment automation. However, because of its logging and graphic capabilities, you may find it be a valuable resource even before you launch a workload into the cloud. Now available through AWS Labs, a Github repository hosting tools for customers, the Spot placement score tracker tackles the undifferentiated heavy lifting and can do this for any customer.
About Spot placement score
Spot placement scores are a feature available through AWS APIs – also implemented in the Amazon EC2 Spot requests console – that uses internal capacity and interruption data to scrutinize the size and shape of a Spot Instance request and responds with a “likelihood of success” rating of 1 to imply lower likelihood of success and 10 to imply higher likelihood of success. The score represents confidence in being able to acquire the desired capacity (size) using the instance configuration (shape) for the next few hours. The shape of the request can be a list of specific instances or can be requirements-based with attribute-based instance type selection. The size of the request can be instance count, number of vCPUs, or GB of RAM. It’s based on known capacity, allocation strategies, and the trending of capacities over time.
Before the release of Spot placement score, customers could track the trends of their existing workloads and configurations. This might have helped them to anticipate capacity constraints over time, but the ability to do something more meaningful when assessing configurations was something customers requested often. With the launch of Spot placement score, that capability was delivered and enabled customers to receive guidance on how a configuration change might affect the effectiveness of Spot Instances in a workload.
Customers immediately recognized the power of this new feature and started writing tooling around their workloads to incorporate the new functionality provided by Spot placement scores. For examples, customers leveraged Spot placement scores to find the highest scoring AZ in a region for work that requires low latency within a cluster. Customers running data analytics with services like Amazon EMR could more confidently launch clusters on Spot Instances. This reduces costs and the time necessary to process data because of fewer interruptions. Financial customers, health care and life sciences, and high tech were some of the early adopters of this strategy.
Benefits of Spot placement scores
One specific customer used tools like the Spot instance advisor and Spot pricing history tools to make decisions about what instances to run every night. If the customer’s analytics workload received too many interruptions, then it would inevitably be relaunched using On-Demand Instances, increasing costs and time-to-complete. The addition of Spot placement scores to the customer’s tooling allowed for more informed decisions about which configurations worked best and, more specifically, which AZ(s) to use. Ultimately, this led not only to higher confidence in using Spot instances, but also to significant cost savings over time.
Other customers tracked Spot placement scores over time with regular queries stored in time series databases to identify not only the best configuration or location, but also the best time-of-day or day-of-week to run their workloads. Different configurations of instance types were queried through automation and the results were logged into a time series database that could then be presented as graphs. These graphs were scrutinized, configurations were tuned, and ultimately these customers could take greater advantage of the cost optimization that Spot instances offer through fewer interruptions by running their workloads where and when scores were higher.
AWS was interested in how this solved problems for customers, and after some more research with customers and design ideation, led to the creation of an OSS tool that AWS has recently released: Spot placement score tracker. Spot placement score tracker helps customers evaluate different configurations against multiple times and locations. It’s an AWS-native solution that leverages the Spot placement score API along with AWS Lambda and Amazon CloudWatch to create a dashboard that enables any AWS customer to benefit from this model without having to write it themselves.
How to use the Spot placement score tracker
The project provides Infrastructure as Code (IaC) automation using the AWS Cloud Development Kit (AWS CDK) to deploy the infrastructure and permissions required to run Lambda. This gets executed every five minutes to collect the placement scores of as many diversified configurations as defined.

After installing the CloudWatch dashboard, and given some time to collect and record data, you will be provided valuable insights in an intuitive graph such as those in the following example.
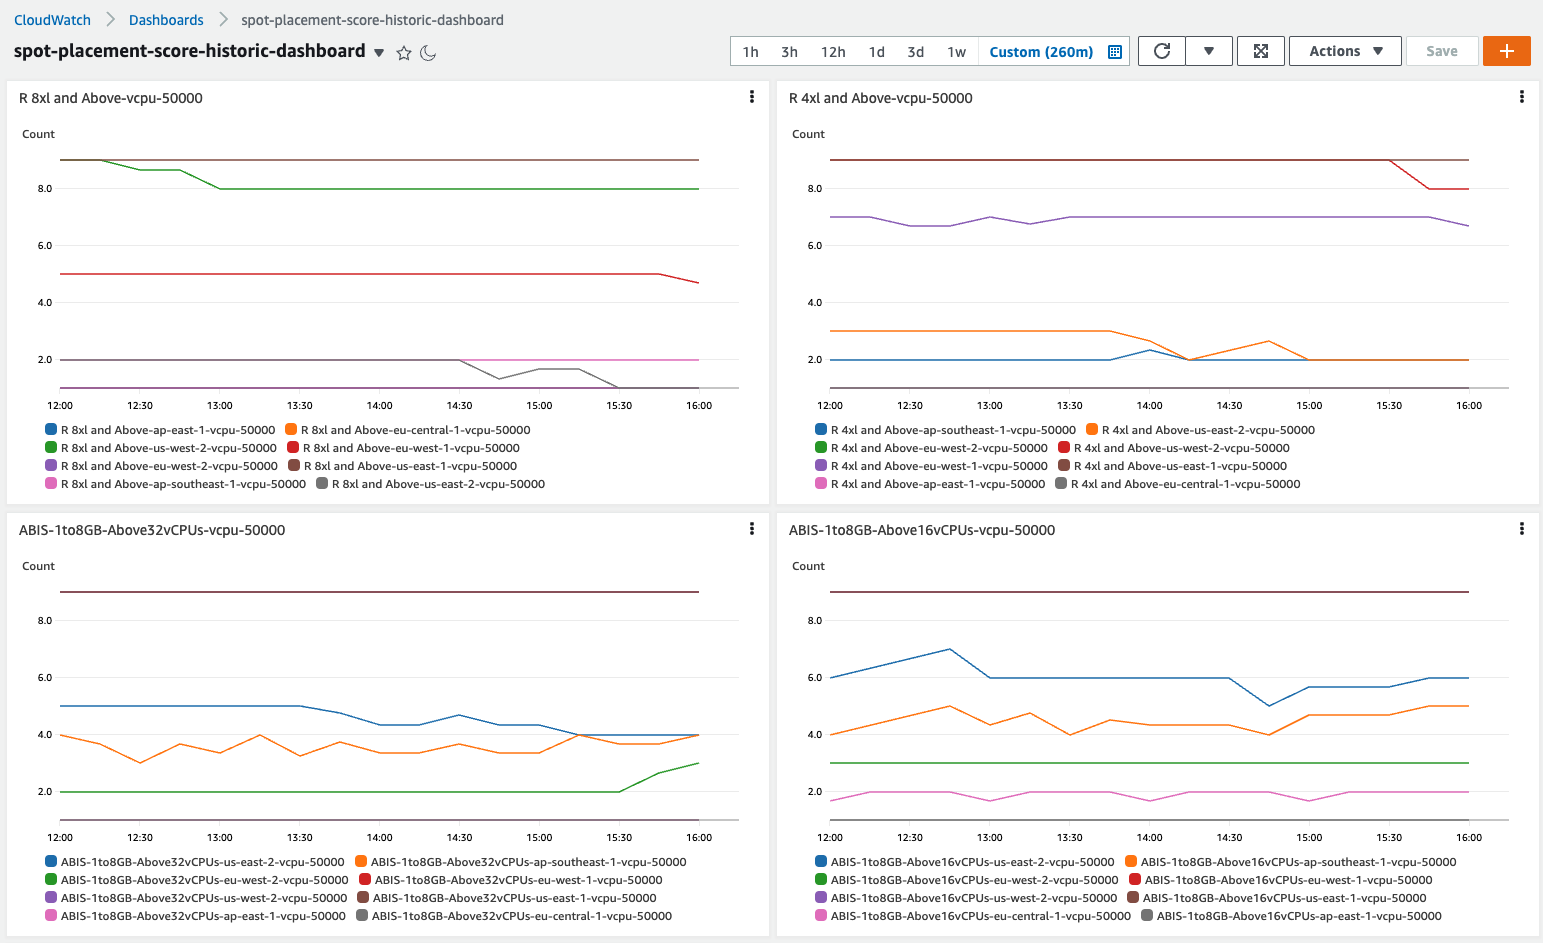
Insights available through the Spot placement score tracker
The first thing you may notice by observing data over time is that instance diversification is the primary driver of high placement scores. This has always been a best practice for the use of Spot Instances, and it extends to On-Demand Instances as well. In short, if you can only run on one instance type, then the likelihood of experiencing interruptions is far greater than if you can run on six or twelve. Sometimes the simple inclusion of -a, -d, and -n instance types (e.g. m5.large, m5a.large, m5d.large, m5d.large), previous generations (e.g., m5.large, m4.large), different sizes in a container environment (e.g., m5.large, m5.xlarge, m5.2xlarge), and even the inclusion of AWS Graviton will have a material impact on placement scores, which equates to fewer interruptions. This ultimately leads to more efficient use of resources through less restarted processes, resulting in increased efficiency and reduced costs.
The second insight that you can realize through the use of placement scores over time is identifying the optimal AZ in which an ephemeral process can be placed. Perhaps the best use case for this type of insight is data analytics clusters that are launched to complete many calculations overnight. This is common in financial institutions for various reasons including risk analysis and compliance, but could apply to medical research examining results of experiments during the day as well as other situations where a 24/7 presence isn’t required by the workload. These customers are typically using a single AZ to allow for faster communication between nodes and to reduce data transfer costs. Therefore, the ability for Spot placement scores to provide different scores for different AZs is highly advantageous.
Third, with access to placement scores over time, it becomes possible to identify exactly how large a workload’s footprint can be. By submitting identical configurations to Spot placement scores but with different sizes, you can surface the ideal workload size. Not too small, where perhaps the job takes too long to complete, but also not so large that the interruptions are too frequent and cause restarts too often. This can benefit not only ephemeral workloads, but also persistent clusters or fleets by understanding what the lowest score would be over time and giving you solid information regarding what they can expect from Spot Instances and where. This might inform you to be ready to launch On-Demand Instances to compensate when Spot Instance availability is lower. This can also help to forecast pricing and inform decisions about the consideration of AWS Savings Plans or On-Demand Capacity Reservations.
Finally, analyzing Spot placement scores over time can provide regional scoring. Through this lens it’s possible for you to identify entire regions that they may have overlooked without the knowledge that Spot Instances outside the your primary region(s) might offer lower interruptions during daylight hours due to them being off-peak. When it’s possible to place a workload in another region, unconstrained by local data access requirements, it’s quite possible to harness the compute of a significant footprint in locations that are otherwise un(der)-utilized. Workloads that require less data transfer and more compute can benefit tremendously from access to Spot Instances in other regions. For example, things like build servers might run extraordinarily well in Europe during North American business hours and the reduction in compute cost might offset the data transfer to complete the job.
Conclusion
Spot placement scores can be used to make decisions about how, when, and where Spot Instances can be most efficiently utilized to deliver business needs, and at greatly reduced prices. We’re very excited to release this tool to enable you to tap into information which was previously unavailable and make data-driven decisions for your business. The information in this post, combined with the output of placement scores over time, is a significant evolution.
Install the Spot placement score tracker today, configure it to match an existing Spot workload, and see how you might perform at different times or different locations. Explore more robust options and discover greater capacity and lower interruptions. Or investigate how On-Demand workloads could migrate to Spot Instances.
This post was written by Josh Kahn, Tech Leader, Serverless.
Amazon VPC Lattice is a new, generally available application networking service that simplifies connectivity between services. Builders can connect, secure, and monitor services on instances, containers, or serverless compute in a simplified and consistent manner.
VPC Lattice supports AWS Lambda functions as both a target and a consumer of services. This blog post explores how to incorporate VPC Lattice into your serverless workloads to simplify private access to HTTP-based APIs built with Lambda.
Overview
VPC Lattice is an application networking service that enables discovery and connectivity of services across VPCs and AWS accounts. VPC Lattice includes features that allow builders to define policies for network access, traffic management, and monitoring. It also supports custom domain names for private endpoints.
VPC Lattice is composed of several key components:
- Service network – a logical grouping mechanism for a collection of services on which you can apply common policies. Associate one or more VPCs to allow access from services in the VPC to the service network.
- Service – a unit of software that fulfills a specific task or function. Services using VPC Lattice can run on instances, containers, or serverless compute. This post focuses on services built with Lambda functions.
- Target group – in a serverless application, a Lambda function that performs business logic in response to a request. Routing rules within the service route requests to the appropriate target group.
- Auth policy – an AWS Identity and Access Management (IAM) resource policy that can be associated with a service network and a service that defines access to those services.
VPC Lattice enables connectivity across VPC and account boundaries, while alleviating the complexity of the underlying networking. It supports HTTP/HTTPS and gRPC protocols, though gRPC is not currently applicable for Lambda target groups.
VPC Lattice and Lambda
Lambda is one of the options to build VPC Lattice services. The AWS Lambda console supports VPC Lattice as a trigger, similar to previously existing triggers such as Amazon API Gateway and Amazon EventBridge. You can also connect VPC Lattice as an event source using infrastructure as code, such as AWS CloudFormation and Terraform.
To configure VPC Lattice as a trigger for a Lambda function in the Console, navigate to the desired function and select the Configuration tab. Select the Triggers menu on the left and then choose Add trigger.
The trigger configuration wizard allows you to define a new VPC Lattice service provided by the Lambda function or to add to an existing service. When adding to an existing service, the wizard allows configuration of path-based routing that sends requests to the target group that includes the function. Path-based and other routing mechanisms available from VPC Lattice are useful in migration scenarios.
This example shows creating a new service. Provide a unique name for the service and select the desired VPC Lattice service network. If you have not created a service network, follow the link to create a new service network in the VPC Console (to create a new service network, read the VPC Lattice documentation).
The listener configuration allows you to configure the protocol and port on which the service is accessible. HTTPS (port 443) is the default configuration, though you can also configure the listener for HTTP (port 80). Note that configuring the listener for HTTP does not change the behavior of Lambda: it is still invoked by VPC Lattice over an HTTPS endpoint, but the service endpoint is available as HTTP. Choose Add to complete setup.
In addition to configuring the VPC Lattice service and target group, the Lambda wizard also adds a resource policy to the function that allows the VPC Lattice target group to invoke the function.
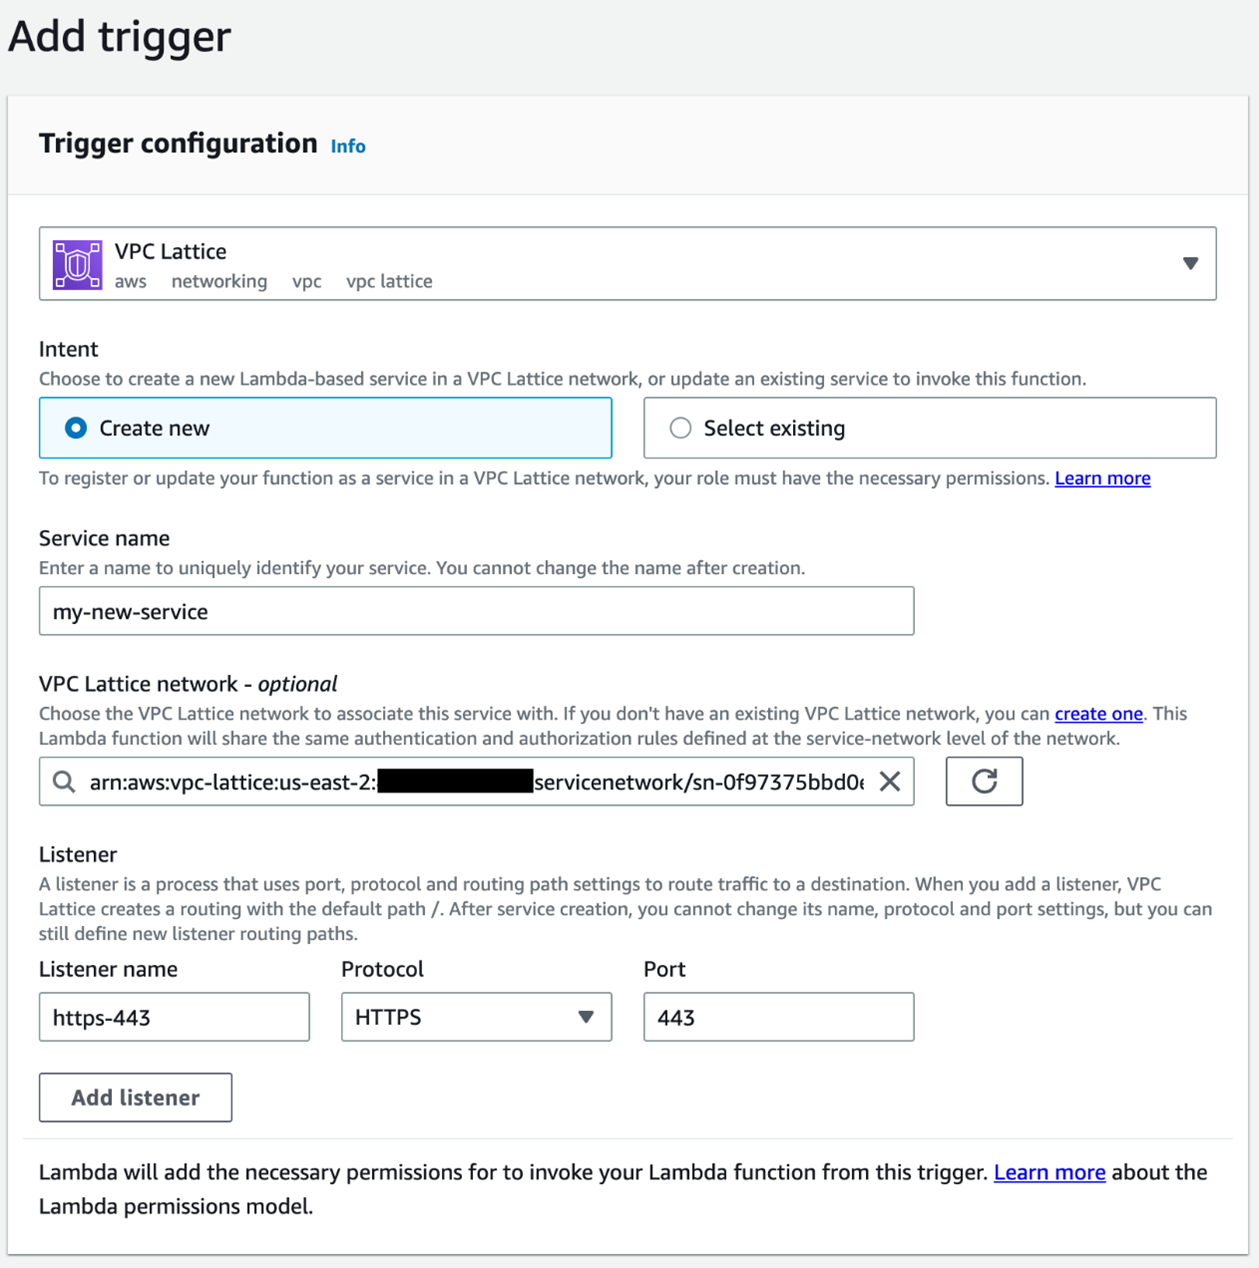
VPC Lattice integration
When a client sends a request to a VPC Lattice service backed by a Lambda target group, VPC Lattice synchronously invokes the target Lambda function. During a synchronous invocation, the client waits for the result of the function and all retry handling is performed by the client. VPC Lattice has an idle timeout of one minute and connection timeout of ten minutes to both the client and target.
The event payload received by the Lambda function when invoked by VPC Lattice is similar to the following example. Note that base64 encoding is dependent on the content type.
{ "body": "{ "\userId\": 1234, \"orderId\": \"5C71D3EB-3B8A-457B-961D\" }", "headers": { "accept": "application/json, text/plain, */*", "content-length": "156", "user-agent": "axios/1.3.4", "host": "myvpclattice-service-xxxx.xxxx.vpc-lattice-svcs.us-east-2.on.aws", "x-forwarded-for": "10.0.129.151" }, "is\_base64\_encoded": false, "method": "PUT", "query\_string\_parameters": { "action": "add" }, "raw\_path": "/points?action=add"}The response payload returned by the Lambda function includes a status code, headers, base64 encoding, and an optional body as shown in the following example. A response payload that does not meet the required specification results in an error. To return binary content, you must set isBase64Encoded to true.
{ "isBase64Encoded": false, "statusCode": 200, "statusDescription": "200 OK", "headers": { "Set-Cookie": "cookies", "Content-Type": "application/json" }, "body": "Hello from Lambda (optional)"}For more details on the integration between VPC Lattice and Lambda, visit the Lambda documentation.
Calling VPC Lattice services from Lambda
VPC Lattice services support connectivity over HTTP/HTTPS and gRPC protocols as well as open access or authorization using IAM. To call a VPC Lattice service, the Lambda function must be attached to a VPC that is associated to a VPC Lattice service network:
While a function that calls a VPC Lattice service must be associated with an appropriate VPC, a Lambda function that is part of a Lattice service target group does not need to be attached to a VPC. Remember that Lambda functions are always invoked via an AWS endpoint with access controlled by AWS IAM.
Calls to a VPC Lattice service are similar to sending a request to other HTTP/HTTPS services. VPC Lattice allows builders to define an optional auth policy to enforce authentication and perform context-specific authorization and implement network-level controls with security groups. Callers of the service must meet networking and authorization requirements to access the service. VPC Lattice blocks traffic if it does not explicitly meet all conditions before your function is invoked.
A Lambda function that calls a VPC Lattice service must have explicit permission to invoke that service, unless the auth type for the service is NONE. You provide that permission through a policy attached to the Lambda function’s execution role, for example:
{ "Action": "vpc-lattice-svcs:Invoke", "Resource": "arn:aws:vpc-lattice:us-east-2:123456789012:service/svc-123abc/*", "Effect": "Allow"}If the auth policy associated with your service network or service requires authenticated requests, any requests made to that service must contain a valid request signature computed using Signature Version 4 (SigV4). An example of computing a SigV4 signature can be found in the VPC Lattice documentation. VPC Lattice does not support payload signing at this time. In TypeScript, you can sign a request using the AWS SDK and Axios library as follows:
import { SignatureV4 } from "@aws-sdk/signature-v4";import { Sha256 } from "@aws-crypto/sha256-js";import axios from "axios";const endpointUrl = new URL(VPC\_LATTICE\_SERVICE\_ENDPOINT);const sigv4 = new SignatureV4({ service: "vpc-lattice-svcs", region: process.env.AWS\_REGION!, credentials: { accessKeyId: process.env.AWS\_ACCESS\_KEY\_ID!, secretAccessKey: process.env.AWS\_SECRET\_ACCESS\_KEY!, sessionToken: process.env.AWS\_SESSION\_TOKEN }, sha256: Sha256});const signedRequest = await sigv4.sign({ method: "PUT", hostname: endpointUrl.host, path: endpointUrl.pathname, protocol: endpointUrl.protocol, headers: { 'Content-Type': 'application/json', host: endpointUrl.hostname, // Include following header as VPC Lattice does not support signed payloads "x-amz-content-sha256": "UNSIGNED-PAYLOAD" } }); const { data } = await axios({ ...signedRequest, data: { // some data }, url: VPC\_LATTICE\_SERVICE\_ENDPOINT });VPC Lattice provides several layers of security controls, including network-level and auth policies, that allow (or deny) access from a client to your service. These controls can be implemented at the service network, applying those controls across all services in the network.
Connecting to any VPC Lattice service
VPC Lattice supports services built using Amazon EKS and Amazon EC2 in addition to Lambda. Calling services built using these other compute options looks exactly the same to the caller as the preceding sample. VPC Lattice provides an endpoint that abstracts how the service itself is actually implemented.
A Lambda function configured to access resources in a VPC can potentially access VPC Lattice services that are part of the service network associated with that VPC. IAM permissions, the auth policy associated with the service, and security groups may also impact whether the function can invoke the service (see VPC Lattice documentation for details on securing your services).
Services deployed to an Amazon EKS cluster can also invoke Lambda functions exposed as VPC Lattice services using native Kubernetes semantics. They can use either the VPC Lattice-generated domain name or a configured custom domain name to invoke the Lambda function instead of API Gateway or an Application Load Balancer (ALB). Refer to this blog post on the AWS Container Blog for details on how an Amazon EKS service invokes a VPC Lattice service with access control enabled.
Building private serverless APIs
With the launch of VPC Lattice, AWS now offers several options to build serverless APIs accessible only within your customer VPC. These options include API Gateway, ALB, and VPC Lattice. Each of these services offers a unique set of features and trade-offs that may make one a better fit for your workload than others.
Private APIs with API Gateway provide a rich set of features, including throttling, caching, and API keys. API Gateway also offers a rich set of authorization and routing options. Detailed networking and DNS knowledge may be required in complex environments. Both network-level and resource policy controls are available to control access and the OpenAPI specification allows schema sharing.
Application Load Balancer provides flexibility and a rich set of routing options, including to a variety of targets. ALB also can offer a static IP address via AWS Global Accelerator. Detailed networking knowledge is required to configure cross-VPC/account connectivity. ALB relies on network-level controls.
Service networks in VPC Lattice simplify access to services on EC2, EKS, and Lambda across VPCs and accounts without requiring detailed knowledge of networking and DNS. VPC Lattice provides a centralized means of managing access control and guardrails for service-to-service communication. VPC Lattice also readily supports custom domain names and routing features (path, method, header) that enable customers to build complex private APIs without the complexity of managing networking. VPC Lattice can be used to provide east-west interservice communication in combination with API Gateway and AWS AppSync to provide public endpoints for your services.
Conclusion
We’re excited about the simplified connectivity now available with VPC Lattice. Builders can focus on creating customer value and differentiated features instead of complex networking in much the same way that Lambda allows you to focus on writing code. If you are interested in learning more about VPC Lattice, we recommend the VPC Lattice User Guide.
To learn more about serverless, visit Serverless Land for a wide array of reusable patterns, tutorials, and learning materials.
This blog is written by Poornima Chand, Senior Solutions Architect, Strategic Accounts and Giedrius Praspaliauskas, Senior Solutions Architect, Serverless.
AWS Lambda functions allow both synchronous and asynchronous invocations, which both have different function behaviors and error handling:
When you invoke a function synchronously, Lambda returns any unhandled errors in the function code back to the caller. The caller can then decide how to handle the errors. With asynchronous invocations, the caller does not wait for a response from the function code. It hands off the event to the Lambda service to handle the process.
As the caller does not have visibility of any downstream errors, error handling for asynchronous invocations can be more challenging and must be implemented at the Lambda service layer.
This post explains the error behaviors and approaches for handling errors in Lambda asynchronous invocations to build reliable serverless applications.
Overview
AWS services such as Amazon S3, Amazon SNS, and Amazon EventBridge invoke Lambda functions asynchronously. When you invoke a function asynchronously, the Lambda service places the event in an internal queue and returns a success response without additional information. A separate process reads the events from the queue and sends those to the function.
You can configure how a Lambda function handles the errors either by implementing error handling within the code and using the error handling features provided by the Lambda service. The following diagram depicts the solution options for observing and handling errors in asynchronous invocations.
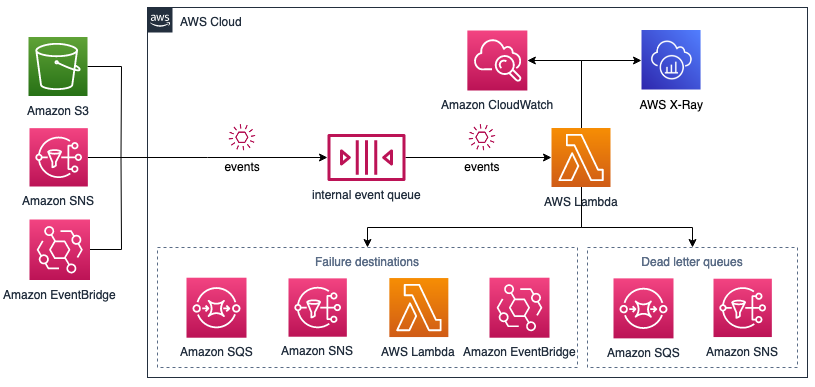
Architectural overview
Understanding the error behavior
When you invoke a function, two types of errors can occur. Invocation errors occur if the Lambda service rejects the request before the function receives it (throttling and system errors (400-series and 500-series)). Function errors occur when the function’s code or runtime returns an error (exceptions and timeouts). The Lambda service retries the function invocation if it encounters unhandled errors in an asynchronous invocation.
The retry behavior is different for invocation errors and function errors. For function errors, the Lambda service retries twice by default, and these additional invocations incur cost. For throttling and system errors, the service returns the event to the event queue and attempts to run the function again for up to 6 hours, using exponential backoff. You can control the default retry behavior by setting the maximum age of an event (up to 6 hours) and the retry attempts (0, 1 or 2). This allows you to limit the number of retries and avoids retrying obsolete events.
Handling the errors
Depending on the error type and behaviors, you can use the following options to implement error handling in Lambda asynchronous invocations.
Lambda function code
The most typical approach to handling errors is to address failures directly in the function code. While implementing this approach varies across programming languages, it commonly involves the use of a try/catch block in your code.
Error handling within the code may not cover all potential errors that could occur during the invocation. It may also affect Lambda error metrics in CloudWatch if you suppress the error. You can address these scenarios by using the error handling features provided by Lambda.
Failure destinations
You can configure Lambda to send an invocation record to another service, such as Amazon SQS, SNS, Lambda, or EventBridge, using AWS Lambda Destination. The invocation record contains details about the request and response in JSON format. You can configure separate destinations for events that are processed successfully, and events that fail all processing attempts.
With failure destinations, after exhausting all retries, Lambda sends a JSON document with details about the invocation and error to the destination. You can use this information to determine re-processing strategy (for example, extended logging, separate error flow, manual processing).
For example, to use Lambda destinations in an AWS Serverless Application Model (AWS SAM) template:
ProcessOrderForShipping: Type: AWS::Serverless::Function Properties: Description: Function that processes order before shipping Handler: src/process\_order\_for\_shipping.lambda\_handler EventInvokeConfig: DestinationConfig: OnSuccess: Type: SQS Destination: !GetAtt ShipmentsJobsQueue.Arn OnFailure: Type: Lambda Destination: !GetAtt ErrorHandlingFunction.ArnDead-letter queues
You can use dead-letter queues (DLQ) to capture failed events for re-processing. With DLQs, message attributes capture error details. You can configure a standard SQS queue or standard SNS topic as a dead-letter queue for discarded events. For dead-letter queues, Lambda only sends the content of the event, without details about the response.
This is an example of using dead-letter queues in an AWS SAM template:
SendOrderToShipping: Type: AWS::Serverless::Function Properties: Description: Function that sends order to shipping Handler: src/send\_order\_to\_shipping.lambda\_handler DeadLetterQueue: Type: SQS TargetArn: !GetAtt OrderShippingFunctionDLQ.Arn Design considerations
There are a number of design considerations when using DLQs:
- Error handling within the function code works well for issues that you can easily address in the code. For example, retrying database transactions in the case of failures because of disruptions in network connectivity.
- Scenarios that require complex error handling logic (for example, sending failed messages for manual re-processing) are better handled using Lambda service features. This approach would keep the function code simpler and easy to maintain.
- Even though the dead-letter queue’s behavior is the same as an on-failure destination, a dead-letter queue is part of a function’s version-specific configuration.
- Invocation records sent to on-failure destinations contain more information about the failure than DLQ message attributes. This includes the failure condition, error message, stack trace, request, and response payloads.
- Lambda destinations also support additional targets, such as other Lambda functions and EventBridge. This allows destinations to give you more visibility and control of function execution results, and reduce code.
Gaining visibility into errors
Understanding of the behavior and errors cannot rely on error handling alone.
You also want to know why errors address the underlying issues. You must also know when there is elevated error rate, the expected baseline for the errors, other activities in the system when errors happen. Monitoring and observability, including metrics, logs and tracing, brings visibility to the errors and underlying issues.
Metrics
When a function finishes processing an event, Lambda sends metrics about the invocation to Amazon CloudWatch. This includes metrics for the errors that happen during the invocation that you should monitor and react to:
- Errors – the number of invocations that result in a function error (include exceptions that both your code and the Lambda runtime throw).
- Throttles – the number of invocation requests that are throttled (note that throttled requests and other invocation errors don’t count as errors in the previous metric).
There are also metrics specific to the errors in asynchronous invocations:
- AsyncEventsDropped – the number of events that are dropped without successfully running the function.
- DeadLetterErrors – the number of times that Lambda attempts to send an event to a dead-letter queue (DLQ) but fails (typically because of mis-configured resources or size limits).
- DestinationDeliveryFailures – the number of times that Lambda attempts to send an event to a destination but fails (typically because of permissions, mis-configured resources, or size limits).
CloudWatch Logs
Lambda automatically sends logs to Amazon CloudWatch Logs. You can write to these logs using the standard logging functionality for your programming language. The resulting logs are in the CloudWatch Logs group that is specific to your function, named /aws/lambda/<function name>. You can use CloudWatch Logs Insights to query logs across multiple functions.
AWS X-Ray
AWS X-Ray can visualize the components of your application, identify performance bottlenecks, and troubleshoot requests that resulted in an error. Keep in mind that AWS X-Ray does not trace all requests. The sampling rate is one request per second and 5 percent of additional requests (this is non-configurable). Do not rely on AWS X-Ray as an only tool while troubleshooting a particular failed invocation as it may be missing in the sampled traces.
Conclusion
This blog post walks through error handling in the asynchronous Lambda function invocations using various approaches and discusses how to gain observability into those errors.
For more detail on the topics covered, visit:
- Using Amazon SQS dead-letter queues to replay messages
- Introducing AWS Lambda Destinations
- Introducing new asynchronous invocation metrics for AWS Lambda
- Operating Lambda: Using CloudWatch Logs Insights
For more serverless learning resources, visit Serverless Land.
This post is written by Josh Kahn, Tech Leader, and Chloe Jeon, Senior PMTes Lambda.
Serverless applications can lower the total cost of ownership (TCO) when compared to a server-based cloud execution model because it effectively shifts operational responsibilities such as managing servers to a cloud provider. Deloitte research on serverless TCO with Fortune 100 clients across industries show that serverless applications can offer up to 57% cost savings compared with server-based solutions.
Serverless applications can offer lower costs in:
- Initial development: Serverless enables builders to be more agile, deliver features more rapidly, and focus on differentiated business logic.
- Ongoing maintenance and infrastructure: Serverless shifts operational burden to AWS. Ongoing maintenance tasks, including patching and operating system updates.
This post focuses on options available to reduce direct AWS costs when building serverless applications. AWS Lambda is often the compute layer in these workloads and may comprise a meaningful portion of the overall cost.
To help optimize your Lambda-related costs, this post discusses some of the most commonly used cost optimization techniques with an emphasis on configuration changes over code updates. This post is intended for architects and developers new to building with serverless.
Building with serverless makes both experimentation and iterative improvement easier. All of the techniques described here can be applied before application development, or after you have deployed your application to production. The techniques are roughly by applicability: The first can apply to any workload; the last applies to a smaller number of workloads.
Right-sizing your Lambda functions
Lambda uses a pay-per-use cost model that is driven by three metrics:
- Memory configuration: allocated memory from 128MB to 10,240MB. CPU and other resources available to the function are allocated proportionally to memory.
- Function duration: time function runs, measures in milliseconds.
- Number of invocations: the number of times your function runs.
Over-provisioning memory is one of the primary drivers of increased Lambda cost. This is particularly acute among builders new to Lambda who are used to provisioning hosts running multiple processes. Lambda scales such that each execution environment of a function only handles one request at a time. Each execution environment has access to fixed resources (memory, CPU, storage) to complete work on the request.
By right-sizing the memory configuration, the function has the resources to complete its work and you are paying for only the needed resources. While you also have direct control of function duration, this is a less effective cost optimization to implement. The engineering costs to create a few milliseconds of savings may outweigh the cost savings. Depending on the workload, the number of times your function is invoked may be outside your control. The next section discusses a technique to reduce the number of invocations for some types of workloads.
Memory configuration is accessible via the AWS Management Console or your favorite infrastructure as code (IaC) option. The memory configuration setting defines allocated memory, not memory used by your function. Right-sizing memory is an adjustment that can reduce the cost (or increase performance) of your function. However, lowering the function-memory may not always result in cost savings. Lowering function memory means lowering available CPU for the Lambda function, which could increase the function duration, resulting in either no cost savings or higher cost. It is important to identify the optimal memory configuration for cost savings while preserving performance.
AWS offers two approaches to right-sizing memory allocation: AWS Lambda Power Tuning and AWS Compute Optimizer.
AWS Lambda Power Tuning is an open-source tool that can be used to empirically find the optimal memory configuration for your function by trading off cost against execution time. The tool runs multiple concurrent versions of your function against mock input data at different memory allocations. The result is a chart that can help you find the “sweet spot” between cost and duration/performance. Depending on the workload, you may prioritize one over the other. AWS Lambda Power Tuning is a good choice for new functions and can also help select between the two instruction set architectures offered by Lambda.

AWS Compute Optimizer uses machine learning to recommend an optimal memory configuration based on historical data. Compute Optimizer requires that your function be invoked at least 50 times over the trailing 14 days to provide a recommendation based on past utilization, so is most effective once your function is in production.
Both Lambda Power Tuning and Compute Optimizer help derive the right-sized memory allocation for your function. Use this value to update the configuration of your function using the AWS Management Console or IaC.
This post includes AWS Serverless Application Model (AWS SAM) sample code throughout to demonstrate how to implement optimizations. You can also use AWS Cloud Development Kit (AWS CDK), Terraform, Serverless Framework, and other IaC tools to implement the same changes.
MyFunction: Type: AWS::Serverless::Function Properties: Runtime: nodejs18.x Handler: app.handler MemorySize: 1024 # Set memory configuration to optimize for cost or performanceSetting a realistic function timeout
Lambda functions are configured with a maximum time that each invocation can run, up to 15 minutes. Setting an appropriate timeout can be beneficial in containing costs of your Lambda-based application. Unhandled exceptions, blocking actions (for example, opening a network connection), slow dependencies, and other conditions can lead to longer-running functions or functions that run until the configured timeout. Proper timeouts are the best protection against both slow and erroneous code. At some point, the work the function is performing and the per-millisecond cost of that work is wasted.
Our recommendation is to set a timeout of less than 29-seconds for all synchronous invocations, or those in which the caller is waiting for a response. Longer timeouts are appropriate for asynchronous invocations, but consider timeouts longer than 1-minute to be an exception that requires review and testing.
Using Graviton
Lambda offers two instruction set architectures in most AWS Regions: x86 and arm64.
Choosing Graviton can save money in two ways. First, your functions may run more efficiently due to the Graviton2 architecture. Second, you may pay less for the time that they run. Lambda functions powered by Graviton2 are designed to deliver up to 19 percent better performance at 20 percent lower cost. Consider starting with Graviton when developing new Lambda functions, particularly those that do not require natively compiled binaries.
If your function relies on native compiled binaries or is packaged as a container image, you must rebuild to move between arm64 and x86. Lambda layers may also include dependencies targeted for one architecture or the other. We encourage you to review dependencies and test your function before changing the architecture. The AWS Lambda Power Tuning tool also allows you to compare the price and performance of arm64 and x86 at different memory settings.
You can modify the architecture configuration of your function in the console or your IaC of choice. For example, in AWS SAM:
MyFunction: Type: AWS::Serverless::Function Properties: Architectures: - arm64. # Set architecture to use Graviton2 Runtime: nodejs18.x Handler: app.handlerFiltering incoming events
Lambda is integrated with over 200 event sources, including Amazon SQS, Amazon Kinesis Data Streams, Amazon DynamoDB Streams, Amazon Managed Streaming for Apache Kafka, and Amazon MQ. The Lambda service integrates with these event sources to retrieve messages and invokes your function as needed to process those messages.
When working with one of these event sources, builders can configure filters to limit the events sent to your function. This technique can greatly reduce the number of times your function is invoked depending on the number of events and specificity of your filters. When not using event filtering, the function must be invoked to first determine if an event should be processed before performing the actual work. Event filtering alleviates the need to perform this upfront check while reducing the number of invocations.
For example, you may only want a function to run when orders of over $200 are found in a message on a Kinesis data stream. You can configure an event filtering pattern using the console or IaC in a manner similar to memory configuration.
To implement the Kinesis stream filter using AWS SAM:
MyFunction: Type: AWS::Serverless::Function Properties: Runtime: nodejs18.x Handler: app.handler Events: Type: Kinesis Properties: StartingPosition: LATEST Stream: "arn:aws:kinesis:us-east-1:0123456789012:stream/orders" FilterCriteria: Filters: - Pattern: '{ "data" : { "order" : { "value" : [{ "numeric": [">", 200] }] } } }'If an event satisfies one of the event filters associated with the event source, Lambda sends the event to your function for processing. Otherwise, the event is discarded as processed successfully without invoking the function.
If you are building or running a Lambda function that is invoked by one of the previously mentioned event sources, it’s recommended that you review the filtering options available. This technique requires no code changes to your Lambda function – even if the function performs some preprocessing check, that check still completes successfully with filtering implemented.
To learn more, read Filtering event sources for AWS Lambda functions.
Avoiding recursion
You may be familiar with the programming concept of a recursive function or a function/routine that calls itself. Though rare, customers sometimes unintentionally build recursion in their architecture, so a Lambda function continuously calls itself.
The most common recursive pattern is between Lambda and Amazon S3. Actions in an S3 bucket can trigger a Lambda function, and recursion can occur when that Lambda function writes back to the same bucket.
Consider a use case in which a Lambda function is used to generate a thumbnail of user-submitted images. You configure the bucket to trigger the thumbnail generation function when a new object is put in the bucket. What happens if the Lambda function writes the thumbnail to the same bucket? The process starts anew and the Lambda function then runs on the thumbnail image itself. This is recursion and can lead to an infinite loop condition.
While there are multiple ways to prevent against this condition, it’s best practice to use a second S3 bucket to store thumbnails. This approach minimizes changes to the architecture as you do not need to change the notification settings nor the primary S3 bucket. To learn about other approaches, read Avoiding recursive invocation with Amazon S3 and AWS Lambda.
If you do encounter recursion in your architecture, set Lambda reserved concurrency to zero to stop the function from running. Allow minutes to hours before lifting the reserved concurrency cap. Since S3 events are asynchronous invocations that have automatic retries, you may continue to see recursion until you resolve the issue or all events have expired.
Conclusion
Lambda offers a number of techniques that you can use to minimize infrastructure costs whether you are just getting started with Lambda or have numerous functions already deployed in production. When combined with the lower costs of initial development and ongoing maintenance, serverless can offer a low total cost of ownership. Get hands-on with these techniques and more with the Serverless Optimization Workshop.
To learn more about serverless architectures, find reusable patterns, and keep up-to-date, visit Serverless Land.
This blog post is written by Ben Minahan, DevOps Consultant, and Amir Sotoodeh, Machine Learning Engineer.
Machine learning workloads can be costly, and artificial intelligence/machine learning (AI/ML) teams can have a difficult time tracking and maintaining efficient resource utilization. ML workloads often utilize GPUs extensively, so typical application performance metrics such as CPU, memory, and disk usage don’t paint the full picture when it comes to system performance. Additionally, data scientists conduct long-running experiments and model training activities on existing compute instances that fit their unique specifications. Forcing these experiments to be run on newly provisioned infrastructure with proper monitoring systems installed might not be a viable option.
In this post, we describe how to track GPU utilization across all of your AI/ML workloads and enable accurate capacity planning without needing teams to use a custom Amazon Machine Image (AMI) or to re-deploy their existing infrastructure. You can use Amazon CloudWatch to track GPU utilization, and leverage AWS Systems Manager Run Command to install and configure the agent across your existing fleet of GPU-enabled instances.
Overview
First, make sure that your existing Amazon Elastic Compute Cloud (Amazon EC2) instances have the Systems Manager Agent installed, and also have the appropriate level of AWS Identity and Access Management (IAM) permissions to run the Amazon CloudWatch Agent. Next, specify the configuration for the CloudWatch Agent in Systems Manager Parameter Store, and then deploy the CloudWatch Agent to our GPU-enabled EC2 instances. Finally, create a CloudWatch Dashboard to analyze GPU utilization.
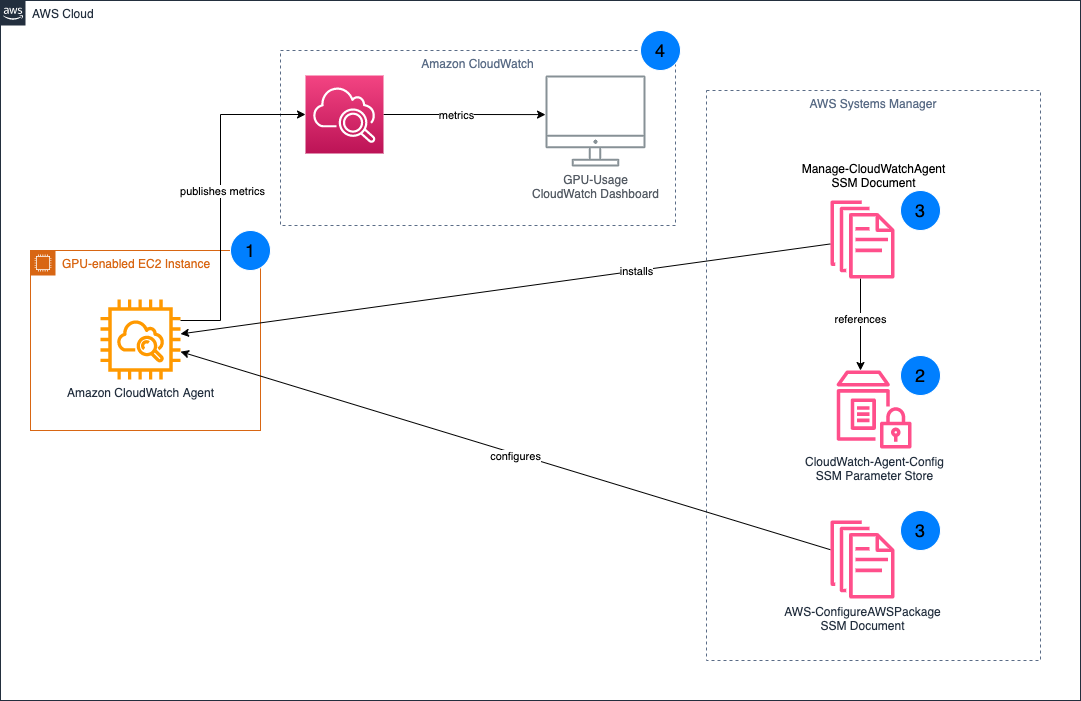
- Install the CloudWatch Agent on your existing GPU-enabled EC2 instances.
- Your CloudWatch Agent configuration is stored in Systems Manager Parameter Store.
- Systems Manager Documents are used to install and configure the CloudWatch Agent on your EC2 instances.
- GPU metrics are published to CloudWatch, which you can then visualize through the CloudWatch Dashboard.
Prerequisites
This post assumes you already have GPU-enabled EC2 workloads running in your AWS account. If the EC2 instance doesn’t have any GPUs, then the custom configuration won’t be applied to the CloudWatch Agent. Instead, the default configuration is used. For those instances, leveraging the CloudWatch Agent’s default configuration is better suited for tracking resource utilization.
For the CloudWatch Agent to collect your instance’s GPU metrics, the proper NVIDIA drivers must be installed on your instance. Several AWS official AMIs including the Deep Learning AMI already have these drivers installed. To see a list of AMIs with the NVIDIA drivers pre-installed, and for full installation instructions for Linux-based instances, see Install NVIDIA drivers on Linux instances.
Additionally, deploying and managing the CloudWatch Agent requires the instances to be running. If your instances are currently stopped, then you must start them to follow the instructions outlined in this post.
Preparing your EC2 instances
You utilize Systems Manager to deploy the CloudWatch Agent, so make sure that your EC2 instances have the Systems Manager Agent installed. Many AWS-provided AMIs already have the Systems Manager Agent installed. For a full list of the AMIs which have the Systems Manager Agent pre-installed, see Amazon Machine Images (AMIs) with SSM Agent preinstalled. If your AMI doesn’t have the Systems Manager Agent installed, see Working with SSM Agent for instructions on installing based on your operating system (OS).
Once installed, the CloudWatch Agent needs certain permissions to accept commands from Systems Manager, read Systems Manager Parameter Store entries, and publish metrics to CloudWatch. These permissions are bundled into the managed IAM policies AmazonEC2RoleforSSM, AmazonSSMReadOnlyAccess, and CloudWatchAgentServerPolicy. To create a new IAM role and associated IAM instance profile with these policies attached, you can run the following AWS Command Line Interface (AWS CLI) commands, replacing <REGION\_NAME> with your AWS region, and <INSTANCE\_ID> with the EC2 Instance ID that you want to associate with the instance profile:
aws iam create-role --role-name CloudWatch-Agent-Role --assume-role-policy-document '{"Statement":{"Effect":"Allow","Principal":{"Service":"ec2.amazonaws.com"},"Action":"sts:AssumeRole"}}'aws iam attach-role-policy --role-name CloudWatch-Agent-Role --policy-arn arn:aws:iam::aws:policy/service-role/AmazonEC2RoleforSSMaws iam attach-role-policy --role-name CloudWatch-Agent-Role --policy-arn arn:aws:iam::aws:policy/AmazonSSMReadOnlyAccessaws iam attach-role-policy --role-name CloudWatch-Agent-Role --policy-arn arn:aws:iam::aws:policy/CloudWatchAgentServerPolicyaws iam create-instance-profile --instance-profile-name CloudWatch-Agent-Instance-Profileaws iam add-role-to-instance-profile --instance-profile-name CloudWatch-Agent-Instance-Profile --role-name CloudWatch-Agent-Roleaws ec2 associate-iam-instance-profile --region <REGION\_NAME> --instance-id <INSTANCE\_ID> --iam-instance-profile Name=CloudWatch-Agent-Instance-ProfileAlternatively, you can attach the IAM policies to your existing IAM role associated with an existing IAM instance profile.
aws iam attach-role-policy --role-name <ROLE\_NAME> --policy-arn arn:aws:iam::aws:policy/service-role/AmazonEC2RoleforSSMaws iam attach-role-policy --role-name <ROLE\_NAME> --policy-arn arn:aws:iam::aws:policy/AmazonSSMReadOnlyAccessaws iam attach-role-policy --role-name <ROLE\_NAME> --policy-arn arn:aws:iam::aws:policy/CloudWatchAgentServerPolicyaws ec2 associate-iam-instance-profile --region <REGION\_NAME> --instance-id <INSTANCE\_ID> --iam-instance-profile Name=<INSTANCE\_PROFILE>Once complete, you should see that your EC2 instance is associated with the appropriate IAM role.
This role should have the AmazonEC2RoleforSSM, AmazonSSMReadOnlyAccess and CloudWatchAgentServerPolicy IAM policies attached.

Configuring and deploying the CloudWatch Agent
Before deploying the CloudWatch Agent onto our EC2 instances, make sure that those agents are properly configured to collect GPU metrics. To do this, you must create a CloudWatch Agent configuration and store it in Systems Manager Parameter Store.
Copy the following into a file cloudwatch-agent-config.json:
{ "agent": { "metrics\_collection\_interval": 60, "run\_as\_user": "cwagent" }, "metrics": { "aggregation\_dimensions": [ [ "InstanceId" ] ], "append\_dimensions": { "AutoScalingGroupName": "${aws:AutoScalingGroupName}", "ImageId": "${aws:ImageId}", "InstanceId": "${aws:InstanceId}", "InstanceType": "${aws:InstanceType}" }, "metrics\_collected": { "cpu": { "measurement": [ "cpu\_usage\_idle", "cpu\_usage\_iowait", "cpu\_usage\_user", "cpu\_usage\_system" ], "metrics\_collection\_interval": 60, "resources": [ "*" ], "totalcpu": false }, "disk": { "measurement": [ "used\_percent", "inodes\_free" ], "metrics\_collection\_interval": 60, "resources": [ "*" ] }, "diskio": { "measurement": [ "io\_time" ], "metrics\_collection\_interval": 60, "resources": [ "*" ] }, "mem": { "measurement": [ "mem\_used\_percent" ], "metrics\_collection\_interval": 60 }, "swap": { "measurement": [ "swap\_used\_percent" ], "metrics\_collection\_interval": 60 }, "nvidia\_gpu": { "measurement": [ "utilization\_gpu", "temperature\_gpu", "utilization\_memory", "fan\_speed", "memory\_total", "memory\_used", "memory\_free", "pcie\_link\_gen\_current", "pcie\_link\_width\_current", "encoder\_stats\_session\_count", "encoder\_stats\_average\_fps", "encoder\_stats\_average\_latency", "clocks\_current\_graphics", "clocks\_current\_sm", "clocks\_current\_memory", "clocks\_current\_video" ], "metrics\_collection\_interval": 60 } } }}Run the following AWS CLI command to deploy a Systems Manager Parameter CloudWatch-Agent-Config, which contains a minimal agent configuration for GPU metrics collection. Replace <REGION\_NAME> with your AWS Region.
aws ssm put-parameter \--region <REGION\_NAME> \--name CloudWatch-Agent-Config \--type String \--value file://cloudwatch-agent-config.jsonNow you can see a CloudWatch-Agent-Config parameter in Systems Manager Parameter Store, containing your CloudWatch Agent’s JSON configuration.

Next, install the CloudWatch Agent on your EC2 instances. To do this, you can leverage Systems Manager Run Command, specifically the AWS-ConfigureAWSPackage document which automates the CloudWatch Agent installation.
- Run the following AWS CLI command, replacing <REGION\_NAME> with the Region into which your instances are deployed, and <INSTANCE\_ID> with the EC2 Instance ID on which you want to install the CloudWatch Agent.
aws ssm send-command \--query 'Command.CommandId' \--region <REGION\_NAME> \--instance-ids <INSTANCE\_ID> \--document-name AWS-ConfigureAWSPackage \--parameters '{"action":["Install"],"installationType":["In-place update"],"version":["latest"],"name":["AmazonCloudWatchAgent"]}'2. To monitor the status of your command, use the get-command-invocation AWS CLI command. Replace <COMMAND\_ID> with the command ID output from the previous step, <REGION\_NAME> with your AWS region, and <INSTANCE\_ID> with your EC2 instance ID.
aws ssm get-command-invocation --query Status --region <REGION\_NAME> --command-id <COMMAND\_ID> --instance-id <INSTANCE\_ID>3.Wait for the command to show the status Success before proceeding.
$ aws ssm send-command \ --query 'Command.CommandId' \ --region us-east-2 \ --instance-ids i-0123456789abcdef \ --document-name AWS-ConfigureAWSPackage \ --parameters '{"action":["Install"],"installationType":["Uninstall and reinstall"],"version":["latest"],"additionalArguments":["{}"],"name":["AmazonCloudWatchAgent"]}'"5d8419db-9c48-434c-8460-0519640046cf"$ aws ssm get-command-invocation --query Status --region us-east-2 --command-id 5d8419db-9c48-434c-8460-0519640046cf --instance-id i-0123456789abcdef"Success"Repeat this process for all EC2 instances on which you want to install the CloudWatch Agent.
Next, configure the CloudWatch Agent installation. For this, once again leverage Systems Manager Run Command. However, this time the AmazonCloudWatch-ManageAgent document which applies your custom agent configuration is stored in the Systems Manager Parameter Store to your deployed agents.
- Run the following AWS CLI command, replacing <REGION\_NAME> with the Region into which your instances are deployed, and <INSTANCE\_ID> with the EC2 Instance ID on which you want to configure the CloudWatch Agent.
aws ssm send-command \--query 'Command.CommandId' \--region <REGION\_NAME> \--instance-ids <INSTANCE\_ID> \--document-name AmazonCloudWatch-ManageAgent \--parameters '{"action":["configure"],"mode":["ec2"],"optionalConfigurationSource":["ssm"],"optionalConfigurationLocation":["/CloudWatch-Agent-Config"],"optionalRestart":["yes"]}'2. To monitor the status of your command, utilize the get-command-invocation AWS CLI command. Replace <COMMAND\_ID> with the command ID output from the previous step, <REGION\_NAME> with your AWS region, and <INSTANCE\_ID> with your EC2 instance ID.
aws ssm get-command-invocation --query Status --region <REGION\_NAME> --command-id <COMMAND\_ID> --instance-id <INSTANCE\_ID>3. Wait for the command to show the status Success before proceeding.
$ aws ssm send-command \ --query 'Command.CommandId' \ --region us-east-2 \ --instance-ids i-0123456789abcdef \ --document-name AmazonCloudWatch-ManageAgent \ --parameters '{"action":["configure"],"mode":["ec2"],"optionalConfigurationSource":["ssm"],"optionalConfigurationLocation":["/CloudWatch-Agent-Config"],"optionalRestart":["yes"]}'"9a4a5c43-0795-4fd3-afed-490873eaca63"$ aws ssm get-command-invocation --query Status --region us-east-2 --command-id 9a4a5c43-0795-4fd3-afed-490873eaca63 --instance-id i-0123456789abcdef"Success"Repeat this process for all EC2 instances on which you want to install the CloudWatch Agent. Once finished, the CloudWatch Agent installation and configuration is complete, and your EC2 instances now report GPU metrics to CloudWatch.
Visualize your instance’s GPU metrics in CloudWatch
Now that your GPU-enabled EC2 Instances are publishing their utilization metrics to CloudWatch, you can visualize and analyze these metrics to better understand your resource utilization patterns.
The GPU metrics collected by the CloudWatch Agent are within the CWAgent namespace. Explore your GPU metrics using the CloudWatch Metrics Explorer, or deploy our provided sample dashboard.
- Copy the following into a file, cloudwatch-dashboard.json, replacing instances of <REGION\_NAME> with your Region:
{ "widgets": [ { "height": 10, "width": 24, "y": 16, "x": 0, "type": "metric", "properties": { "metrics": [ [{"expression": "SELECT AVG(nvidia\_smi\_utilization\_gpu) FROM SCHEMA(\"CWAgent\", InstanceId) GROUP BY InstanceId","id": "q1"}] ], "view": "timeSeries", "stacked": false, "region": "<REGION\_NAME>", "stat": "Average", "period": 300, "title": "GPU Core Utilization", "yAxis": { "left": {"label": "Percent","max": 100,"min": 0,"showUnits": false} } } }, { "height": 7, "width": 8, "y": 0, "x": 0, "type": "metric", "properties": { "metrics": [ [{"expression": "SELECT AVG(nvidia\_smi\_utilization\_gpu) FROM SCHEMA(\"CWAgent\", InstanceId)", "label": "Utilization","id": "q1"}] ], "view": "gauge", "stacked": false, "region": "<REGION\_NAME>", "stat": "Average", "period": 300, "title": "Average GPU Core Utilization", "yAxis": {"left": {"max": 100, "min": 0} }, "liveData": false } }, { "height": 9, "width": 24, "y": 7, "x": 0, "type": "metric", "properties": { "metrics": [ [{ "expression": "SEARCH(' MetricName=\"nvidia\_smi\_memory\_used\" {\"CWAgent\", InstanceId} ', 'Average')", "id": "m1", "visible": false }], [{ "expression": "SEARCH(' MetricName=\"nvidia\_smi\_memory\_total\" {\"CWAgent\", InstanceId} ', 'Average')", "id": "m2", "visible": false }], [{ "expression": "SEARCH(' MetricName=\"mem\_used\_percent\" {CWAgent, InstanceId} ', 'Average')", "id": "m3", "visible": false }], [{ "expression": "100*AVG(m1)/AVG(m2)", "label": "GPU", "id": "e2", "color": "#17becf" }], [{ "expression": "AVG(m3)", "label": "RAM", "id": "e3" }] ], "view": "timeSeries", "stacked": false, "region": "<REGION\_NAME>", "stat": "Average", "period": 300, "yAxis": { "left": {"min": 0,"max": 100,"label": "Percent","showUnits": false} }, "title": "Average Memory Utilization" } }, { "height": 7, "width": 8, "y": 0, "x": 8, "type": "metric", "properties": { "metrics": [ [ { "expression": "SEARCH(' MetricName=\"nvidia\_smi\_memory\_used\" {\"CWAgent\", InstanceId} ', 'Average')", "id": "m1", "visible": false } ], [ { "expression": "SEARCH(' MetricName=\"nvidia\_smi\_memory\_total\" {\"CWAgent\", InstanceId} ', 'Average')", "id": "m2", "visible": false } ], [ { "expression": "100*AVG(m1)/AVG(m2)", "label": "Utilization", "id": "e2" } ] ], "sparkline": true, "view": "gauge", "region": "<REGION\_NAME>", "stat": "Average", "period": 300, "yAxis": { "left": {"min": 0,"max": 100} }, "liveData": false, "title": "GPU Memory Utilization" } } ]}2. run the following AWS CLI command, replacing <REGION\_NAME> with the name of your Region:
aws cloudwatch put-dashboard \ --region <REGION\_NAME> \ --dashboard-name My-GPU-Usage \ --dashboard-body file://cloudwatch-dashboard.jsonView the My-GPU-Usage CloudWatch dashboard in the CloudWatch console for your AWS region..

Cleaning Up
To avoid incurring future costs for resources created by following along in this post, delete the following:
- My-GPU-Usage CloudWatch Dashboard
- CloudWatch-Agent-Config Systems Manager Parameter
- CloudWatch-Agent-Role IAM Role
Conclusion
By following along with this post, you deployed and configured the CloudWatch Agent across your GPU-enabled EC2 instances to track GPU utilization without pausing in-progress experiments and model training. Then, you visualized the GPU utilization of your workloads with a CloudWatch Dashboard to better understand your workload’s GPU usage and make more informed scaling and cost decisions. For other ways that Amazon CloudWatch can improve your organization’s operational insights, see the Amazon CloudWatch documentation.
This post is written by Suresh Poopandi, Senior Solutions Architect, Global Life Sciences.
AWS Lambda now supports Python 3.10 as both a managed runtime and container base image. With this release, Python developers can now take advantage of new features and improvements introduced in Python 3.10 when creating serverless applications on Lambda.
Enhancements in Python 3.10 include structural pattern matching, improved error messages, and performance enhancements. This post outlines some of the benefits of Python 3.10 and how to use this version in your Lambda functions.
AWS has also published a preview Lambda container base image for Python 3.11. Customers can use this image to get an early look at Python 3.11 support in Lambda. This image is subject to change and should not be used for production workloads. To provide feedback on this image, and for future updates on Python 3.11 support, see https://github.com/aws/aws-lambda-base-images/issues/62.
What’s new in Python 3.10
Thanks to its simplicity, readability, and extensive community support, Python is a popular language for building serverless applications. The Python 3.10 release includes several new features, such as:
- Structural pattern matching (PEP 634): Structural pattern matching is one of the most significant additions to Python 3.10. With structural pattern matching, developers can use patterns to match against data structures such as lists, tuples, and dictionaries and run code based on the match. This feature enables developers to write code that processes complex data structures more easily and can improve code readability and maintainability.
- Parenthesized context managers (BPO-12782): Python 3.10 introduces a new syntax for parenthesized context managers, making it easier to read and write code that uses the “with” statement. This feature simplifies managing resources such as file handles or database connections, ensuring they are released correctly.
- Writing union types as X | Y (PEP 604): Python 3.10 allows writing union types as X | Y instead of the previous versions’ syntax of typing Union[X, Y]. Union types represent a value that can be one of several types. This change does not affect the functionality of the code and is backward-compatible, so code written with the previous syntax will still work. The new syntax aims to reduce boilerplate code, and improve readability and maintainability of Python code by providing a more concise and intuitive syntax for union types.
- User-defined type guards (PEP 647): User-defined type guards allow developers to define their own type guards to handle custom data types or to refine the types of built-in types. Developers can define their own functions that perform more complex type checks as user-defined typed guards. This feature improves Python code readability, maintainability, and correctness, especially in projects with complex data structures or custom data types.
- Improved error messages: Python 3.10 has improved error messages, providing developers with more information about the source of the error and suggesting possible solutions. This helps developers identify and fix issues more quickly. The improved error messages in Python 3.10 include more context about the error, such as the line number and location where the error occurred, as well as the exact nature of the error. Additionally, Python 3.10 error messages now provide more helpful information about how to fix the error, such as suggestions for correct syntax or usage.
Performance improvements
The faster PEP 590 vectorcall calling convention allows for quicker and more efficient Python function calls, particularly those that take multiple arguments. The specific built-in functions that benefit from this optimization include map(), filter(), reversed(), bool(), and float(). By using the vectorcall calling convention, according to Python 3.10 release notes, these inbuilt functions’ performance improved by a factor of 1.26x.
When a function is defined with annotations, these are stored in a dictionary that maps the parameter names to their respective annotations. In previous versions of Python, this dictionary was created immediately when the function was defined. However, in Python 3.10, this dictionary is created only when the annotations are accessed, which can happen when the function is called. By delaying the creation of the annotation dictionary until it is needed, Python can avoid the overhead of creating and initializing the dictionary during function definition. This can result in a significant reduction in CPU time, as the dictionary creation can be a time-consuming operation, particularly for functions with many parameters or complex annotations.
In Python 3.10, the LOAD\_ATTR instruction, which is responsible for loading attributes from objects in the code, has been improved with a new mechanism called the “per opcode cache”. This mechanism works by storing frequently accessed attributes in a cache specific to each LOAD\_ATTR instruction, which reduces the need for repeated attribute lookups. As a result of this improvement, according to Python 3.10 release notes, the LOAD\_ATTR instruction is now approximately 36% faster when accessing regular attributes and 44% faster when accessing attributes defined using the slots mechanism.
In Python, the str(), bytes(), and bytearray() constructors are used to create new instances of these types from existing data or values. Based on the result of the performance tests conducted as part of BPO-41334, constructors str(), bytes(), and bytearray() are around 30–40% faster for small objects.
Lambda functions developed with Python that read and process Gzip compressed files can gain a performance improvement. Adding \_BlocksOutputBuffer for the bz2/lzma/zlib module eliminated the overhead of resizing bz2/lzma buffers, preventing excessive memory footprint of the zlib buffer. According to Python 3.10 release notes, bz2 decompression is now 1.09x faster, lzma decompression 1.20x faster, and GzipFile read is 1.11x faster
Using Python 3.10 in Lambda
AWS Management Console
To use the Python 3.10 runtime to develop your Lambda functions, specify a runtime parameter value Python 3.10 when creating or updating a function. Python 3.10 version is now available in the Runtime dropdown in the Create function page.

To update an existing Lambda function to Python 3.10, navigate to the function in the Lambda console, then choose Edit in the Runtime settings panel. The new version of Python is available in the Runtime dropdown:

AWS Serverless Application Model (AWS SAM)
In AWS SAM, set the Runtime attribute to python3.10 to use this version.
AWSTemplateFormatVersion: '2010-09-09'Transform: AWS::Serverless-2016-10-31Description: Simple Lambda Function MyFunction: Type: AWS::Serverless::Function Properties: Description: My Python Lambda Function CodeUri: my\_function/ Handler: lambda\_function.lambda\_handler Runtime: python3.10AWS SAM supports the generation of this template with Python 3.10 out of the box for new serverless applications using the sam init command. Refer to the AWS SAM documentation here.
AWS Cloud Development Kit (AWS CDK)
In the AWS CDK, set the runtime attribute to Runtime.PYTHON\_3\_10 to use this version. In Python:
from constructs import Constructfrom aws\_cdk import ( App, Stack, aws\_lambda as \_lambda)class SampleLambdaStack(Stack): def \_\_init\_\_(self, scope: Construct, id: str, **kwargs) -> None: super().\_\_init\_\_(scope, id, **kwargs) base\_lambda = \_lambda.Function(self, 'SampleLambda', handler='lambda\_handler.handler', runtime=\_lambda.Runtime.PYTHON\_3\_10, code=\_lambda.Code.from\_asset('lambda'))In TypeScript:
import * as cdk from 'aws-cdk-lib';import * as lambda from 'aws-cdk-lib/aws-lambda'import * as path from 'path';import { Construct } from 'constructs';export class CdkStack extends cdk.Stack { constructor(scope: Construct, id: string, props?: cdk.StackProps) { super(scope, id, props); // The code that defines your stack goes here // The python3.10 enabled Lambda Function const lambdaFunction = new lambda.Function(this, 'python310LambdaFunction', { runtime: lambda.Runtime.PYTHON\_3\_10, memorySize: 512, code: lambda.Code.fromAsset(path.join(\_\_dirname, '/../lambda')), handler: 'lambda\_handler.handler' }) }}AWS Lambda – Container Image
Change the Python base image version by modifying FROM statement in the Dockerfile:
FROM public.ecr.aws/lambda/python:3.10# Copy function codeCOPY lambda\_handler.py ${LAMBDA\_TASK\_ROOT}To learn more, refer to the usage tab on building functions as container images.
Conclusion
You can build and deploy functions using Python 3.10 using the AWS Management Console, AWS CLI, AWS SDK, AWS SAM, AWS CDK, or your choice of Infrastructure as Code (IaC). You can also use the Python 3.10 container base image if you prefer to build and deploy your functions using container images.
We are excited to bring Python 3.10 runtime support to Lambda and empower developers to build more efficient, powerful, and scalable serverless applications. Try Python 3.10 runtime in Lambda today and experience the benefits of this updated language version and take advantage of improved performance.
For more serverless learning resources, visit Serverless Land.
This blog post is written by Vincent Wang, GCR EC2 Specialist SA, Compute.
Streaming games from the cloud to mobile devices is an emerging technology that allows less powerful and less expensive devices to play high-quality games with lower battery consumption and less storage capacity. This technology enables a wider audience to enjoy high-end gaming experiences from their existing devices, such as smartphones, tablets, and smart TVs.
To load games for streaming on AWS, it’s necessary to use Android environments that can utilize GPU acceleration for graphics rendering and optimize for network latency. Cloud-native products, such as the Anbox Cloud Appliance or Genymotion available on the AWS Marketplace, can provide a cost-effective containerized solution for game streaming workloads on Amazon Elastic Compute Cloud (Amazon EC2).
For example, Anbox Cloud’s virtual device infrastructure can run games with low latency and high frame rates. When combined with the AWS Graviton-based Amazon EC2 G5g instances, which offer a cost reduction of up to 30% per-game stream per-hour compared to x86-based GPU instances, it enables companies to serve millions of customers in a cost-efficient manner.
In this post, we chose the Anbox Cloud Appliance to demonstrate how you can use it to stream a resource-demanding game called Genshin Impact. We use a G5g instance along with a mobile phone to run the streamed game inside of a Firefox browser application.
Overview
Graviton-based instances utilize fewer compute resources than x86-based instances due to the 64-bit architecture of Arm processors used in AWS Graviton servers. As shown in the following diagram, Graviton instances eliminate the need for cross-compilation or Android emulation. This simplifies development efforts and reduces time-to-market, thereby lowering the cost-per-stream. With G5g instances, customers can now run their Android games natively, encode CPU or GPU-rendered graphics, and stream the game over the network to multiple mobile devices.
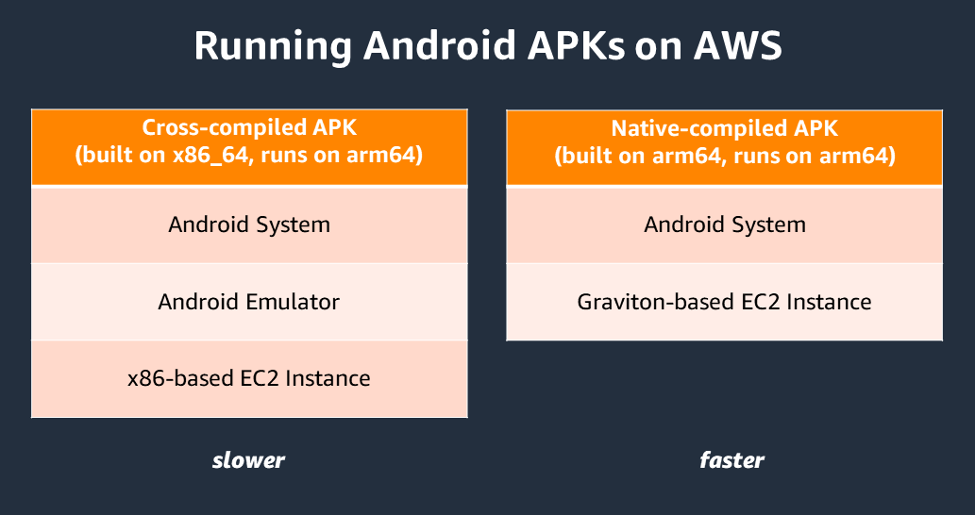
Figure 1: Architecture difference when running Android on X86-based instance and Graviton-based instance.
Real-time ray-traced rendering is required for most modern games to deliver photorealistic objects and environments with physically accurate shadows, reflections, and refractions. The G5g instance, which is powered by AWS Graviton2 processors and NVIDIA T4G Tensor Core GPUs, provides a cost-effective solution for running these resource-intensive games.
Architecture

Figure 2: Architecture of Android Streaming Game.
When streaming games from a mobile device, only input data (touchscreen, audio, etc.) is sent over the network to the game streaming server hosted on a G5g instance. Then, the input is directed to the appropriate Android container designated for that particular client. The game application running in the container processes the input and updates the game state accordingly. Then, the resulting rendered image frames are sent back to the mobile device for display on the screen. In certain games, such as multiplayer games, the streaming server must communicate with external game servers to reflect the full game state. In these cases, additional data is transferred to and from game servers and back to the mobile client. The communication between clients and the streaming server is performed using the WebRTC network protocol to minimize latency and make sure that users’ gaming experience isn’t affected.
The Graviton processor handles compute-intensive tasks, such as the Android runtime and I/O transactions on the streaming server. However, for resource-demanding games, the Nvidia GPU is utilized for graphics rendering. To scale effortlessly, the Anbox Cloud software can be utilized to manage and execute several game sessions on the same instance.
Prerequisites
First, you need an Ubuntu single sign-on (SSO) account. If you don’t have one yet, you may create one from Ubuntu One website. Then you need an Android mobile phone with Firefox or Chrome browser installed to play the streaming games.
Setup
We can install Anbox Cloud Appliance in the AWS Marketplace. Select the Arm variant so that it works on Graviton-based instances. If the subscription doesn’t work on the first try, then you receive an email which guides you to a page where you can try again.

Figure 3: Subscribe Anbox Cloud Appliance in AWS Marketplace.
In this demonstration, we select G5g.xlarge in the Instance type section and leave all settings with default values, except the storage as per the following:
- A root disk with minimum 50 GB (required)
- An additional Amazon Elastic Block Store (Amazon EBS) volume with at least 100 GB (recommended)
For the Genshin Impact demo, we recommend a specific amount of storage. However, when deploying your Android applications, you must select an appropriate storage size based on the package size. Additionally, you should choose an instance size based on the resources that you plan to utilize for your gaming sessions, such as CPU, memory, and networking. In our demo, we launched only one session from a single mobile device.
Launch the instance and wait until it reaches running status. Then you can secure shell (SSH) to the instance to configure the Android environment.
Install Anbox cloud
To make sure of the security and reliability of some of the package repositories used, we update the CUDA Linux GPG Repository Key. View this Nvidia blog post for more details on this procedure.
| $ sudo apt-key del 7fa2af80 $ wget https://developer.download.nvidia.com/compute/cuda/repos/ubuntu2004/sbsa/cuda keyring\_1.0-1\_all.deb $ sudo dpkg -i cuda-keyring\_1.0-1\_all.deb |
As the Android in Anbox Cloud Appliance is running in an LXD container environment, upgrade LXD to the latest version.
| $ sudo snap refresh –channel=5.0/stable lxd |
Install the Anbox Cloud Appliance software using the following command and selecting the default answers:
| $ sudo anbox-cloud-appliance init |
Watch the status page at https://$(ec2\_public\_DNS\_name) for progress information.

Figure 4: The status of deploying Anbox Cloud.
The initialization process takes approximately 20 minutes. After it’s complete, register the Ubuntu SSO account previously created, then follow the instructions provided to finalize the process.
| $ anbox-cloud-appliance dashboard register <your Ubuntu SSO email address> |
Stream an Android game application
Use the sample from the following repo to setup the service on the streaming server:
| $ git clone https://github.com/anbox-cloud/cloud-gaming-demo.git |
Build the Flutter web UI:
| $ sudo snap install flutter –classic $ cd cloud-gaming-demo/ui && flutter build web && cd .. $ mkdir -p backend/service/static $ cp -av ui/build/web/* backend/service/static |
Then build the backend service which processes requests and interacts with the Anbox Stream Gateway to create instances of game applications. Start by preparing the environment:
| $ sudo apt-get install python3-pip $ sudo pip3 install virtualenv $ cd backend && virtualenv venv |
Create the configuration file for the backend service so that it can access the Anbox Stream Gateway. There are two parameters to set: gateway-URL and gateway-token. The gateway token can be obtained from the following command:
| $ anbox-cloud-appliance gateway account create <account-name> |
Create a file called config.yaml that contains the two values:
| gateway-url: https:// <EC2 public DNS name> gateway-token: <gateway\_token> |
Add the following line to the activate hook in the backend/venv/bin/ directory so that the backend service can read config.yaml on its startup:
| $ export CONFIG\_PATH=<path\_to\_config\_yaml> |
Now we can launch the backend service which will be served by default on TCP port 8002.
| $./run.sh |
In the next steps, we download a game and build it via Anbox Cloud. We need an Android APK and a configuration file. Create a folder under the HOME directory and create a manifest.yaml file in the folder. In this example, we must add the following details in the file. You can refer to the Anbox Cloud documentation for more information on the format.
| name: genshin instance-type: g10.3 resources: cpus: 10 memory: 25GB disk-size: 50GB gpu-slots: 15 features: [“enable\_virtual\_keyboard”] |
Select an APK for the arm64-v8a architecture which is natively supported on Graviton. In this example, we download Genshin Impact, an action role-playing game developed and published by miHoYo. You must supply your own Android APK if you want to try these steps. Download the APK into the folder and rename it to app.apk. Overall, the final layout of the game folder should look as follows:
| . ├── app.apk └── manifest.yaml |
Run the following command from the folder to create the application:
| $ amc application create . |
Wait until the application status changes to ready. You can monitor the status with the following command:
| $ amc application ls |
Edit the following:
- Update the gameids variable defined in the ui/lib/homepage.dart file to include the name of the game (as declared in the manifest file).
- Insert a new key/value pair to the static appNameMap and appDesMap variables defined in the lib/api/application.dart file.
- Provide a screenshot of the game (in jpeg format), rename it to <game-name>.jpeg, and put it into the ui/lib/assets directory.
Then, re-build the web UI, copy the contents from the ui/build/web folder to the backend/service/static directory, and refresh the webpage.
Test the game
Using your mobile phone, open the Firefox browser or another browser that supports WebRTC. Type the public DNS name of the G5g instance with the 8002 TCP port, and you should see something similar to the following:

Figure 5: The webpage of the Android streaming game portal.
Select the Play now button, wait a moment for the application to be setup on the server side, and then enjoy the game.

Figure 6: The screen capture of playing Android streaming game.
Clean-up
Please cancel the subscription of the Anbox Cloud Appliance in the AWS Marketplace, you can follow the AWS Marketplace Buyer Guide for more details, then terminate the G5g.xlarge instance to avoid incurring future costs.
Conclusion
In this post, we demonstrated how a resource-intensive Android game runs natively on a Graviton-based G5g instance and is streamed to an Arm-based mobile device. The benefits include better price-performance, reduced development effort, and faster time-to-market. One way to run your games efficiently on the cloud is through software available on the AWS Marketplace, such as the Anbox Cloud Appliance, which was showcased as an example method.
To learn more about AWS Graviton, visit the official product page and the technical guide.
This post is written by Siarhei Kazhura, Senior Specialist Solutions Architect, Serverless.
Customers use AWS Lambda extensions to integrate monitoring, observability, security, and governance tools with their Lambda functions. AWS, along with AWS Lambda Ready Partners, like Datadog, Dynatrace, New Relic, provides ready-to-run extensions. You can also develop your own extensions to address your specific needs.
External Lambda extensions are designed as a companion process running in the same execution environment as the function code. That means that the Lambda function shares resources like memory, CPU, and disk I/O, with the extension. Improperly designed extensions can result in a performance degradation and extra costs.
This post shows how to measure the impact an extension has on the function performance using key performance metrics on an Amazon CloudWatch dashboard.
This post focuses on Lambda extensions written in C# and Rust. It shows the benefits of choosing to write Lambda extensions in Rust. Also, it explains how you can optimize a Lambda extension written in C# to deliver three times better performance. The solution can be converted to the programming languages of your choice.
Overview
A C# Lambda function (running on .NET 6) called HeaderCounter is used as a baseline. The function counts the number of headers in a request and returns the number in the response. A static delay of 500 ms is inserted in the function code to simulate extra computation. The function has the minimum memory setting (128 MB), which magnifies the impact that extension has on performance.
A load test is performed via a curl command that is issuing 5000 requests (with 250 requests running simultaneously) against a public Amazon API Gateway endpoint backed by the Lambda function. A CloudWatch dashboard, named lambda-performance-dashboard, displays performance metrics for the function.
Metrics captured by the dashboard:
- The Max Duration, and Average Duration metrics allow you to assess the impact the extension has on the function execution duration.
- The PostRuntimeExtensionsDuration metric measures the extra time that the extension takes after the function invocation.
- The Average Memory Used, and Memory Allocated metrics allow you to assess the impact the extension has on the function memory consumption.
- The Cold Start Duration, and Cold Starts metrics allow you to assess the impact the extension has on the function cold start.
Running the extensions
There are a few differences between how the extensions written in C# and Rust are run.
The extension written in Rust is published as an executable. The advantage of an executable is that it is compiled to native code, and is ready to run. The extension is environment agnostic, so it can run alongside with a Lambda function written in another runtime.
The disadvantage of an executable is the size. Extensions are served as Lambda layers, and the size of the extension counts towards the deployment package size. The maximum unzipped deployment package size for Lambda is 250 MB.
The extension written in C# is published as a dynamic-link library (DLL). The DLL contains the Common Intermediate Language (CIL), that must be converted to native code via a just-in-time (JIT) compiler. The .NET runtime must be present for the extension to run. The dotnet command runs the DLL in the example provided with the solution.
Blank extension

Three instances of the HeaderCounter function are deployed:
- The first instance, available via a no-extension endpoint, has no extensions.
- The second instance, available via a dotnet-extension endpoint, is instrumented with a blank extension written in C#. The extension does not provide any extra functionality, except logging the event received to CloudWatch.
- The third instance, available via a rust-extension endpoint, is instrumented with a blank extension written in Rust. The extension does not provide any extra functionality, except logging the event received to CloudWatch.

The dashboard shows that the extensions add minimal overhead to the Lambda function. The extension written in C# adds more overhead in the higher percentile metrics, such as the Maximum Cold Start Duration and Maximum Duration.
EventCollector extension
Three instances of the HeaderCounter function are deployed:
- The first instance, available via a no-extension endpoint, has no extensions.
- The second instance, available via a dotnet-extension endpoint, is instrumented with an EventCollector extension written in C#. The extension is pushing all the extension invocation events to Amazon S3.
- The third instance, available via a rust-extension endpoint, is instrumented with an EventCollector extension written in Rust. The extension is pushing all the extension invocation events to S3.
The Rust extension adds little overhead in terms of the Duration, number of Cold Starts, and Average PostRuntimeExtensionDuration metrics. Yet there is a clear performance degradation for the function that is instrumented with an extension written in C#. Average Duration jumped almost three times, and the Maximum Duration is now around six times higher.
The function is now consuming almost all the memory allocated. CPU, networking, and storage for Lambda functions are allocated based on the amount of memory selected. Currently, the memory is set to 128 MB, the lowest setting possible. Constrained resources influence the performance of the function.

Increasing the memory to 512 MB and re-running the load test improves the performance. Maximum Duration is now 721 ms (including the static 500 ms delay).
For the C# function, the Average Duration is now only 59 ms longer than the baseline. The Average PostRuntimeExtensionDuration is at 36.9 ms (compared with 584 ms previously). This performance gain is due to the memory increase without any code changes.
You can also use the Lambda Power Tuning to determine the optimal memory setting for a Lambda function.
Garbage collection
Unlike C#, Rust is not a garbage collected language. Garbage collection (GC) is a process of managing the allocation and release of memory for an application. This process can be resource intensive, and can affect higher percentile metrics. The impact of GC is visible with the blank extension’s and EventCollector extension’s metrics.
Rust uses ownership and borrowing features, allowing for safe memory release without relying on GC. This makes Rust a good runtime choice for tools like Lambda extensions.
EventCollector native AOT extension
Native ahead-of-time (Native AOT) compilation (available in .NET 7 and .NET 8), allows for the extensions written in C# to be delivered as executables, similar to the extensions written in Rust.
Native AOT does not use a JIT compiler. The application is compiled into a self-contained (all the resources that it needs are encapsulated) executable. The executable runs in the target environment (for example, Linux x64) that is specified at compilation time.
These are the results of compiling the .NET extension using Native AOT and re-running the performance test (with function memory set to 128 MB):

For the C# extension, Average Duration is now close the baseline (compared to three times the baseline as a DLL). Average PostRuntimeExtensionDuration is now 0.77 ms (compared with 584 ms as a DLL). The C# extension also outperforms the Rust extension for the Maximum PostRuntimeExtensionDuration metric – 297 ms versus 497 ms.
Overall, the Rust extension still has better Average/Maximum Duration, Average/Maximum Cold Start Duration, and Memory Consumption. The Lambda function with the C# extension still uses almost all the allocated memory.
Another metric to consider is the binary size. The Rust extension compiles into a 12.3 MB binary, while the C# extension compiles into a 36.4 MB binary.
Example walkthroughs
To follow the example walkthrough, visit the GitHub repository. The walkthrough explains:
- The prerequisites required.
- A detailed solution deployment walkthrough.
- The cleanup process.
- Cost considerations.
Conclusion
This post demonstrates techniques that can be used for running and profiling different types of Lambda extensions. This post focuses on Lambda extensions written in C# and Rust. This post outlines the benefits of writing Lambda extensions in Rust and shows the techniques that can be used to improve Lambda extension written in C# to deliver better performance.
Start writing Lambda extensions with Rust by using the Runtime extensions for AWS Lambda crate. This is a part of a Rust runtime for AWS Lambda.
For more serverless learning resources, visit Serverless Land.
This blog post is written by Devin Gordon, Senior Solutions Architect, WWPS, and Brad Watson, Senior Solutions Architect, WWPS.
Amazon EC2 Image Builder is a service designed to simplify the creation and deployment of customized Virtual Machine (VM) and container images on AWS or on-premises. The posts Automate OS Image Build Pipelines with EC2 Image Builder and Quickly build STIG-compliant Amazon Machine Images using Amazon EC2 Image Builder show how you can create secure images using EC2 Image Builder pipelines.
In this post, we demonstrate how to automatically keep your base or standard images current, incorporating patches and any other changes using EC2 Image Builder pipelines. We also demonstrate how to keep workload-specific images current using Cascading Pipelines, a feature of EC2 Image Builder.
Dependency updates
You can use the Dependency update feature of EC2 Image Builder pipelines to automatically update your standard image based on changes to your build components.
When you create an EC2 Image Builder pipeline, you can choose to run the pipeline on a schedule, either using a schedule builder or a CRON expression (a method of defining minute, hour, day and month for scheduling). Furthermore, you can choose to only run the pipeline if a component in the pipeline or the source image has changed. This is referred to as a dependency update as shown in the following image.

Figure 1: An example EC2 Image Builder pipeline schedule with dependency update settings
When you select “Run pipeline at the scheduled time if there are dependency updates,” your pipeline only executes if the Base AMI or any Build or Test components have changed. The version of your components must be updated for this capability to work. Amazon-provided components include versioning out of the box. Here is an example of three versions of an Amazon-provided Build component that apply Security Technical Implementation Guide (STIG) baselines to Linux images.
Figure 2: Different versions of one Amazon-managed Build component
When a new STIG baseline build component is released, the component’s version is incremented. If a pipeline includes this type of versioned Build component and utilizes the dependency updates capability, then the pipeline automatically runs at the next scheduled interval after the component is updated. Pipelines utilizing this capability will run when the base AMI changes or when a Build or Test component changes.
Notifications
To receive notifications about the pipeline execution, you can enable an Amazon Simple Notification Service (Amazon SNS) topic from within EC2 Image Builder. Under the Infrastructure Configuration section of the EC2 Image Builder pipeline, identify an SNS topic as shown in the following image.
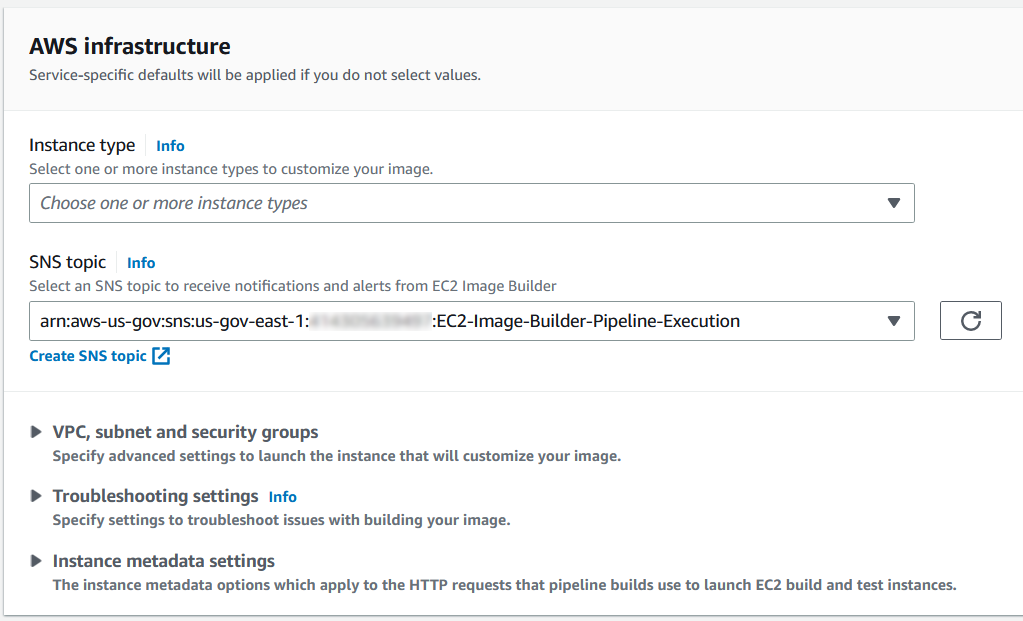
Figure 3: An example SNS topic for sending pipeline execution notifications
The SNS topic receives a notification if a pipeline runs and completes with a status of AVAILABLE or FAILED. This occurs even when a pipeline execution is triggered by a component change that you didn’t directly initiate, such as when a new version of an Amazon-managed build component is released.
Even if no other aspects of the infrastructure configuration are used in the pipeline (instance type, security group, subnet, etc.), the SNS topic capability can be used to send a notification when the pipeline executes. With this in mind, you can leverage Amazon SNS to make sure that you’re always notified of any pipeline executions as well as trigger AWS Lambda functions for automation.
Cascading pipelines
Cascading Pipelines are a feature of EC2 Image Builder that you can use to create workload-specific images from a standard secured image (aka “gold image”) of an organization. The following image shows how you can use Cascading Pipelines to keep workload specific images updated.
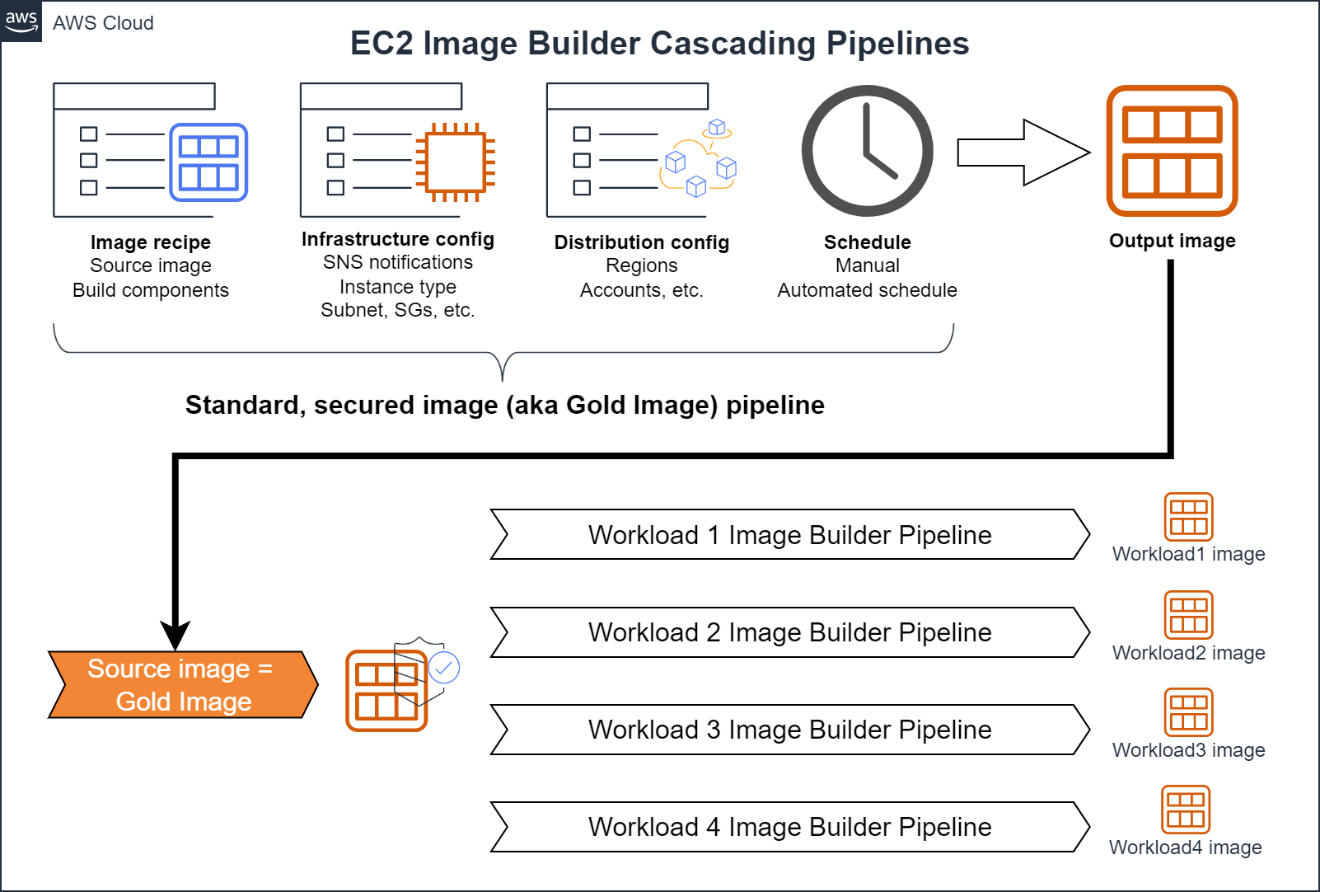
Figure 4: An example workflow for a EC2 Image Builder Cascading Pipelines
You create a gold image pipeline for a hardened base operating system (OS) using the steps outlined in Automate OS Image Build Pipelines with EC2 Image Builder. This pipeline could include a base OS, OS patches, Build components to harden the OS (such as STIG or CIS baselines), as well as any additional software required by the organization (agents, etc.). Do not include application- or workload-specific software in the pipeline. Infrastructure or distribution components may not be included in the pipeline to maintain flexibility for using the gold image. For example, you typically wouldn’t want to include VPC configurations in your golden AMI build because that would constrain the AMI to a particular VPC.
To create a Cascading Pipeline that uses the gold image for applications or workloads, in the Base Image section of the EC2 Image Builder console, choose Select Managed Images.

Figure 5: Selecting the base image of a pipeline
Then, select “Images Owned by Me” and under Image Name, select the EC2 Image Builder pipeline used to create the gold image. Moreover, select “Use Latest Available OS Version” under Auto-versioning options to make sure that the Cascading Pipeline is executed any time there is a change to the base image.
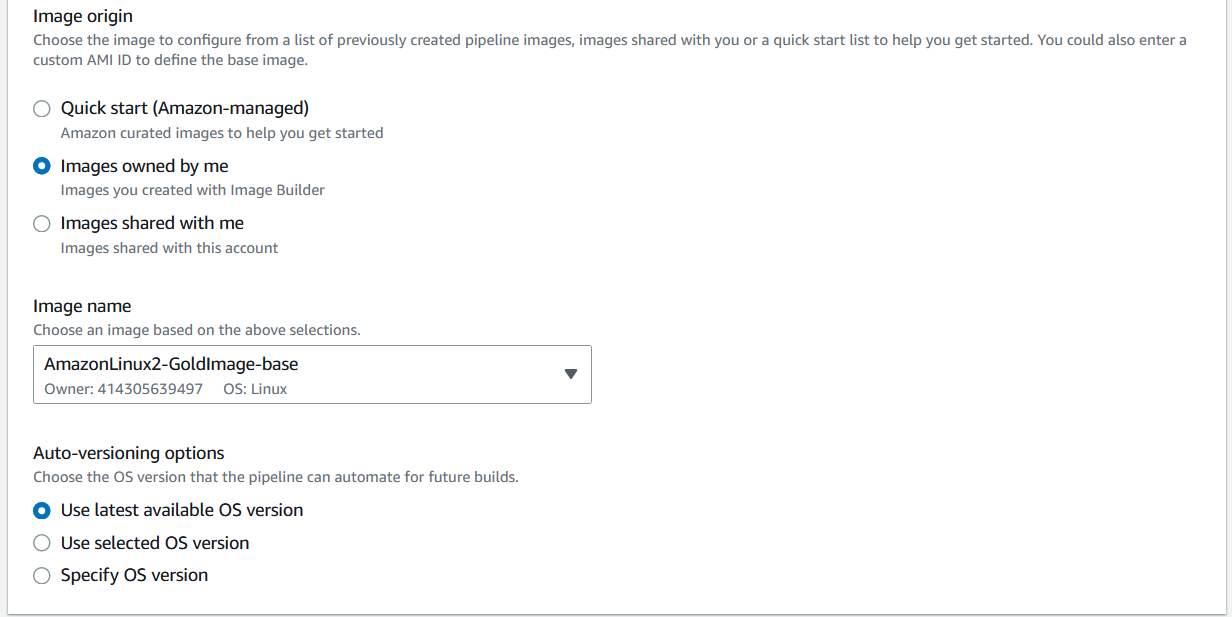
Figure 6: Choosing the base golden image from a previous pipeline execution
Use this configuration to maintain images for each application or workload which utilizes the gold image. Any time that an update is made to the gold image, application pipelines execute, thus providing updated images. To send notifications, SNS topics are enabled on each workload-specific pipeline.
In this post, we demonstrated how to automatically update images for any changes using EC2 Image Builder pipelines. We also demonstrated how to keep workload specific images using Cascading Pipelines. Using these features, you can make sure that your organization stays up-to-date on the latest OS patches and dependency changes, without requiring human intervention. For more information on EC2 Image Builder, see the official documentation.
Today, AWS Lambda is announcing support for response payload streaming. Response streaming is a new invocation pattern that lets functions progressively stream response payloads back to clients.
You can use Lambda response payload streaming to send response data to callers as it becomes available. This can improve performance for web and mobile applications. Response streaming also allows you to build functions that return larger payloads and perform long-running operations while reporting incremental progress.
In traditional request-response models, the response needs to be fully generated and buffered before it is returned to the client. This can delay the time to first byte (TTFB) performance while the client waits for the response to be generated. Web applications are especially sensitive to TTFB and page load performance. Response streaming lets you send partial responses back to the client as they become ready, improving TTFB latency to within milliseconds. For web applications, this can improve visitor experience and search engine rankings.
Other applications may have large payloads, like images, videos, large documents, or database results. Response streaming lets you transfer these payloads back to the client without having to buffer the entire payload in memory. You can use response streaming to send responses larger than Lambda’s 6 MB response payload limit up to a soft limit of 20 MB.
Response streaming currently supports the Node.js 14.x and subsequent managed runtimes. You can also implement response streaming using custom runtimes. You can progressively stream response payloads through Lambda function URLs, including as an Amazon CloudFront origin, along with using the AWS SDK or using Lambda’s invoke API. You can also use Amazon API Gateway and Application Load Balancer to stream larger payloads.
Writing response streaming enabled functions
Writing the handler for response streaming functions differs from typical Node handler patterns. To indicate to the runtime that Lambda should stream your function’s responses, you must wrap your function handler with the streamifyResponse() decorator. This tells the runtime to use the correct stream logic path, allowing the function to stream responses.
This is an example handler with response streaming enabled:
exports.handler = awslambda.streamifyResponse( async (event, responseStream, context) => { responseStream.setContentType(“text/plain”); responseStream.write(“Hello, world!”); responseStream.end(); });The streamifyResponse decorator accepts the following additional parameter, responseStream, besides the default node handler parameters, event, and context.
The new responseStream object provides a stream object that your function can write data to. Data written to this stream is sent immediately to the client. You can optionally set the Content-Type header of the response to pass additional metadata to your client about the contents of the stream.
Writing to the response stream
The responseStream object implements Node’s Writable Stream API. This offers a write() method to write information to the stream. However, we recommend that you use pipeline() wherever possible to write to the stream. This can improve performance, ensuring that a faster readable stream does not overwhelm the writable stream.
An example function using pipeline() showing how you can stream compressed data:
const pipeline = require("util").promisify(require("stream").pipeline);const zlib = require('zlib');const { Readable } = require('stream');exports.gzip = awslambda.streamifyResponse(async (event, responseStream, \_context) => { // As an example, convert event to a readable stream. const requestStream = Readable.from(Buffer.from(JSON.stringify(event))); await pipeline(requestStream, zlib.createGzip(), responseStream);});Ending the response stream
When using the write() method, you must end the stream before the handler returns. Use responseStream.end() to signal that you are not writing any more data to the stream. This is not required if you write to the stream with pipeline().
Reading streamed responses
Response streaming introduces a new InvokeWithResponseStream API. You can read a streamed response from your function via a Lambda function URL or use the AWS SDK to call the new API directly.
Neither API Gateway nor Lambda’s target integration with Application Load Balancer support chunked transfer encoding. It therefore does not support faster TTFB for streamed responses. You can, however, use response streaming with API Gateway to return larger payload responses, up to API Gateway’s 10 MB limit. To implement this, you must configure an HTTP\_PROXY integration between your API Gateway and a Lambda function URL, instead of using the LAMBDA\_PROXY integration.
You can also configure CloudFront with a function URL as origin. When streaming responses through a function URL and CloudFront, you can have faster TTFB performance and return larger payload sizes.
Using Lambda response streaming with function URLs
You can configure a function URL to invoke your function and stream the raw bytes back to your HTTP client via chunked transfer encoding. You configure the Function URL to use the new InvokeWithResponseStream API by changing the invoke mode of your function URL from the default BUFFERED to RESPONSE\_STREAM.
RESPONSE\_STREAM enables your function to stream payload results as they become available if you wrap the function with the streamifyResponse() decorator. Lambda invokes your function using the InvokeWithResponseStream API. If InvokeWithResponseStream invokes a function that is not wrapped with streamifyResponse(), Lambda does not stream the response and instead returns a buffered response which is subject to the 6 MB size limit.
Using AWS Serverless Application Model (AWS SAM) or AWS CloudFormation, set the InvokeMode property:
MyFunctionUrl: Type: AWS::Lambda::Url Properties: TargetFunctionArn: !Ref StreamingFunction AuthType: AWS\_IAM InvokeMode: RESPONSE\_STREAMUsing generic HTTP client libraries with function URLs
Each language or framework may use different methods to form an HTTP request and parse a streamed response. Some HTTP client libraries only return the response body after the server closes the connection. These clients do not work with functions that return a response stream. To get the benefit of response streams, use an HTTP client that returns response data incrementally. Many HTTP client libraries already support streamed responses, including the Apache HttpClient for Java, Node’s built-in http client, and Python’s requests and urllib3 packages. Consult the documentation for the HTTP library that you are using.
Example applications
There are a number of example Lambda streaming applications in the Serverless Patterns Collection. They use AWS SAM to build and deploy the resources in your AWS account.
Clone the repository and explore the examples. The README file in each pattern folder contains additional information.
git clone https://github.com/aws-samples/serverless-patterns/ cd serverless-patternsTime to first byte using write()
- To show how streaming improves time to first bite, deploy the lambda-streaming-ttfb-write-sam pattern.
- Use AWS SAM to deploy the resources to your AWS account. Run a guided deployment to set the default parameters for the first deployment.
- Enter a Stack Name and accept the initial defaults.
- Use
curlwith your AWS credentials to view the streaming response as the URL uses AWS Identity and Access Management (IAM) for authorization. Replace the URL and Region parameters for your deployment.
cd lambda-streaming-ttfb-write-samsam deploy -g --stack-name lambda-streaming-ttfb-write-samFor subsequent deployments you can use sam deploy.
AWS SAM deploys a Lambda function with streaming support and a function URL.

AWS SAM deploy –g
Once the deployment completes, AWS SAM provides details of the resources.

AWS SAM resources
The AWS SAM output returns a Lambda function URL.
curl --request GET https://<url>.lambda-url.<Region>.on.aws/ --user AKIAIOSFODNN7EXAMPLE:wJalrXUtnFEMI/K7MDENG/bPxRfiCYEXAMPLEKEY --aws-sigv4 'aws:amz:<Region>:lambda'You can see the gradual display of the streamed response.

Using curl to stream response from write () function
Time to first byte using pipeline()
- To try an example using
pipeline(), deploy the lambda-streaming-ttfb-pipeline-sam pattern. - Use AWS SAM to deploy the resources to your AWS account. Run a guided deployment to set the default parameters for the first deploy.
- Enter a Stack Name and accept the initial defaults.
- Use
curlwith your AWS credentials to view the streaming response. Replace the URL and Region parameters for your deployment.
cd ..cd lambda-streaming-ttfb-pipeline-samsam deploy -g --stack-name lambda-streaming-ttfb-pipeline-samcurl --request GET https://<url>.lambda-url.<Region>.on.aws/ --user AKIAIOSFODNN7EXAMPLE:wJalrXUtnFEMI/K7MDENG/bPxRfiCYEXAMPLEKEY --aws-sigv4 'aws:amz:<Region>:lambda'You can see the pipelined response stream returned.

Using curl to stream response from function
Large payloads
- To show how streaming enables you to return larger payloads, deploy the lambda-streaming-large-sam application. AWS SAM deploys a Lambda function, which returns a 7 MB PDF file which is larger than Lambda’s non-stream 6 MB response payload limit.
- The AWS SAM output returns a Lambda function URL. Use
curlwith your AWS credentials to view the streaming response.
cd ..cd lambda-streaming-large-samsam deploy -g --stack-name lambda-streaming-large-samcurl --request GET https://<url>.lambda-url.<Region>.on.aws/ --user AKIAIOSFODNN7EXAMPLE: wJalrXUtnFEMI/K7MDENG/bPxRfiCYEXAMPLEKEY --aws-sigv4 'aws:amz:<Region>:lambda' -o SVS401-ri22.pdf -w '%{content\_type}'This downloads the PDF file SVS401-ri22.pdf to your current directory and displays the content type as application/pdf.
You can also use API Gateway to stream a large payload with an HTTP\_PROXY integration with a Lambda function URL.
Invoking a function with response streaming using the AWS SDK
You can use the AWS SDK to stream responses directly from the new Lambda InvokeWithResponseStream API. This provides additional functionality such as handling midstream errors. This can be helpful when building, for example, internal microservices. Response streaming is supported with the AWS SDK for Java 2.x, AWS SDK for JavaScript v3, and AWS SDKs for Go version 1 and version 2.
The SDK response returns an event stream that you can read from. The event stream contains two event types. PayloadChunk contains a raw binary buffer with partial response data received by the client. InvokeComplete signals that the function has completed sending data. It also contains additional metadata, such as whether the function encountered an error in the middle of the stream. Errors can include unhandled exceptions thrown by your function code and function timeouts.
Using the AWS SDK for Javascript v3
- To see how to use the AWS SDK to stream responses from a function, deploy the lambda-streaming-sdk-sam pattern.
- Enter a Stack Name and accept the initial defaults.
cd ..cd lambda-streaming-sdk-samsam deploy -g --stack-name lambda-streaming-sdk-samAWS SAM deploys three Lambda functions with streaming support.
- HappyPathFunction: Returns a full stream.
- MidstreamErrorFunction: Simulates an error midstream.
- TimeoutFunction: Function times out before stream completes.
npm install @aws-sdk/client-lambdanode index.mjsYou can see each function and how the midstream and timeout errors are returned back to the SDK client.

Streaming midstream error

Streaming timeout error
Quotas and pricing
Streaming responses incur an additional cost for network transfer of the response payload. You are billed based on the number of bytes generated and streamed out of your Lambda function over the first 6 MB. For more information, see Lambda pricing.
There is an initial maximum response size of 20 MB, which is a soft limit you can increase. There is a maximum bandwidth throughput limit of 16 Mbps (2 MB/s) for streaming functions.
Conclusion
Today, AWS Lambda is announcing support for response payload streaming to send partial responses to callers as the responses become available. This can improve performance for web and mobile applications. You can also use response streaming to build functions that return larger payloads and perform long-running operations while reporting incremental progress. Stream partial responses through Lambda function URLs, or using the AWS SDK. Response streaming currently supports the Node.js 14.x and subsequent runtimes, as well as custom runtimes.
There are a number of example Lambda streaming applications in the Serverless Patterns Collection to explore the functionality.
Lambda response streaming support is also available through many AWS Lambda Partners such as Datadog, Dynatrace, New Relic, Pulumi and Lumigo.
For more serverless learning resources, visit Serverless Land.
Welcome to the 21st edition of the AWS Serverless ICYMI (in case you missed it) quarterly recap. Every quarter, we share all the most recent product launches, feature enhancements, blog posts, webinars, live streams, and other interesting things that you might have missed!
In case you missed our last ICYMI, check out what happened last quarter here.
Artificial intelligence (AI) technologies, ChatGPT, and DALL-E are creating significant interest in the industry at the moment. Find out how to integrate serverless services with ChatGPT and DALL-E to generate unique bedtime stories for children.

Example notification of a story hosted with Next.js and App Runner
Serverless Land is a website maintained by the Serverless Developer Advocate team to help you build serverless applications and includes workshops, code examples, blogs, and videos. There is now enhanced search functionality so you can search across resources, patterns, and video content.

ServerlessLand search
AWS Lambda
AWS Lambda has improved how concurrency works with Amazon SQS. You can now control the maximum number of concurrent Lambda functions invoked.
The launch blog post explains the scaling behavior of Lambda using this architectural pattern, challenges this feature helps address, and a demo of maximum concurrency in action.

Maximum concurrency is set to 10 for the SQS queue.
AWS Lambda Powertools is an open-source library to help you discover and incorporate serverless best practices more easily. Lambda Powertools for .NET is now generally available and currently focused on three observability features: distributed tracing (Tracer), structured logging (Logger), and asynchronous business and application metrics (Metrics). Powertools is also available for Python, Java, and Typescript/Node.js programming languages.
To learn more:
Lambda announced a new feature, runtime management controls, which provide more visibility and control over when Lambda applies runtime updates to your functions. The runtime controls are optional capabilities for advanced customers that require more control over their runtime changes. You can now specify a runtime management configuration for each function with three settings, Automatic (default), Function update, or manual.
There are three new Amazon CloudWatch metrics for asynchronous Lambda function invocations: AsyncEventsReceived, AsyncEventAge, and AsyncEventsDropped. You can track the asynchronous invocation requests sent to Lambda functions to monitor any delays in processing and take corrective actions if required. The launch blog post explains the new metrics and how to use them to troubleshoot issues.
Lambda now supports Amazon DocumentDB change streams as an event source. You can use Lambda functions to process new documents, track updates to existing documents, or log deleted documents. You can use any programming language that is supported by Lambda to write your functions.
There is a helpful blog post suggesting best practices for developing portable Lambda functions that allow you to port your code to containers if you later choose to.
AWS Step Functions
AWS Step Functions has expanded its AWS SDK integrations with support for 35 additional AWS services including Amazon EMR Serverless, AWS Clean Rooms, AWS IoT FleetWise, AWS IoT RoboRunner and 31 other AWS services. In addition, Step Functions also added support for 1000+ new API actions from new and existing AWS services such as Amazon DynamoDB and Amazon Athena. For the full list of added services, visit AWS SDK service integrations.
Amazon EventBridge
Amazon EventBridge has launched the AWS Controllers for Kubernetes (ACK) for EventBridge and Pipes . This allows you to manage EventBridge resources, such as event buses, rules, and pipes, using the Kubernetes API and resource model (custom resource definitions).
EventBridge event buses now also support enhanced integration with Service Quotas. Your quota increase requests for limits such as PutEvents transactions-per-second, number of rules, and invocations per second among others will be processed within one business day or faster, enabling you to respond quickly to changes in usage.
AWS SAM
The AWS Serverless Application Model (SAM) Command Line Interface (CLI) has added the sam list command. You can now show resources defined in your application, including the endpoints, methods, and stack outputs required to test your deployed application.
AWS SAM has a preview of sam build support for building and packaging serverless applications developed in Rust. You can use cargo-lambda in the AWS SAM CLI build workflow and AWS SAM Accelerate to iterate on your code changes rapidly in the cloud.
You can now use AWS SAM connectors as a source resource parameter. Previously, you could only define AWS SAM connectors as a AWS::Serverless::Connector resource. Now you can add the resource attribute on a connector’s source resource, which makes templates more readable and easier to update over time.
AWS SAM connectors now also support multiple destinations to simplify your permissions. You can now use a single connector between a single source resource and multiple destination resources.
In October 2022, AWS released OpenID Connect (OIDC) support for AWS SAM Pipelines. This improves your security posture by creating integrations that use short-lived credentials from your CI/CD provider. There is a new blog post on how to implement it.
Find out how best to build serverless Java applications with the AWS SAM CLI.
AWS App Runner
AWS App Runner now supports retrieving secrets and configuration data stored in AWS Secrets Manager and AWS Systems Manager (SSM) Parameter Store in an App Runner service as runtime environment variables.
AppRunner also now supports incoming requests based on HTTP 1.0 protocol, and has added service level concurrency, CPU and Memory utilization metrics.
Amazon S3
Amazon S3 now automatically applies default encryption to all new objects added to S3, at no additional cost and with no impact on performance.
You can now use an S3 Object Lambda Access Point alias as an origin for your Amazon CloudFront distribution to tailor or customize data to end users. For example, you can resize an image depending on the device that an end user is visiting from.
S3 has introduced Mountpoint for S3, a high performance open source file client that translates local file system API calls to S3 object API calls like GET and LIST.
S3 Multi-Region Access Points now support datasets that are replicated across multiple AWS accounts. They provide a single global endpoint for your multi-region applications, and dynamically route S3 requests based on policies that you define. This helps you to more easily implement multi-Region resilience, latency-based routing, and active-passive failover, even when data is stored in multiple accounts.
Amazon Kinesis
Amazon Kinesis Data Firehose now supports streaming data delivery to Elastic. This is an easier way to ingest streaming data to Elastic and consume the Elastic Stack (ELK Stack) solutions for enterprise search, observability, and security without having to manage applications or write code.
Amazon DynamoDB
Amazon DynamoDB now supports table deletion protection to protect your tables from accidental deletion when performing regular table management operations. You can set the deletion protection property for each table, which is set to disabled by default.
Amazon SNS
Amazon SNS now supports AWS X-Ray active tracing to visualize, analyze, and debug application performance. You can now view traces that flow through Amazon SNS topics to destination services, such as Amazon Simple Queue Service, Lambda, and Kinesis Data Firehose, in addition to traversing the application topology in Amazon CloudWatch ServiceLens.
SNS also now supports setting content-type request headers for HTTPS notifications so applications can receive their notifications in a more predictable format. Topic subscribers can create a DeliveryPolicy that specifies the content-type value that SNS assigns to their HTTPS notifications, such as application/json, application/xml, or text/plain.
EDA Visuals collection added to Serverless Land
The Serverless Developer Advocate team has extended Serverless Land and introduced EDA visuals. These are small bite sized visuals to help you understand concepts and patterns about event-driven architectures. Find out about batch processing vs. event streaming, commands vs. events, message queues vs. event brokers, and point-to-point messaging. Discover bounded contexts, migrations, idempotency, claims, enrichment and more.
EDA Visuals
To learn more:
Serverless Repos Collection on Serverless Land
There is also a new section on Serverless Land containing helpful code repositories. You can search for code repos to use for examples, learning or building serverless applications. You can also filter by use-case, runtime, and level.

Serverless Repos Collection
Serverless Blog Posts
January
Jan 12 – Introducing maximum concurrency of AWS Lambda functions when using Amazon SQS as an event source
Jan 20 – Processing geospatial IoT data with AWS IoT Core and the Amazon Location Service
Jan 23 – AWS Lambda: Resilience under-the-hood
Jan 24 – Introducing AWS Lambda runtime management controls
Jan 24 – Best practices for working with the Apache Velocity Template Language in Amazon API Gateway
February
Feb 6 – Previewing environments using containerized AWS Lambda functions
Feb 7 – Building ad-hoc consumers for event-driven architectures
Feb 9 – Implementing architectural patterns with Amazon EventBridge Pipes
Feb 9 – Securing CI/CD pipelines with AWS SAM Pipelines and OIDC
Feb 9 – Introducing new asynchronous invocation metrics for AWS Lambda
Feb 14 – Migrating to token-based authentication for iOS applications with Amazon SNS
Feb 15 – Implementing reactive progress tracking for AWS Step Functions
Feb 23 – Developing portable AWS Lambda functions
Feb 23 – Uploading large objects to Amazon S3 using multipart upload and transfer acceleration
Feb 28 – Introducing AWS Lambda Powertools for .NET
March
Mar 9 – Server-side rendering micro-frontends – UI composer and service discovery
Mar 9 – Building serverless Java applications with the AWS SAM CLI
Mar 10 – Managing sessions of anonymous users in WebSocket API-based applications
Mar 14 –
Implementing an event-driven serverless story generation application with ChatGPT and DALL-E
Videos
Serverless Office Hours – Tues 10AM PT
Weekly office hours live stream. In each session we talk about a specific topic or technology related to serverless and open it up to helping you with your real serverless challenges and issues. Ask us anything you want about serverless technologies and applications.
- YouTube: https://youtube.com/serverlessland
- Twitch: https://twitch.tv/aws
- LinkedIn: https://linkedin.com/company/serverlessland
January
Jan 10 – Building .NET 7 high performance Lambda functions
Jan 17 – Amazon Managed Workflows for Apache Airflow at Scale
Jan 24 – Using Terraform with AWS SAM
Jan 31 – Preparing your serverless architectures for the big day
February
Feb 07- Visually design and build serverless applications
Feb 14 – Multi-tenant serverless SaaS
Feb 21 – Refactoring to Serverless
Feb 28 – EDA visually explained
March
Mar 07 – Lambda cookbook with Python
Mar 14 – Succeeding with serverless
Mar 21 – Lambda Powertools .NET
Mar 28 – Server-side rendering micro-frontends
FooBar Serverless YouTube channel
Marcia Villalba frequently publishes new videos on her popular serverless YouTube channel. You can view all of Marcia’s videos at https://www.youtube.com/c/FooBar\_codes.

January
Jan 12 – Serverless Badge – A new certification to validate your Serverless Knowledge
Jan 19 – Step functions Distributed map – Run 10k parallel serverless executions!
Jan 26 – Step Functions Intrinsic Functions – Do simple data processing directly from the state machines!
February
Feb 02 – Unlock the Power of EventBridge Pipes: Integrate Across Platforms with Ease!
Feb 09 – Amazon EventBridge Pipes: Enrichment and filter of events Demo with AWS SAM
Feb 16 – AWS App Runner – Deploy your apps from GitHub to Cloud in Record Time
Feb 23 – AWS App Runner – Demo hosting a Node.js app in the cloud directly from GitHub (AWS CDK)
March
Mar 02 – What is Amazon DynamoDB? What are the most important concepts? What are the indexes?
Mar 09 – Choreography vs Orchestration: Which is Best for Your Distributed Application?
Mar 16 – DynamoDB Single Table Design: Simplify Your Code and Boost Performance with Table Design Strategies
Mar 23 – 8 Reasons You Should Choose DynamoDB for Your Next Project and How to Get Started
Sessions with SAM & Friends

AWS SAM & Friends
Eric Johnson is exploring how developers are building serverless applications. We spend time talking about AWS SAM as well as others like AWS CDK, Terraform, Wing, and AMPT.
Feb 16 – What’s new with AWS SAM
Feb 23 – AWS SAM with AWS CDK
Mar 02 – AWS SAM and Terraform
Mar 10 – Live from ServerlessDays ANZ
Mar 16 – All about AMPT
Mar 23 – All about Wing
Mar 30 – SAM Accelerate deep dive
Still looking for more?
The Serverless landing page has more information. The Lambda resources page contains case studies, webinars, whitepapers, customer stories, reference architectures, and even more Getting Started tutorials.
You can also follow the Serverless Developer Advocacy team on Twitter to see the latest news, follow conversations, and interact with the team.
- Eric Johnson: @edjgeek
- James Beswick: @jbesw
- Ben Smith: @benjamin\_l\_s
- Julian Wood: @julian\_wood
- Marcia Villalba: @mavi888uy
- David Boyne: @boyney123
This was written by Michele Ricciardi, Specialist Solutions Architect, DevAx.
AWS Lambda SnapStart enables customers to reduce cold starts by caching an encrypted snapshot of an initiated Lambda function, and reusing that snapshot for subsequent invocations.
This blog post describes in more detail how to enable SnapStart with different infrastructure as code tooling: AWS Serverless Application Model (AWS SAM), AWS CloudFormation, and Terraform. It shows what happens during a Lambda deployment when SnapStart is enabled, as well as best practices to apply in CI/CD pipelines.
Snapstart can significantly reduce the cold start times for Lambda functions written in Java. The example described in the launch blog post reduces the cold start duration from over 6 seconds to less than 200ms.
Using SnapStart
You activate the SnapStart feature through a Lambda configuration setting. However, there are additional steps to use the SnapStart feature.
Enable Lambda function versions
SnapStart works in conjunction with Lambda function versions. It initializes the function when you publish a new Lambda function version. Therefore, you must enable Lambda versions to use SnapStart. For more information, read the Lambda Developer Guide.
Optionally create a Lambda function alias
A Lambda function alias allows you to define a custom pointer, and control which Lambda version it is attached to. While this is optional, creating a Lambda function alias makes the management operations easier. You can change the Lambda version tied to a Lambda alias without modifying the applications using the Lambda function.
Modify the application or AWS service invoking the Lambda function
Once you have a SnapStart-ready Lambda version, you must change the mechanism that invokes the Lambda function to use a qualified Lambda ARN. This can either invoke the specific Lambda Version directly or invoke the Lambda alias, which points at the correct Lambda version.
If you do not modify the mechanism that invokes the Lambda function, or use an unqualified ARN, you cannot take advantage of the optimizations that SnapStart provides.
Using SnapStart with infrastructure as code
AWS CloudFormation
UnicornStockBroker is a sample Serverless application. This application is composed of an Amazon API Gateway endpoint, a Java Lambda function, and an Amazon DynamoDB table. Find the CloudFormation template without SnapStart in this GitHub repository.
To enable SnapStart:
- Enable Lambda Versioning by adding an AWS::Lambda::Version resource type:
UnicornStockBrokerFunctionVersion1: Type: AWS::Lambda::Version Properties: FunctionName: !Ref 'UnicornStockBrokerFunction' - To deploy a new Lambda function version with CloudFormation, change the resource name from
UnicornStockBrokerFunctionVersion1toUnicornStockBrokerFunctionVersion2. - Create a Lambda alias using the AWS::Lambda::Alias resource type:
UnicornStockBrokerFunctionAliasSnapStart: Type: AWS::Lambda::Alias Properties: Name: SnapStart FunctionName: !Ref 'UnicornStockBrokerFunction' FunctionVersion: !GetAtt 'UnicornStockBrokerFunctionVersion.Version' - Update API Gateway to invoke the Lambda function alias, instead of using an unqualified ARN. This ensures that API Gateway invokes the specified Lambda alias:
ServerlessRestApi: Type: AWS::ApiGateway::RestApi Properties: Body: paths: /transactions: post: x-amazon-apigateway-integration: [..] uri: !Sub 'arn:aws:apigateway:${AWS::Region}:lambda:path/2015-03-31/functions/${UnicornStockBrokerFunctionAliasSnapStart}/invocations' - Modify the IAM permissions to allow API Gateway to invoke the specified Lambda alias:
UnicornStockBrokerFunctionUnicornStockBrokerEventPermissionProd: Type: AWS::Lambda::Permission Properties: [..] FunctionName: !Ref UnicornStockBrokerFunctionAliasSnapStart - Enable SnapStart on the Lambda function:
UnicornStockBrokerFunction: Type: AWS::Lambda::Function Properties: [..] SnapStart: ApplyOn: PublishedVersions
After these updates, the CloudFormation template with SnapStart enabled looks like this. You can deploy the sample application and take advantage of SnapStart.
AWS SAM
You can find the AWS SAM template without SnapStart here. To enable Lambda SnapStart:
- Enable Lambda versions and create a Lambda alias by adding a AutoPublishAlias property, AWS SAM automatically publishes a new Lambda function version for each new deployment, and automatically assigns the Lambda alias to the new published version:
UnicornStockBrokerFunction: Type: AWS::Serverless::Function Properties: [..] AutoPublishAlias: SnapStart - Enable SnapStart on the Lambda function:
UnicornStockBrokerFunction: Type: AWS::Serverless::Function Properties: [..] SnapStart: ApplyOn: PublishedVersions
This example uses the AWS::Serverless::Function resource with the AutoPublishAlias property. AWS SAM implicitly creates an Amazon API Gateway with the correct permissions and configuration to invoke the Lambda function using the declared Lambda alias.
You can see the modified AWS SAM template here. You can deploy the sample application with AWS SAM and take advantage of SnapStart.
Terraform
You can find the Terraform template without SnapStart here. To enable Lambda SnapStart using Terraform by HashiCorp:
- Enable Lambda Versioning by adding a publish property to the
aws\_lambda\_functionresource:resource "aws\_lambda\_function" "UnicornStockBrokerFunction" { [...] publish = true} - Create a Lambda alias by adding a aws\_lambda\_alias resource:
resource "aws\_lambda\_alias" "UnicornStockBrokerFunction\_SnapStartAlias" { name = "SnapStart" description = "Alias for SnapStart" function\_name = aws\_lambda\_function.UnicornStockBrokerFunction.function\_name function\_version = aws\_lambda\_function.UnicornStockBrokerFunction.version} - Update API Gateway to invoke the Lambda function alias, instead of using an unqualified ARN:
SnapshotFunction:resource "aws\_api\_gateway\_integration" "createproduct-lambda" { [...] uri = aws\_lambda\_alias.UnicornStockBrokerFunction\_SnapStartAlias.invoke\_arn} - Modify the
urion theaws\_lambda\_permissionto allow API Gateway to invoke the specified Lambda alias:resource "aws\_lambda\_permission" "apigw-CreateProductHandler" { [...] qualifier = aws\_lambda\_alias.UnicornStockBrokerFunction\_SnapStartAlias.name} - Enable Lambda SnapStart by adding a snap\_start argument to the
aws\_lambda\_functionresource:resource "aws\_lambda\_function" "UnicornStockBrokerFunction" { [...] snap\_start { apply\_on ="PublishedVersions" }}
You can see the modified Terraform template here. You can deploy the sample application with Terraform and take advantage of SnapStart.
How does the deployment change with SnapStart?
This section describes how the deployment changes after enabling Lambda SnapStart.
Before adding Lambda versions, Lambda alias and SnapStart, this is the process of publishing new code to a function:

After you enable Lambda versions, Lambda alias and Lambda SnapStart, there are more steps to the deployment:

During the deployment of a Lambda version, Lambda creates a new execution environment and initializes it with the new code. Once the code is initialized, Lambda takes a Snapshot of the initialized code. The deployment now takes longer than it did without SnapStart as it takes additional time to initialize the execution environment and to create the initialized function snapshot.
While the new Lambda version is being created, the Lambda alias remains unchanged and invokes the previous Lambda version when invoked. The calling application is unaware of the deployment; therefore, the additional deployment time does not impact calling applications.
When the new function version is ready, you can update the Lambda alias to point at the new Lambda version (this is done automatically in the preceding IaC examples).
By using a Lambda alias, you don’t need to direct all the Lambda invocations to the latest version. You can use the Alias routing configuration to shift traffic gradually to the new Lambda version, giving you an easier way to test new Lambda versions gradually and rollback in case of issues with the latest version.
There is an additional failure mode with this deployment. The initialization of a new Lambda version can fail in case of errors within the code. For example, Lambda does not initialize your code if there is an unhandled exception during the initialization phase. This is an additional failure mode that you must handle in the deployment cycle.
CI/CD considerations
Longer deployments
The first consideration is that enabling Lambda SnapStart increases the deployment time.
When your CI/CD pipeline deploys a new SnapStart-enabled Lambda version, Lambda initializes a new Lambda execution environment and takes a snapshot of both the memory and disk of the initialized code. This takes time and its latency would depend on the initialization time of your Lambda function, and the overall size of the snapshot.
This additional delay could be significant for CI/CD pipelines with large number of Lambda functions. Therefore, if you have an application with multiple Lambda functions, enable Lambda SnapStart on the Lambda functions gradually, and adjust the CI/CD pipeline timeout accordingly.
Deployment failure modes
With Lambda SnapStart, there is an additional failure mode that you would need to handle in your CI/CD pipeline.
As described earlier, during the new Lambda version creation there could be failures linked to the code initialization of the Lambda code. This additional failure scenario can be managed in 2 ways:
- Add a testing step in your CI/CD pipeline.
You can add a testing step to validate that the function would initialize successfully. This testing step could include running your Lambda function locally, with sam local, or running local tests using the Lambda Java Test library. - Deploy the Lambda function to a test environment with SnapStart enabled.
An additional check to detect issues early, is to deploy your Lambda function to a testing environment with SnapStart enabled. By deploying your Lambda functions with SnapStart in a testing environment, you can catch issues earlier in your development cycle, and run additional end-to-end testing and performance tests.
Conclusion
This blog post shows the steps needed to leverage Lambda SnapStart, with examples for AWS CloudFormation, AWS SAM, and Terraform.
When you use the feature, there are additional steps that Lambda performs during the deployment. Lambda initializes a new Lambda version with the new code and takes a snapshot. This operation takes time and may fail if the code initialization fails, therefore you may need to make adjustments to your CI/CD pipeline to handle those scenarios.
If you’d like to learn more about the Lambda SnapStart feature, read more on the AWS Lambda Developer Guide or visit our Java on AWS Lambda workshop. To read more about this and other features, visit Serverless Land.
This blog post is written by Sandeep Palavalasa, Sr. Specialist Containers SA, and Prathibha Datta-Kumar, Software Development Engineer
Spinnaker is an open source continuous delivery platform created by Netflix for releasing software changes rapidly and reliably. It enables teams to automate deployments into pipelines that are run whenever a new version is released with proven deployment strategies that are faster and more dependable with zero downtime. For many AWS customers, Spinnaker is a critical piece of technology that allows developers to deploy their applications safely and reliably across different AWS managed services.
Listening to customer requests on the Spinnaker open source project and in the Amazon EC2 Spot Instances integrations roadmap, we have further enhanced Spinnaker’s ability to deploy on Amazon Elastic Compute Cloud (Amazon EC2). The enhancements make it easier to combine Spot Instances with On-Demand, Reserved, and Savings Plans Instances to optimize workload costs with performance. You can improve workload availability when using Spot Instances with features such as allocation strategies and proactive Spot capacity rebalancing, when you are flexible about Instance types and Availability Zones. Combinations of these features offer the best possible experience when using Amazon EC2 with Spinnaker.
In this post, we detail the recent enhancements, along with a walkthrough of how you can use them following the best practices.
Amazon EC2 Spot Instances
EC2 Spot Instances are spare compute capacity in the AWS Cloud available at steep discounts of up to 90% when compared to On-Demand Instance prices. The primary difference between an On-Demand Instance and a Spot Instance is that a Spot Instance can be interrupted by Amazon EC2 with a two-minute notification when Amazon EC2 needs the capacity back. Amazon EC2 now sends rebalance recommendation notifications when Spot Instances are at an elevated risk of interruption. This signal can arrive sooner than the two-minute interruption notice. This lets you proactively replace your Spot Instances before it’s interrupted.
The best way to adhere to Spot best practices and instance fleet management is by using an Amazon EC2 Auto Scaling group When using Spot Instances in Auto Scaling group, enabling Capacity Rebalancing helps you maintain workload availability by proactively augmenting your fleet with a new Spot Instance before a running instance is interrupted by Amazon EC2.
Spinnaker concepts
Spinnaker uses three key concepts to describe your services, including applications, clusters, and server groups, and how your services are exposed to users is expressed as Load balancers and firewalls.
An application is a collection of clusters, a cluster is a collection of server groups, and a server group identifies the deployable artifact and basic configuration settings such as the number of instances, autoscaling policies, metadata, etc. This corresponds to an Auto Scaling group in AWS. We use Auto Scaling groups and server groups interchangeably in this post.
Spinnaker and Amazon EC2 Integration
In mid-2020, we started looking into customer requests and gaps in the Amazon EC2 feature set supported in Spinnaker. Around the same time, Spinnaker OSS added support for Amazon EC2 Launch Templates. Thanks to their effort, we could follow-up and expand the Amazon EC2 feature set supported in Spinnaker. Now that we understand the new features, let’s look at how to use some of them in the following tutorial spinnaker.io.
Here are some highlights of the features contributed recently:
| Feature | Why use it? (Example use cases) |
| Multiple Instance Types | Tap into multiple capacity pools to achieve and maintain the desired scale using Spot Instances. |
| Combining On-Demand and Spot Instances | – Control the proportion of On-Demand and Spot Instances launched in your sever group. – Combine Spot Instances with Amazon EC2 Reserved Instances or Savings Plans. |
| Amazon EC2 Auto Scaling allocation strategies | Reduce overall Spot interruptions by launching from Spot pools that are optimally chosen based on the available Spot capacity, using capacity-optimized Spot allocation strategy. |
| Capacity rebalancing | Improve your workload availability by proactively shifting your Spot capacity to optimal pools by enabling capacity rebalancing along with capacity-optimized allocation strategy. |
| Improved support for burstable performance instance types with custom credit specification | Reduce costs by preventing wastage of CPU cycles. |
We recommend using Spinnaker stable release 1.28.x for API users and 1.29.x for UI users. Here is the Git issue for related PRs and feature releases.
Now that we understand the new features, let’s look at how to use some of them in the following tutorial.
Example tutorial: Deploy a demo web application on an Auto Scaling group with On-Demand and Spot Instances
In this example tutorial, we setup Spinnaker to deploy to Amazon EC2, create an Application Load Balancer, and deploy a demo application on a server group diversified across multiple instance types and purchase options – this case On-Demand and Spot Instances.
We leverage Spinnaker’s API throughout the tutorial to create new resources, along with a quick guide on how to deploy the same using Spinnaker UI (Deck) and leverage UI to view them.
Prerequisites
As a prerequisite to complete this tutorial, you must have an AWS Account with an AWS Identity and Access Management (IAM) User that has the AdministratorAccess configured to use with AWS Command Line Interface (AWS CLI).
1. Spinnaker setup
We will use the AWS CloudFormation template setup-spinnaker-with-deployment-vpc.yml to setup Spinnaker and the required resources.
1.1 Create an Secure Shell(SSH) keypair used to connect to Spinnaker and EC2 instances launched by Spinnaker.
AWS\_REGION=us-west-2 # Change the region where you want Spinnaker deployedEC2\_KEYPAIR\_NAME=spinnaker-blog-${AWS\_REGION}aws ec2 create-key-pair --key-name ${EC2\_KEYPAIR\_NAME} --region ${AWS\_REGION} --query KeyMaterial --output text > ~/${EC2\_KEYPAIR\_NAME}.pemchmod 600 ~/${EC2\_KEYPAIR\_NAME}.pem1.2 Deploy the Cloudformation stack.
STACK\_NAME=spinnaker-blogSPINNAKER\_VERSION=1.29.1 # Change the version if newer versions are availableNUMBER\_OF\_AZS=3AVAILABILITY\_ZONES=${AWS\_REGION}a,${AWS\_REGION}b,${AWS\_REGION}cACCOUNT\_ID=$(aws sts get-caller-identity --query "Account" --output text)S3\_BUCKET\_NAME=spin-persitent-store-${ACCOUNT\_ID}# Download templatecurl -o setup-spinnaker-with-deployment-vpc.yml https://raw.githubusercontent.com/awslabs/ec2-spot-labs/master/ec2-spot-spinnaker/setup-spinnaker-with-deployment-vpc.yml# deploy stackaws cloudformation deploy --template-file setup-spinnaker-with-deployment-vpc.yml \ --stack-name ${STACK\_NAME} \ --parameter-overrides NumberOfAZs=${NUMBER\_OF\_AZS} \ AvailabilityZones=${AVAILABILITY\_ZONES} \ EC2KeyPairName=${EC2\_KEYPAIR\_NAME} \ SpinnakerVersion=${SPINNAKER\_VERSION} \ SpinnakerS3BucketName=${S3\_BUCKET\_NAME} \ --capabilities CAPABILITY\_NAMED\_IAM --region ${AWS\_REGION}1.3 Connecting to Spinnaker
1.3.1 Get the SSH command to port forwarding for Deck – the browser-based UI (9000) and Gate – the API Gateway (8084) to access the Spinnaker UI and API.
SPINNAKER\_INSTANCE\_DNS\_NAME=$(aws cloudformation describe-stacks --stack-name ${STACK\_NAME} --region ${AWS\_REGION} --query "Stacks[].Outputs[?OutputKey=='SpinnakerInstance'].OutputValue" --output text)echo 'ssh -A -L 9000:localhost:9000 -L 8084:localhost:8084 -L 8087:localhost:8087 -i ~/'${EC2\_KEYPAIR\_NAME}' ubuntu@$'{SPINNAKER\_INSTANCE\_DNS\_NAME}''1.3.2 Open a new terminal and use the SSH command (output from the previous command) to connect to the Spinnaker instance. After you successfully connect to the Spinnaker instance via SSH, access the Spinnaker UI here and API here.
2. Deploy a demo web application
Let’s make sure that we have the environment variables required in the shell before proceeding. If you’re using the same terminal window as before, then you might already have these variables.
STACK\_NAME=spinnaker-blogAWS\_REGION=us-west-2 # use the same region as beforeEC2\_KEYPAIR\_NAME=spinnaker-blog-${AWS\_REGION}VPC\_ID=$(aws cloudformation describe-stacks --stack-name ${STACK\_NAME} --region ${AWS\_REGION} --query "Stacks[].Outputs[?OutputKey=='VPCID'].OutputValue" --output text)
2.1 Create a Spinnaker Application
We start by creating an application in Spinnaker, a placeholder for the service that we deploy.
curl 'http://localhost:8084/tasks' \-H 'Content-Type: application/json;charset=utf-8' \--data-raw \'{ "job":[ { "type":"createApplication", "application":{ "cloudProviders":"aws", "instancePort":80, "name":"demoapp", "email":"test@test.com", "providerSettings":{ "aws":{ "useAmiBlockDeviceMappings":true } } } } ], "application":"demoapp", "description":"Create Application: demoapp"}'
2.2 Create an Application Load Balancer
Let’s create an Application Load Balanacer and a target group for port 80, spanning the three availability zones in our public subnet. We use the Demo-ALB-SecurityGroup for Firewalls to allow public access to the ALB on port 80.
As Spot Instances are interrupted with a two minute warning, you must adjust the Target Group’s deregistration delay to a slightly lower time. Recommended values are 90 seconds or less. This allows time for in-flight requests to complete and gracefully close existing connections before the instance is interrupted.
curl 'http://localhost:8084/tasks' \-H 'Content-Type: application/json;charset=utf-8' \--data-binary \'{ "application":"demoapp", "description":"Create Load Balancer: demoapp", "job":[ { "type":"upsertLoadBalancer", "name":"demoapp-lb", "loadBalancerType":"application", "cloudProvider":"aws", "credentials":"my-aws-account", "region":"'"${AWS\_REGION}"'", "vpcId":"'"${VPC\_ID}"'", "subnetType":"public-subnet", "idleTimeout":60, "targetGroups":[ { "name":"demoapp-targetgroup", "protocol":"HTTP", "port":80, "targetType":"instance", "healthCheckProtocol":"HTTP", "healthCheckPort":"traffic-port", "healthCheckPath":"/", "attributes":{ "deregistrationDelay":90 } } ], "regionZones":[ "'"${AWS\_REGION}"'a", "'"${AWS\_REGION}"'b", "'"${AWS\_REGION}"'c" ], "securityGroups":[ "Demo-ALB-SecurityGroup" ], "listeners":[ { "protocol":"HTTP", "port":80, "defaultActions":[ { "type":"forward", "targetGroupName":"demoapp-targetgroup" } ] } ] } ]}'
2.3 Create a server group
Before creating a server group (Auto Scaling group), here is a brief overview of the features used in the example:
-
-
- onDemandBaseCapacity (default 0): The minimum amount of your ASG’s capacity that must be fulfilled by On-Demand instances (can also be applied toward Reserved Instances or Savings Plans). The example uses an onDemandBaseCapacity of three.
- onDemandPercentageAboveBaseCapacity (default 100): The percentages of On-Demand and Spot Instances for additional capacity beyond OnDemandBaseCapacity. The example uses onDemandPercentageAboveBaseCapacity of 10% (i.e. 90% Spot).
- spotAllocationStrategy: This indicates how you want to allocate instances across Spot Instance pools in each Availability Zone. The example uses the recommended Capacity Optimized strategy. Instances are launched from optimal Spot pools that are chosen based on the available Spot capacity for the number of instances that are launching.
- launchTemplateOverridesForInstanceType: The list of instance types that are acceptable for your workload. Specifying multiple instance types enables tapping into multiple instance pools in multiple Availability Zones, designed to enhance your service’s availability. You can use the ec2-instance-selector, an open source AWS Command Line Interface(CLI) tool to narrow down the instance types based on resource criteria like vcpus and memory.
-
-
-
- capacityRebalance: When enabled, this feature proactively manages the EC2 Spot Instance lifecycle leveraging the new EC2 Instance rebalance recommendation. This increases the emphasis on availability by automatically attempting to replace Spot Instances in an ASG before they are interrupted by Amazon EC2. We enable this feature in this example.
-
Learn more on spinnaker.io: feature descriptions and use cases and sample API requests.
Let’s create a server group with a desired capacity of 12 instances diversified across current and previous generation instance types, attach the previously created ALB, use Demo-EC2-SecurityGroup for the Firewalls which allows http traffic only from the ALB, use the following bash script for UserData to install httpd, and add instance metadata into the index.html.
2.3.1 Save the userdata bash script into a file user-date.sh.
Note that Spinnaker only support base64 encoded userdata. We use base64 bash command to encode the file contents in the next step.
cat << "EOF" > user-data.sh#!/bin/bashyum update -yyum install httpd -yecho "<html> <head> <title>Demo Application</title> <style>body {margin-top: 40px; background-color: #Gray;} </style> </head> <body> <h2>You have reached a Demo Application running on</h2> <ul> <li>instance-id: <b> `curl http://169.254.169.254/latest/meta-data/instance-id` </b></li> <li>instance-type: <b> `curl http://169.254.169.254/latest/meta-data/instance-type` </b></li> <li>instance-life-cycle: <b> `curl http://169.254.169.254/latest/meta-data/instance-life-cycle` </b></li> <li>availability-zone: <b> `curl http://169.254.169.254/latest/meta-data/placement/availability-zone` </b></li> </ul> </body></html>" > /var/www/html/index.htmlsystemctl start httpdsystemctl enable httpdEOF2.3.2 Create the server group by running the following command. Note we use the KeyPairName that we created as part of the prerequisites.
curl 'http://localhost:8084/tasks' \-H 'Content-Type: application/json;charset=utf-8' \-d \'{ "job":[ { "type":"createServerGroup", "cloudProvider":"aws", "account":"my-aws-account", "application":"demoapp", "stack":"", "credentials":"my-aws-account","healthCheckType": "ELB","healthCheckGracePeriod":600,"capacityRebalance": true, "onDemandBaseCapacity":3, "onDemandPercentageAboveBaseCapacity":10, "spotAllocationStrategy":"capacity-optimized", "setLaunchTemplate":true, "launchTemplateOverridesForInstanceType":[ { "instanceType":"m4.large" }, { "instanceType":"m5.large" }, { "instanceType":"m5a.large" }, { "instanceType":"m5ad.large" }, { "instanceType":"m5d.large" }, { "instanceType":"m5dn.large" }, { "instanceType":"m5n.large" } ], "capacity":{ "min":6, "max":21, "desired":12 }, "subnetType":"private-subnet", "availabilityZones":{ "'"${AWS\_REGION}"'":[ "'"${AWS\_REGION}"'a", "'"${AWS\_REGION}"'b", "'"${AWS\_REGION}"'c" ] }, "keyPair":"'"${EC2\_KEYPAIR\_NAME}"'", "securityGroups":[ "Demo-EC2-SecurityGroup" ], "instanceType":"m5.large", "virtualizationType":"hvm", "amiName":"'"$(aws ec2 describe-images --owners amazon --filters "Name=name,Values=amzn2-ami-hvm-2*x86\_64-gp2" --query 'reverse(sort\_by(Images, &CreationDate))[0].Name' --region ${AWS\_REGION} --output text)"'", "targetGroups":[ "demoapp-targetgroup" ], "base64UserData":"'"$(base64 user-data.sh)"'",, "associatePublicIpAddress":false, "instanceMonitoring":false } ], "application":"demoapp", "description":"Create New server group in cluster demoapp"}'
Spinnaker creates an Amazon EC2 Launch Template and an ASG with specified parameters and waits until the ALB health check passes before sending traffic to the EC2 Instances.
The server group and launch template that we just created will look like this in Spinnaker UI:

The UI also displays capacity type, such as the purchase option for each instance type in the Instance Information section:


3. Access the application
Copy the Application Load Balancer URL by selecting the tree icon in the right top corner of the server group, and access it in a browser. You can refresh multiple times to see that the requests are going to different instances every time.

Congratulations! You successfully deployed the demo application on an Amazon EC2 server group diversified across multiple instance types and purchase options.
Moreover, you can clone, modify, disable, and destroy these server groups, as well as use them with Spinnaker pipelines to effectively release new versions of your application.
Cost savings
Check the savings you realized by deploying your demo application on EC2 Spot Instances by going to EC2 console > Spot Requests > Saving Summary.

Cleanup
To avoid incurring any additional charges, clean up the resources created in the tutorial.
Frist, delete the server group, application load balancer and application in Spinnaker.
curl 'http://localhost:8084/tasks' \-H 'Content-Type: application/json;charset=utf-8' \--data-raw \'{ "job":[ { "reason":"Cleanup", "asgName":"demoapp-v000", "moniker":{ "app":"demoapp", "cluster":"demoapp", "sequence":0 }, "serverGroupName":"demoapp-v000", "type":"destroyServerGroup", "region":"'"${AWS\_REGION}"'", "credentials":"my-aws-account", "cloudProvider":"aws" }, { "cloudProvider":"aws", "loadBalancerName":"demoapp-lb", "loadBalancerType":"application", "regions":[ "'"${AWS\_REGION}"'" ], "credentials":"my-aws-account", "vpcId":"'"${VPC\_ID}"'", "type":"deleteLoadBalancer" }, { "type":"deleteApplication", "application":{ "name":"demoapp", "cloudProviders":"aws" } } ], "application":"demoapp", "description":"Deleting ServerGroup, ALB and Application: demoapp"}'Wait for Spinnaker to delete all of the resources before proceeding further. You can confirm this either on the Spinnaker UI or AWS Management Console.
Then delete the Spinnaker infrastructure by running the following command:
aws ec2 delete-key-pair --key-name ${EC2\_KEYPAIR\_NAME} --region ${AWS\_REGION}rm ~/${EC2\_KEYPAIR\_NAME}.pemaws s3api delete-objects \--bucket ${S3\_BUCKET\_NAME} \--delete "$(aws s3api list-object-versions \--bucket ${S3\_BUCKET\_NAME} \--query='{Objects: Versions[].{Key:Key,VersionId:VersionId}}')" #If error occurs, there are no Versions and is OKaws s3api delete-objects \--bucket ${S3\_BUCKET\_NAME} \--delete "$(aws s3api list-object-versions \--bucket ${S3\_BUCKET\_NAME} \--query='{Objects: DeleteMarkers[].{Key:Key,VersionId:VersionId}}')" #If error occurs, there are no DeleteMarkers and is OKaws s3 rb s3://${S3\_BUCKET\_NAME} --force #Delete Bucketaws cloudformation delete-stack --region ${AWS\_REGION} --stack-name ${STACK\_NAME}
Conclusion
In this post, we learned about the new Amazon EC2 features recently added to Spinnaker, and how to use them to build diversified and optimized Auto Scaling Groups. We also discussed recommended best practices for EC2 Spot and how they can improve your experience with it.
We would love to hear from you! Tell us about other Continuous Integration/Continuous Delivery (CI/CD) platforms that you want to use with EC2 Spot and/or Auto Scaling Groups by adding an issue on the Spot integrations roadmap.
This blog post was written by Abeer Naffa’, Sr. Solutions Architect, Solutions Builder AWS, David Filiatrault, Principal Security Consultant, AWS and Jared Thompson, Hybrid Edge SA Specialist, AWS.
In this post, we will explore how organizations can use AWS Control Tower landing zone and AWS Organizations custom guardrails to enable compliance with data residency requirements on AWS Outposts rack. We will discuss how custom guardrails can be leveraged to limit the ability to store, process, and access data and remain isolated in specific geographic locations, how they can be used to enforce security and compliance controls, as well as, which prerequisites organizations should consider before implementing these guardrails.
Data residency is a critical consideration for organizations that collect and store sensitive information, such as Personal Identifiable Information (PII), financial, and healthcare data. With the rise of cloud computing and the global nature of the internet, it can be challenging for organizations to make sure that their data is being stored and processed in compliance with local laws and regulations.
One potential solution for addressing data residency challenges with AWS is to use Outposts rack, which allows organizations to run AWS infrastructure on premises and in their own data centers. This lets organizations store and process data in a location of their choosing. An Outpost is seamlessly connected to an AWS Region where it has access to the full suite of AWS services managed from a single plane of glass, the AWS Management Console or the AWS Command Line Interface (AWS CLI). Outposts rack can be configured to utilize landing zone to further adhere to data residency requirements.
The landing zones are a set of tools and best practices that help organizations establish a secure and compliant multi-account structure within a cloud provider. A landing zone can also include Organizations to set policies – guardrails – at the root level, known as Service Control Policies (SCPs) across all member accounts. This can be configured to enforce certain data residency requirements.
When leveraging Outposts rack to meet data residency requirements, it is crucial to have control over the in-scope data movement from the Outposts. This can be accomplished by implementing landing zone best practices and the suggested guardrails. The main focus of this blog post is on the custom policies that restrict data snapshots, prohibit data creation within the Region, and limit data transfer to the Region.
Prerequisites
Landing zone best practices and custom guardrails can help when data needs to remain in a specific locality where the Outposts rack is also located. This can be completed by defining and enforcing policies for data storage and usage within the landing zone organization that you set up. The following prerequisites should be considered before implementing the suggested guardrails:
1. AWS Outposts rack
AWS has installed your Outpost and handed off to you. An Outpost may comprise of one or more racks connected together at the site. This means that you can start using AWS services on the Outpost, and you can manage the Outposts rack using the same tools and interfaces that you use in AWS Regions.
2. Landing Zone Accelerator on AWS
We recommend using Landing Zone Accelerator on AWS (LZA) to deploy a landing zone for your organization. Make sure that the accelerator is configured for the appropriate Region and industry. To do this, you must meet the following prerequisites:
-
- A clear understanding of your organization’s compliance requirements, including the specific Region and industry rules in which you operate.
- Knowledge of the different LZAs available and their capabilities, such as the compliance frameworks with which you align.
- Have the necessary permissions to deploy the LZAs and configure it for your organization’s specific requirements.
Note that LZAs are designed to help organizations quickly set up a secure, compliant multi-account environment. However, it’s not a one-size-fits-all solution, and you must align it with your organization’s specific requirements.
3. Set up the data residency guardrails
Using Organizations, you must make sure that the Outpost is ordered within a workload account in the landing zone.
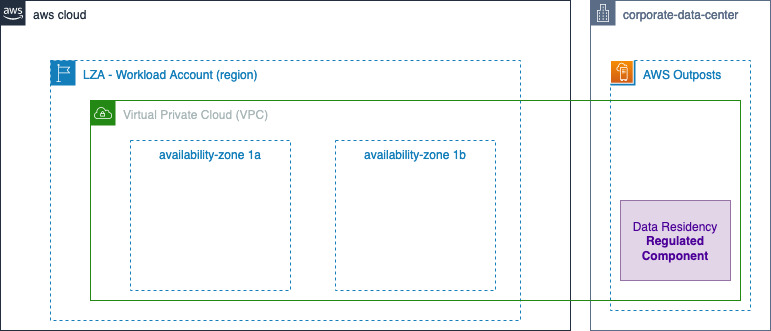
Figure 1: Landing Zone Accelerator – Outposts workload on AWS high level Architecture
Utilizing Outposts rack for regulated components
When local regulations require regulated workloads to stay within a specific boundary, or when an AWS Region or AWS Local Zone isn’t available in your jurisdiction, you can still choose to host your regulated workloads on Outposts rack for a consistent cloud experience. When opting for Outposts rack, note that, as part of the shared responsibility model, customers are responsible for attesting to physical security, access controls, and compliance validation regarding the Outposts, as well as, environmental requirements for the facility, networking, and power. Utilizing Outposts rack requires that you procure and manage the data center within the city, state, province, or country boundary for your applications’ regulated components, as required by local regulations.
Procuring two or more racks in the diverse data centers can help with the high availability for your workloads. This is because it provides redundancy in case of a single rack or server failure. Additionally, having redundant network paths between Outposts rack and the parent Region can help make sure that your application remains connected and continue to operate even if one network path fails.
However, for regulated workloads with strict service level agreements (SLA), you may choose to spread Outposts racks across two or more isolated data centers within regulated boundaries. This helps make sure that your data remains within the designated geographical location and meets local data residency requirements.
In this post, we consider a scenario with one data center, but consider the specific requirements of your workloads and the regulations that apply to determine the most appropriate high availability configurations for your case.
Outposts rack workload data residency guardrails
Organizations provide central governance and management for multiple accounts. Central security administrators use SCPs with Organizations to establish controls to which all AWS Identity and Access Management (IAM) principals (users and roles) adhere.
Now, you can use SCPs to set permission guardrails. A suggested preventative controls for data residency on Outposts rack that leverage the implementation of SCPs are shown as follows. SCPs enable you to set permission guardrails by defining the maximum available permissions for IAM entities in an account. If an SCP denies an action for an account, then none of the entities in the account can take that action, even if their IAM permissions let them. The guardrails set in SCPs apply to all IAM entities in the account, which include all users, roles, and the account root user.
Upon finalizing these prerequisites, you can create the guardrails for the Outposts Organization Unit (OU).
| Note that while the following guidelines serve as helpful guardrails – SCPs – for data residency, you should consult internally with legal and security teams for specific organizational requirements. |
To exercise better control over workloads in the Outposts rack and prevent data transfer from Outposts to the Region or data storage outside the Outposts, consider implementing the following guardrails. Additionally, local regulations may dictate that you set up these additional guardrails.
- When your data residency requirements require restricting data transfer/saving to the Region, consider the following guardrails:
a. Deny copying data from Outposts to the Region for Amazon Elastic Compute Cloud (Amazon EC2), Amazon Relational Database Service (Amazon RDS), Amazon ElastiCache and data sync “DenyCopyToRegion”.
b. Deny Amazon Simple Storage Service (Amazon S3) put action to the Region “DenyPutObjectToRegionalBuckets”.
| If your data residency requirements mandate restrictions on data storage in the Region, consider implementing this guardrail to prevent the use of S3 in the Region. Note: You can use Amazon S3 for Outposts. |
c. If your data residency requirements mandate restrictions on data storage in the Region, consider implementing “DenyDirectTransferToRegion” guardrail.
| Out of Scope is metadata such as tags, or operational data such as KMS keys. |
{ "Version": "2012-10-17", "Statement": [ { "Sid": "DenyCopyToRegion", "Action": [ "ec2:ModifyImageAttribute", "ec2:CopyImage", "ec2:CreateImage", "ec2:CreateInstanceExportTask", "ec2:ExportImage", "ec2:ImportImage", "ec2:ImportInstance", "ec2:ImportSnapshot", "ec2:ImportVolume", "rds:CreateDBSnapshot", "rds:CreateDBClusterSnapshot", "rds:ModifyDBSnapshotAttribute", "elasticache:CreateSnapshot", "elasticache:CopySnapshot", "datasync:Create*", "datasync:Update*" ], "Resource": "*", "Effect": "Deny" }, { "Sid": "DenyDirectTransferToRegion", "Action": [ "dynamodb:PutItem", "dynamodb:CreateTable", "ec2:CreateTrafficMirrorTarget", "ec2:CreateTrafficMirrorSession", "rds:CreateGlobalCluster", "es:Create*", "elasticfilesystem:C*", "elasticfilesystem:Put*", "storagegateway:Create*", "neptune-db:connect", "glue:CreateDevEndpoint", "glue:UpdateDevEndpoint", "datapipeline:CreatePipeline", "datapipeline:PutPipelineDefinition", "sagemaker:CreateAutoMLJob", "sagemaker:CreateData*", "sagemaker:CreateCode*", "sagemaker:CreateEndpoint", "sagemaker:CreateDomain", "sagemaker:CreateEdgePackagingJob", "sagemaker:CreateNotebookInstance", "sagemaker:CreateProcessingJob", "sagemaker:CreateModel*", "sagemaker:CreateTra*", "sagemaker:Update*", "redshift:CreateCluster*", "ses:Send*", "ses:Create*", "sqs:Create*", "sqs:Send*", "mq:Create*", "cloudfront:Create*", "cloudfront:Update*", "ecr:Put*", "ecr:Create*", "ecr:Upload*", "ram:AcceptResourceShareInvitation" ], "Resource": "*", "Effect": "Deny" }, { "Sid": "DenyPutObjectToRegionalBuckets", "Action": [ "s3:PutObject" ], "Resource": ["arn:aws:s3:::*"], "Effect": "Deny" } ]}- If your data residency requirements require limitations on data storage in the Region, consider implementing this guardrail “DenySnapshotsToRegion” and “DenySnapshotsNotOutposts” to restrict the use of snapshots in the Region.
a. Deny creating snapshots of your Outpost data in the Region “DenySnapshotsToRegion”
Make sure to update the Outposts “<outpost\_arn\_pattern>”.
b. Deny copying or modifying Outposts Snapshots “DenySnapshotsNotOutposts”
Make sure to update the Outposts “<outpost\_arn\_pattern>”.
Note: “<outpost\_arn\_pattern>” default is arn:aws:outposts:*:*:outpost/*
{ "Version": "2012-10-17", "Statement": [ { "Sid": "DenySnapshotsToRegion", "Effect":"Deny", "Action":[ "ec2:CreateSnapshot", "ec2:CreateSnapshots" ], "Resource":"arn:aws:ec2:*::snapshot/*", "Condition":{ "ArnLike":{ "ec2:SourceOutpostArn":"<outpost\_arn\_pattern>" }, "Null":{ "ec2:OutpostArn":"true" } } }, { "Sid": "DenySnapshotsNotOutposts", "Effect":"Deny", "Action":[ "ec2:CopySnapshot", "ec2:ModifySnapshotAttribute" ], "Resource":"arn:aws:ec2:*::snapshot/*", "Condition":{ "ArnLike":{ "ec2:OutpostArn":"<outpost\_arn\_pattern>" } } } ]}- This guardrail helps to prevent the launch of Amazon EC2 instances or creation of network interfaces in non-Outposts subnets. It is advisable to keep data residency workloads within the Outposts rather than the Region to ensure better control over regulated workloads. This approach can help your organization achieve better control over data residency workloads and improve governance over your AWS Organization.
Make sure to update the Outposts subnets “<outpost\_subnet\_arns>”.
{"Version": "2012-10-17", "Statement":[{ "Sid": "DenyNotOutpostSubnet", "Effect":"Deny", "Action": [ "ec2:RunInstances", "ec2:CreateNetworkInterface" ], "Resource": [ "arn:aws:ec2:*:*:network-interface/*" ], "Condition": { "ForAllValues:ArnNotEquals": { "ec2:Subnet": ["<outpost\_subnet\_arns>"] } } }]}Additional considerations
When implementing data residency guardrails on Outposts rack, consider backup and disaster recovery strategies to make sure that your data is protected in the event of an outage or other unexpected events. This may include creating regular backups of your data, implementing disaster recovery plans and procedures, and using redundancy and failover systems to minimize the impact of any potential disruptions. Additionally, you should make sure that your backup and disaster recovery systems are compliant with any relevant data residency regulations and requirements. You should also test your backup and disaster recovery systems regularly to make sure that they are functioning as intended.
Additionally, the provided SCPs for Outposts rack in the above example do not block the “logs:PutLogEvents”. Therefore, even if you implemented data residency guardrails on Outpost, the application may log data to CloudWatch logs in the Region.
| Highlights By default, application-level logs on Outposts rack are not automatically sent to Amazon CloudWatch Logs in the Region. You can configure CloudWatch logs agent on Outposts rack to collect and send your application-level logs to CloudWatch logs. logs: PutLogEvents does transmit data to the Region, but it is not blocked by the provided SCPs, as it’s expected that most use cases will still want to be able to use this logging API. However, if blocking is desired, then add the action to the first recommended guardrail. If you want specific roles to be allowed, then combine with the ArnNotLike condition example referenced in the previous highlight. |
Conclusion
The combined use of Outposts rack and the suggested guardrails via AWS Organizations policies enables you to exercise better control over the movement of the data. By creating a landing zone for your organization, you can apply SCPs to your Outposts racks that will help make sure that your data remains within a specific geographic location, as required by the data residency regulations.
Note that, while custom guardrails can help you manage data residency on Outposts rack, it’s critical to thoroughly review your policies, procedures, and configurations to make sure that they are compliant with all relevant data residency regulations and requirements. Regularly testing and monitoring your systems can help make sure that your data is protected and your organization stays compliant.
References
This post demonstrates how to integrate AWS serverless services with artificial intelligence (AI) technologies, ChatGPT, and DALL-E. This full stack event-driven application showcases a method of generating unique bedtime stories for children by using predetermined characters and scenes as a prompt for ChatGPT.
Every night at bedtime, the serverless scheduler triggers the application, initiating an event-driven workflow to create and store new unique AI-generated stories with AI-generated images and supporting audio.
These datasets are used to showcase the story on a custom website built with Next.js hosted with AWS App Runner. After the story is created, a notification is sent to the user containing a URL to view and read the story to the children.
Example notification of a story hosted with Next.js and App Runner
By integrating AWS services with AI technologies, you can now create new and innovative ideas that were previously unimaginable.
The application mentioned in this blog post demonstrates examples of point-to-point messaging with Amazon EventBridge pipes, publish/subscribe patterns with Amazon EventBridge and reacting to change data capture events with DynamoDB Streams.
Understanding the architecture
The following image shows the serverless architecture used to generate stories:
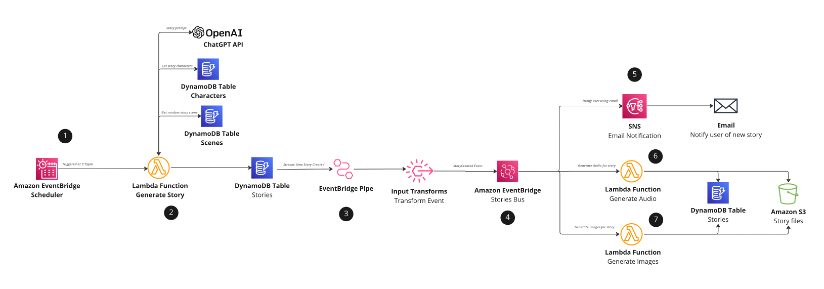
Architecture diagram for Serverless bed time story generation with ChatGPT and DALL-E
A new children’s story is generated every day at configured time using Amazon EventBridge Scheduler (Step 1). EventBridge Scheduler is a service capable of scaling millions of schedules with over 200 targets and over 6000 API calls. This example application uses EventBridge scheduler to trigger an AWS Lambda function every night at the same time (7:15pm). The Lambda function is triggered to start the generation of the story.

EventBridge scheduler triggers Lambda function every day at 7:15pm (bed time)
The “Scenes” and “Characters” Amazon DynamoDB tables contain the characters involved in the story and a scene that is randomly selected during its creation. As a result, ChatGPT receives a unique prompt each time. An example of the prompt may look like this:
“`
Write a title and a rhyming story on 2 main characters called Parker and Jackson. The story needs to be set within the scene haunted woods and be at least 200 words long
“`
After the story is created, it is then saved in the “Stories” DynamoDB table (Step 2).
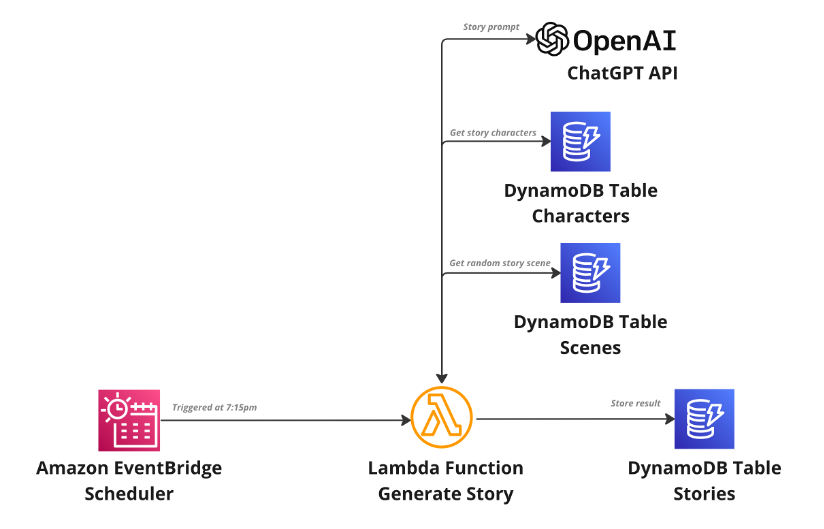
Scheduler triggering Lambda function to generate the story and store story into DynamoDB
Once the story is created this initiates a change data capture event using DynamoDB Streams (Step 3). This event flows through point-to-point messaging with EventBridge pipes and directly into EventBridge. Input transforms are then used to convert the DynamoDB Stream event into a custom EventBridge event, which downstream consumers can comprehend. Adopting this pattern is beneficial as it allows us to separate contracts from the DynamoDB event schema and not having downstream consumers conform to this schema structure, this mapping allows us to remain decoupled from implementation details.

EventBridge Pipes connecting DynamoDB streams directly into EventBridge.
Upon triggering the StoryCreated event in EventBridge, three targets are triggered to carry out several processes (Step 4). Firstly, AI Images are processed, followed by the creation of audio for the story. Finally, the end user is notified of the completed story through Amazon SNS and email subscriptions. This fan-out pattern enables these tasks to be run asynchronously and in parallel, allowing for faster processing times.

EventBridge pub/sub pattern used to start async processing of notifications, audio, and images.
An SNS topic is triggered by the `StoryCreated` event to send an email to the end user using email subscriptions (Step 6). The email consists of a URL with the id of the story that has been created. Clicking on the URL takes the user to the frontend application that is hosted with App Runner.
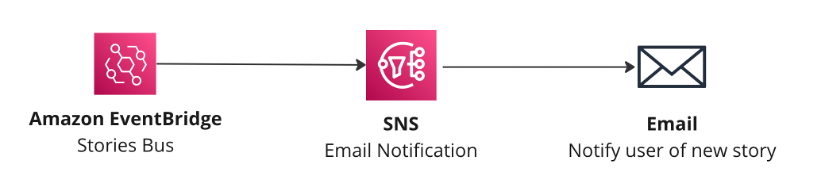
Using SNS to notify the user of a new story

Example email sent to the user
Amazon Polly is used to generate the audio files for the story (Step 6). Upon triggering the `StoryCreated` event, a Lambda function is triggered, and the story description is used and given to Amazon Polly. Amazon Polly then creates an audio file of the story, which is stored in Amazon S3. A presigned URL is generated and saved in DynamoDB against the created story. This allows the frontend application and browser to retrieve the audio file when the user views the page. The presigned URL has a validity of two days, after which it can no longer be accessed or listened to.
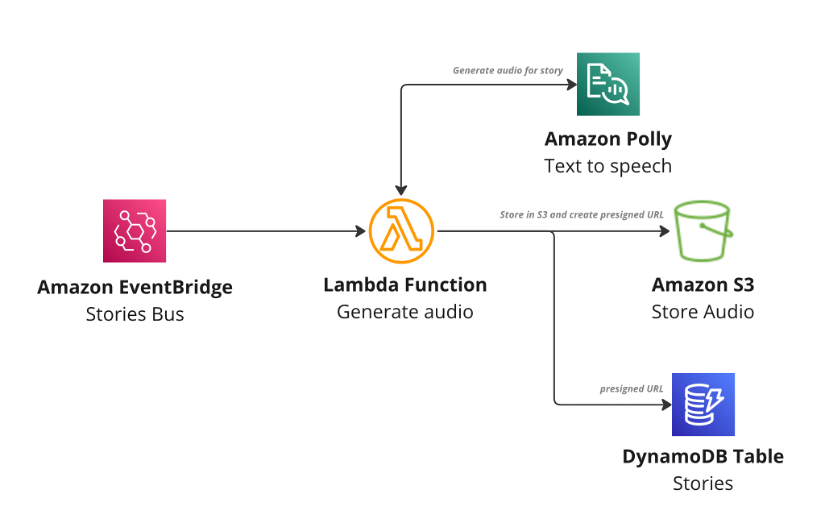
Lambda function to generate audio using Amazon Polly, store in S3 and update story with presigned URL
The `StoryCreated` event also triggers another Lambda function, which uses the OpenAI API to generate an AI image using DALL-E based on the generated story (Step 7). Once the image is generated, the image is downloaded and stored in Amazon S3. Similar to the audio file, the system generates a presigned URL for the image and saves it in DynamoDB against the story. The presigned URL is only valid for two days, after which it becomes inaccessible for download or viewing.

Lambda function to generate images, store in S3 and update story with presigned URL.
In the event of a failure in audio or image generation, the frontend application still loads the story, but does not display the missing image or audio at that moment. This ensures that the frontend can continue working and provide value. If you wanted more control and only trigger the user’s notification event once all parallel tasks are complete the aggregator messaging pattern can be considered.
Hosting the frontend Next.js application with AWS App Runner
Next.js is used by the frontend application to render server-side rendered (SSR) pages that can access the stories from the DynamoDB table, which are then hosted with AWS App Runner after being containerized.

Next.js application hosted with App Runner, with permissions into DynamoDB table.
AWS App Runner enables you to deploy containerized web applications and APIs securely, without needing any prior knowledge of containers or infrastructure. With App Runner, developers can concentrate on their application, while the service handles container startup, running, scaling, and load balancing. After deployment, App Runner provides a secure URL for clients to begin making HTTP requests against.
With App Runner, you have two primary options for deploying your container: source code connections or source images. Using source code connections grants App Runner permission to pull the image file directly from your source code, and with Automatic deployment configured, it can redeploy the application when changes are made. Alternatively, source images provide App Runner with the image’s location in an image registry, and this image is deployed by App Runner.
In this example application, CDK deploys the application using the DockerImageAsset construct with the App Runner construct. Once deployed, App Runner builds and uploads the frontend image to Amazon Elastic Container Registry (ECR) and deploys it. Downstream consumers can access the application using the secure URL provided by App Runner. In this example, the URL is used when the SNS notification is sent to the user when the story is ready to be viewed.
Giving the frontend container permission to DynamoDB table
To grant the Next.js application permission to obtain stories from the Stories DynamoDB table, App Runner instance roles are configured. These roles are optional and can provide the necessary permissions for the container to access AWS services required by the compute service.
If you want to learn more about AWS App Runner, you can explore the free workshop.
Design choices and assumptions
The DynamoDB Time to Live (TTL) feature is ideal for the short-lived nature of daily generated stories. DynamoDB handle the deletion of stories after two days by setting the TTL attribute on each story. Once a story is deleted, it becomes inaccessible through the generated story URLs.
Using Amazon S3 presigned URLs is a method to grant temporary access to a file in S3. This application creates presigned URLs for the audio file and generated images that last for 2 days, after which the URLs for the S3 items become invalid.
Input transforms are used between DynamoDB streams and EventBridge events to decouple the schemas and events consumed by downstream targets. Consuming the events as they are is known as the “conformist” pattern, and couples us to implementation details of DynamoDB streams with downstream EventBridge consumers. This allows the application to remain decoupled from implementation details and remain flexible.
Conclusion
The adoption of artificial intelligence (AI) technology has significantly increased in various industries. ChatGPT, a large language model that can understand and generate human-like responses in natural language, and DALL-E, an image generation system that can create realistic images based on textual descriptions, are examples of such technology. These systems have demonstrated the potential for AI to provide innovative solutions and transform the way we interact with technology.
This blog post explores ways in which you can utilize AWS serverless services with ChatGTP and DALL-E to create a story generation application fronted by a Next.js application hosted with App Runner. EventBridge Scheduler is used to trigger the story creation process then react to change data capture events with DynamoDB streams and EventBridge Pipes, and use Amazon EventBridge to fan out compute tasks to process notifications, images, and audio files.
You can find the documentation and the source code for this application in GitHub.
For more serverless learning resources, visit Serverless Land.
This post is written by Alexey Paramonov, Solutions Architect, ISV.
This blog post demonstrates how to reconnect anonymous users to WebSocket API without losing their session context. You learn how to link WebSocket API connection IDs to the logical user, what to do when the connection fails, and how to store and recover session information when the user reconnects.
WebSocket APIs are common in modern interactive applications. For example, for watching stock prices, following live chat feeds, collaborating with others in productivity tools, or playing online games. Another example described in “Implementing reactive progress tracking for AWS Step Functions” blog post uses WebSocket APIs to send progress back to the client.
The backend is aware of the client’s connection ID to find the right client to send data to. But if the connection temporarily fails, the client reconnects with a new connection ID. If the backend does not have a mechanism to associate a new connection ID with the same client, the interaction context is lost and the user must start over again. In a live chat feed that could mean skipping to the most recent message with a loss of some previous messages. And in case of AWS Step Functions progress tracking the user would lose progress updates.
Overview
The sample uses Amazon API Gateway WebSocket APIs. It uses AWS Lambda for WebSocket connection management and for mocking a teleprinter to generate a stateful stream of characters for testing purposes. There are two Amazon DynamoDB tables for storing connection IDs and user sessions, as well as an optional MediaWiki API for retrieving an article.
The following diagram outlines the architecture:

- The browser generates a random user ID and stores it locally in the session storage. The client sends the user ID inside the Sec-WebSocket-Protocol header to WebSocket API.
- The default WebSocket API route OnConnect invokes OnConnect Lambda function and passes the connection ID and the user ID to it. OnConnect Lambda function determines if the user ID exists in the DynamoDB table and either creates a new item or updates the existing one.
- When the connection is open, the client sends the Read request to the Teleprinter Lambda function.
- The Teleprinter Lambda function downloads an article about WebSocket APIs from Wikipedia and stores it as a string in memory.
- The Teleprinter Lambda function checks if there is a previous state stored in the Sessions table in DynamoDB. If it is a new user, the Teleprinter Lambda function starts sending the article from the beginning character by character back to the client via WebSocket API. If it is a returning user, the Teleprinter Lambda function retrieves the last cursor position (the last successfully sent character) from the DynamoDB table and continues from there.
- The Teleprinter Lambda function sends 1 character every 100ms back to the client.
- The client receives the article and prints it out character by character as each character arrives.
- If the connection breaks, the WebSocket API calls the OnDisconnect Lambda function automatically. The function marks the connection ID for the given user ID as inactive.
- If the user does not return within 5 minutes, Amazon EventBridge scheduler invokes the OnDelete Lambda function, which deletes items with more than 5 minutes of inactivity from Connections and Sessions tables.
A teleprinter returns data one character at a time instead of a single response. When the Lambda function fetches an article, it feeds it character by character inside the for-loop with a delay of 100ms on every iteration. This demonstrates how the user can continue reading the article after reconnecting and not starting the feed all over again. The pattern could be useful for traffic limiting by slowing down user interactions with the backend.
Understanding sample code functionality
When the user connects to the WebSocket API, the client generates a user ID and saves it in the browser’s session storage. The user ID is a random string. When the client opens a WebSocket connection, the frontend sends the user ID inside the Sec-WebSocket-Protocol header, which is standard for WebSocket APIs. When using the JavaScript WebSocket library, there is no need to specify the header manually. To initialize a new connection, use:
const newWebsocket = new WebSocket(wsUri, userId);wsUri is the deployed WebSocket API URL and userId is a random string generated in the browser. The userId goes to the Sec-WebSocket-Protocol header because WebSocket APIs generally offer less flexibility in choosing headers compared to RESTful APIs. Another way to pass the user ID to the backend could be a query string parameter.
The backend receives the connection request with the user ID and connection ID. The WebSocket API generates the connection ID automatically. It’s important to include the Sec-WebSocket-Protocol in the backend response, otherwise the connection closes immediately:
return { 'statusCode': 200, 'headers': { 'Sec-WebSocket-Protocol': userId } }The Lambda function stores this information in the DynamoDB Connections table:
ddb.put\_item( TableName=table\_name, Item={ 'userId': {'S': userId}, 'connectionId': {'S': connection\_id}, 'domainName': {'S': domain\_name}, 'stage': {'S': stage}, 'active': {'S': True} } )The active attribute indicates if the connection is up. In the case of inactivity over a specified time limit, the OnDelete Lambda function deletes the item automatically. The Put operation comes handy here because you don’t need to query the DB if the user already exists. If it is a new user, Put creates a new item. If it is a reconnection, Put updates the connectionId and sets active to True again.
The primary key for the Connections table is userId, which helps locate users faster as they reconnect. The application relies on a global secondary index (GSI) for locating connectionId. This is necessary for marking the connection inactive when WebSocket API calls OnDisconnect function automatically.
Now the application has connection management, you can retrieve session data. The Teleprinter Lambda function receives a connection ID from WebSocket API. You can query the GSI of Connections table and find if the user exists:
def get\_user\_id(connection\_id): response = ddb.query( TableName=connections\_table\_name, IndexName='connectionId-index', KeyConditionExpression='connectionId = :c', ExpressionAttributeValues={ ':c': {'S': connection\_id} } ) items = response['Items'] if len(items) == 1: return items[0]['userId']['S'] return NoneAnother DynamoDB table called Sessions is used to check if the user has an existing session context. If yes, the Lambda function retrieves the cursor position and resumes teletyping. If it is a brand-new user, the Lambda function starts sending characters from the beginning. The function stores a new cursor position if the connection breaks. This makes it easier to detect stale connections and store the current cursor position in the Sessions table.
Try: api\_client.post\_to\_connection( ConnectionId=connection\_id, Data=bytes(ch, 'utf-8') ) except api\_client.exceptions.GoneException as e: print(f"Found stale connection, persisting state") store\_cursor\_position(user\_id, pos) return { 'statusCode': 410 } def store\_cursor\_position(user\_id, pos): ddb.put\_item( TableName=sessions\_table\_name, Item={ 'userId': {'S': user\_id}, 'cursorPosition': {'N': str(pos)} } )After this, the Teleprinter Lambda function ends.
Serving authenticated users
The same mechanism also works for authenticated users. The main difference is it takes a given ID from a JWT token or other form of authentication and uses it instead of a randomly generated user ID. The backend relies on unambiguous user identification and may require only minor changes for handling authenticated users.
Deleting inactive users
The OnDisconnect function marks user connections as inactive and adds a timestamp to ‘lastSeen’ attribute. If the user never reconnects, the application should purge inactive items from Connections and Sessions tables. Depending on your operational requirements, there are two options.
Option 1: Using EventBridge Scheduler
The sample application uses EventBridge to schedule OnDelete function execution every 5 minutes. The following code shows how AWS SAM adds the scheduler to the OnDelete function:
OnDeleteSchedulerFunction: Type: AWS::Serverless::Function Properties: Handler: app.handler Runtime: python3.9 CodeUri: handlers/onDelete/ MemorySize: 128 Environment: Variables: CONNECTIONS\_TABLE\_NAME: !Ref ConnectionsTable SESSIONS\_TABLE\_NAME: !Ref SessionsTable Policies: - DynamoDBCrudPolicy: TableName: !Ref ConnectionsTable - DynamoDBCrudPolicy: TableName: !Ref SessionsTable Events: Schedule: Type: ScheduleV2 Properties: ScheduleExpression: rate(5 minute)The Events section of the function definition is where AWS SAM sets up the scheduled execution. Change values in ScheduleExpression to meet your scheduling requirements.
The OnDelete function relies on the GSI to find inactive user IDs. The following code snippet shows how to query connections with more than 5 minutes of inactivity:
five\_minutes\_ago = int((datetime.now() - timedelta(minutes=5)).timestamp()) stale\_connection\_items = table\_connections.query( IndexName='lastSeen-index', KeyConditionExpression='active = :hk and lastSeen < :rk', ExpressionAttributeValues={ ':hk': 'False', ':rk': five\_minutes\_ago } )After that, the function iterates through the list of user IDs and deletes them from the Connections and Sessions tables:
# remove inactive connections with table\_connections.batch\_writer() as batch: for item in inactive\_users: batch.delete\_item(Key={'userId': item['userId']}) # remove inactive sessions with table\_sessions.batch\_writer() as batch: for item in inactive\_users: batch.delete\_item(Key={'userId': item['userId']})The sample uses batch\_writer() to avoid requests for each user ID.
Option 2: Using DynamoDB TTL
DynamoDB provides a built-in mechanism for expiring items called Time to Live (TTL). This option is easier to implement. With TTL, there’s no need for EventBridge scheduler, OnDelete Lambda function and additional GSI to track time span. To set up TTL, use the ‘lastSeen’ attribute as an object creation time. TTL deletes or archives the item after a specified period of time. When using AWS SAM or AWS CloudFormation templates, add TimeToLiveSpecification to your code.
The TTL typically deletes expired items within 48 hours. If your operational requirements demand faster and more predictable timing, use option 1. For example, if your application aggregates data while the user is offline, use option 1. But if your application stores a static session data, like cursor position used in this sample, option 2 can be an easier alternative.
Deploying the sample
Prerequisites
Ensure you can manage AWS resources from your terminal.
- AWS CLI and AWS SAM CLI installed.
- You have an AWS account. If not, visit this page.
- Your user has enough permissions to manage AWS resources.
- Git is installed.
- NPM is installed (only for local frontend deployment).
You can find the source code and README here.
The repository contains both the frontend and the backend code. To deploy the sample, follow this procedure:
- Open a terminal and clone the repository:
git clone https://github.com/aws-samples/websocket-sessions-management.git - Navigate to the root of the repository.
- Build and deploy the AWS SAM template:
sam build && sam deploy --guided - Note the value of WebSocketURL in the output. You need it later.
With the backend deployed, test it using the hosted frontend.
Testing the application

You can watch an animated demo here.
Notice that the app has generated a random user ID on startup. The app shows the user ID above in the header.
- Paste the WebSocket URL into the text field. You can find the URL in the console output after you have successfully deployed your AWS SAM template. Alternatively, you can navigate to AWS Management Console (make sure you are in the right Region), select the API you have recently deployed, go to “Stages”, select the deployed stage and copy the “WebSocket URL” value.
- Choose Connect. The app opens a WebSocket connection.
- Choose Tele-read to start receiving the Wikipedia article character by character. New characters appear in the second half of the screen as they arrive.
- Choose Disconnect to close WebSocket connection. Reconnect again and choose Tele-read. Your session resumes from where you stopped.
- Choose Reset Identity. The app closes the WebSocket connection and changes the user ID. Choose Connect and Tele-read again and your character feed starts from the beginning.
Cleaning up
To clean up the resources, in the root directory of the repository run:
sam deleteThis removes all resources provisioned by the template.yml file.
Conclusion
In this post, you learn how to keep track of user sessions when using WebSockets API and not lose the session context when the user reconnects again. Apply learnings from this example to improve your user experience when using WebSocket APIs for web-frontend and mobile applications, where internet connections may be unstable.
For more serverless learning resources, visit Serverless Land.
This post was written by Mehmet Nuri Deveci, Sr. Software Development Engineer, Steven Cook, Sr.Solutions Architect, and Maximilian Schellhorn, Solutions Architect.
When using Java in the serverless environment, the AWS Serverless Application Model Command Line Interface (AWS SAM CLI) offers an easier way to build and deploy AWS Lambda functions. You can either use the default AWS SAM build mechanism or tailor the build behavior to your application needs.
Since Java offers a variety of plugins and tools for building your application, builders usually have custom requirements for their build setup. In addition, when targeting GraalVM or non-LTS versions of the JVM, the build behavior requires additional configuration to build a Lambda custom runtime.
This blog post provides an overview of the common ways to build Java applications for Lambda with the AWS SAM CLI. This allows you to make well-informed decisions based on your projects’ requirements. This post focuses on Apache Maven, however the same concepts apply for Gradle.
You can find the source code for these examples in the GitHub repo.
Overview
The following diagram provides an overview of the build and deployment process with AWS SAM CLI. The default behavior includes the following steps:
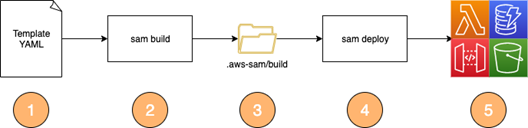
- Define your infrastructure resources such as Lambda functions, Amazon DynamoDB Tables, Amazon S3 buckets, or an Amazon API Gateway endpoint in a template.yaml file.
- The CLI command “sam build” builds the application based on the chosen runtime and configuration within the template.
- The sam build command populates the .aws-sam/build folder with the built artifacts (for example, class files or jars).
- The sam deploy command uploads your template and function code from the .aws-sam/build folder and starts an AWS CloudFormation deployment.
- After a successful deployment, you can find the provisioned resources in your AWS account.
Using the default Java build mechanism in AWS SAM CLI
AWS SAM CLI supports building Serverless Java functions with Maven or Gradle. You must use one of the supported Java runtimes (java8, java8.al2, java11) and your function’s resource CodeUri property must point to a source folder.

AWS SAM CLI ships with default build mechanisms provided by the aws-lambda-builders project. It is therefore not required to package or build your application in advance and any customized build steps in pom.xml will not be used. For example, by default the AWS SAM Maven Lambda Builder triggers the following steps:
- mvn clean install to build the function.
- mvn dependency:copy-dependencies -DincludeScope=runtime -Dmdep.prependGroupId=true to prepare dependency jar files.
- Class files in target/classes and dependency jar archives in target/dependency are copied to the final build artifact location in .aws-sam/build/{ResourceLogicalId}.
Start the build process by running the following command from the directory where the template.yaml resides:
sam buildThis results in the following outputs:

The .aws-sam build folder contains the necessary classes and libraries to run your application. The transformed template.yaml file points to the build artifacts directory (instead of pointing to the original source directory).
Run the following command to deploy the resources to AWS:
sam deploy --guidedThis zips the HelloWorldFunction directory in .aws-sam/build and uploads it to the Lambda service.
Building Uber-Jars with AWS SAM CLI
A popular way for building and packaging Java projects, especially when using frameworks such as Micronaut, Quarkus and Spring Boot is to create an Uber-jar or Fat-jar. This is a jar file that contains the application class files with all the dependency class files within a single jar file. This simplifies the deployment and management of the application artifact.
Frameworks typically provide a Maven or Gradle setup that produces an Uber-jar by default. For example, by using the Apache Maven Shade plugin for Maven, you can configure Uber-jar packaging:
<build> <plugins> <plugin> <groupId>org.apache.maven.plugins</groupId> <artifactId>maven-shade-plugin</artifactId> <version>3.4.1</version> <executions> <execution> <phase>package</phase> <goals> <goal>shade</goal> </goals> </execution> </executions> </plugin> </plugins></build>The maven-shade-plugin modifies the package phase of the Maven build to produce the Uber-jar file in the target directory.
To build and package an Uber-jar with AWS SAM, you must customize the AWS SAM CLI build process. You can do this by using a Makefile to replace the default steps discussed earlier. Within the template.yaml, declare a Metadata resource attribute with a BuildMethod entry. The sam build process then looks for a Makefile within the CodeUri directory.

The Makefile is responsible for building the artifacts required by AWS SAM to deploy the Lambda function. AWS SAM runs the target in the Makefile. This is an example Makefile:
build-HelloWorldFunctionUberJar: mvn clean package mkdir -p $(ARTIFACTS\_DIR)/lib cp ./target/HelloWorld*.jar $(ARTIFACTS\_DIR)/lib/The Makefile runs the Maven clean and package goals that build Uber-jar in the target directory via the Apache Maven Plugin. As the Lambda Java runtime loads jar files from the lib directory, you can copy the uber-jar file to the $ARTIFACTS\_DIR/lib directory as part of the build steps.
To build the application, run:
sam buildThis triggers the customized build step and creates the following output resources:

The deployment step is identical to the previous example.
Running the build process inside a container
AWS SAM provides a mechanism to run the application build process inside a Docker container. This provides the benefit of not requiring your build dependencies (such as Maven and Java) to be installed locally or in your CI/CD environment.
To run the build process inside a container, use the command line options –use-container and optionally –build-image. The following diagram outlines the modified build process with this option:

- Similar to the previous examples, the directory with the application sources or the Makefile is referenced.
- To run the build process inside a Docker container, provide the command line option:
sam build –-use-container - By default, AWS SAM uses images for container builds that are maintained in the GitHub repo aws/aws-sam-build-images. AWS SAM pulls the container image depending on the defined runtime. For this example, it pulls the public.ecr.aws/sam/build-java11 image, which has prerequisites such as Maven and Java11 pre-installed to build the application. In addition, the source code folder is mounted in the container and the Makefile target or default build mechanism is run within the container.
- The final artifacts are delivered to the.aws-sam/build directory on the local file system. If you are using a Makefile, you can copy the final artifact to the $ARTIFACTS\_DIR.
- The sam deploy command uploads the template and function code from the .aws-sam/build directory and starts a CloudFormation deployment.
- After a successful deployment, you can find the provisioned resources in your AWS account.
To test the behavior, run the previous examples with the –use-container option. No additional changes are needed.
Using your own base build images for creating custom runtimes
When you are targeting a non-supported Lambda runtime, such as a non-LTS Java version or natively compiled GraalVM native images, you can create your own build image with the necessary dependencies installed.
For example, to build a native image with GraalVM, you must have GraalVM and the native image tool installed when building your application.
To create a custom image:
- Create a Dockerfile with the needed dependencies:
#Use the official AWS SAM base image or Amazon Linux 2 as a starting pointFROM public.ecr.aws/sam/build-java11:latest-x86\_64#Install GraalVM dependenciesENV GRAAL\_VERSION 22.2.0ENV GRAAL\_FOLDERNAME graalvm-ce-java11-${GRAAL\_VERSION}ENV GRAAL\_FILENAME graalvm-ce-java11-linux-amd64-${GRAAL\_VERSION}.tar.gzRUN curl -4 -L https://github.com/graalvm/graalvm-ce-builds/releases/download/vm-22.2.0/graalvm-ce-java11-linux-amd64-22.2.0.tar.gz | tar -xvzRUN mv $GRAAL\_FOLDERNAME /usr/lib/graalvmRUN rm -rf $GRAAL\_FOLDERNAME#Install Native Image dependenciesRUN /usr/lib/graalvm/bin/gu install native-imageRUN ln -s /usr/lib/graalvm/bin/native-image /usr/bin/native-imageRUN ln -s /usr/lib/maven/bin/mvn /usr/bin/mvn#Set GraalVM as defaultENV JAVA\_HOME /usr/lib/graalvm - Build your image locally or upload it to a container registry:
docker build . -t sam/custom-graal-image - Use AWS SAM build with the build image argument to provide your custom image:
sam build --use-container --build-image sam/custom-graal-image
You can find the source code and an example Dockerfile, Makefile, and pom.xml for GraalVM native images in the GitHub repo.
When you use the official AWS SAM build images as a base image, you have all the necessary tooling such as Maven, Java11 and the Lambda builders installed. If you want to use a more customized approach and use a different base image, you must install these dependencies.
For an example, check the GraalVM with Java 17 cookiecutter template. In addition, there are multiple additional components involved when building custom runtimes, which are outlined in “Build a custom Java runtime for AWS Lambda”.
To avoid providing the command line options on every build, include them in the samconfig.toml file:
[default.build.parameters]use\_container = truebuild\_image = ["public.ecr.aws/sam/build-java11:latest-x86\_64"]For additional information, refer to the official AWS SAM CLI documentation.
Deploying the application without building with AWS SAM
There might be scenarios where you do not want to rely on the build process offered by AWS SAM. For example, when you have highly customized or established build processes, or advanced dependency caching or visibility requirements.
In this case, you can still use the AWS SAM CLI commands such as sam local and sam deploy. But you must point your CodeUri property directly to the pre-built artifact (instead of the source code directory):
HelloWorldFunctionSkipBuild: Type: AWS::Serverless::Function Properties: CodeUri: HelloWorldFunction/target/HelloWorld-1.0.jar Handler: helloworld.App::handleRequestIn this case, there is no need to use the sam build command, since the build logic is outside of AWS SAM CLI:

Here, the sam build command fails because it looks for a source folder to build the application. However, there might be cases where you have a mixed setup that includes some functions that point to pre-built artifacts and others that are built by AWS SAM CLI. In this scenario, you can mark those functions to explicitly skip the build process by adding the following SkipBuild flag in the Metadata section of your resource definition:
HelloWorldFunctionSkipBuild: Type: AWS::Serverless::Function Properties: CodeUri: HelloWorldFunction/target/HelloWorld-1.0.jar Handler: helloworld.App::handleRequest Runtime: java11 Metadata: SkipBuild: TrueConclusion
This blog post shows how to build Java applications with the AWS SAM CLI. You learnt about the default build mechanisms, and how to customize the build behavior and abstract the build process inside a container environment. Visit the GitHub repository for the example code templates referenced in the examples.
To learn more, dive deep into the AWS SAM documentation. For more serverless learning resources, visit Serverless Land.
This post is written by Luca Mezzalira, Principal Specialist Solutions Architect, Serverless.
The previous blog post describes the architecture for creating a server-side rendering micro-frontend in AWS. This and subsequent posts explain the different parts that compose this architecture in detail. The code for the example is available on a AWS Samples GitHub repository.
For context, this post covers the infrastructure related to the UI composer, and why you need an Amazon S3 bucket for storing static assets:
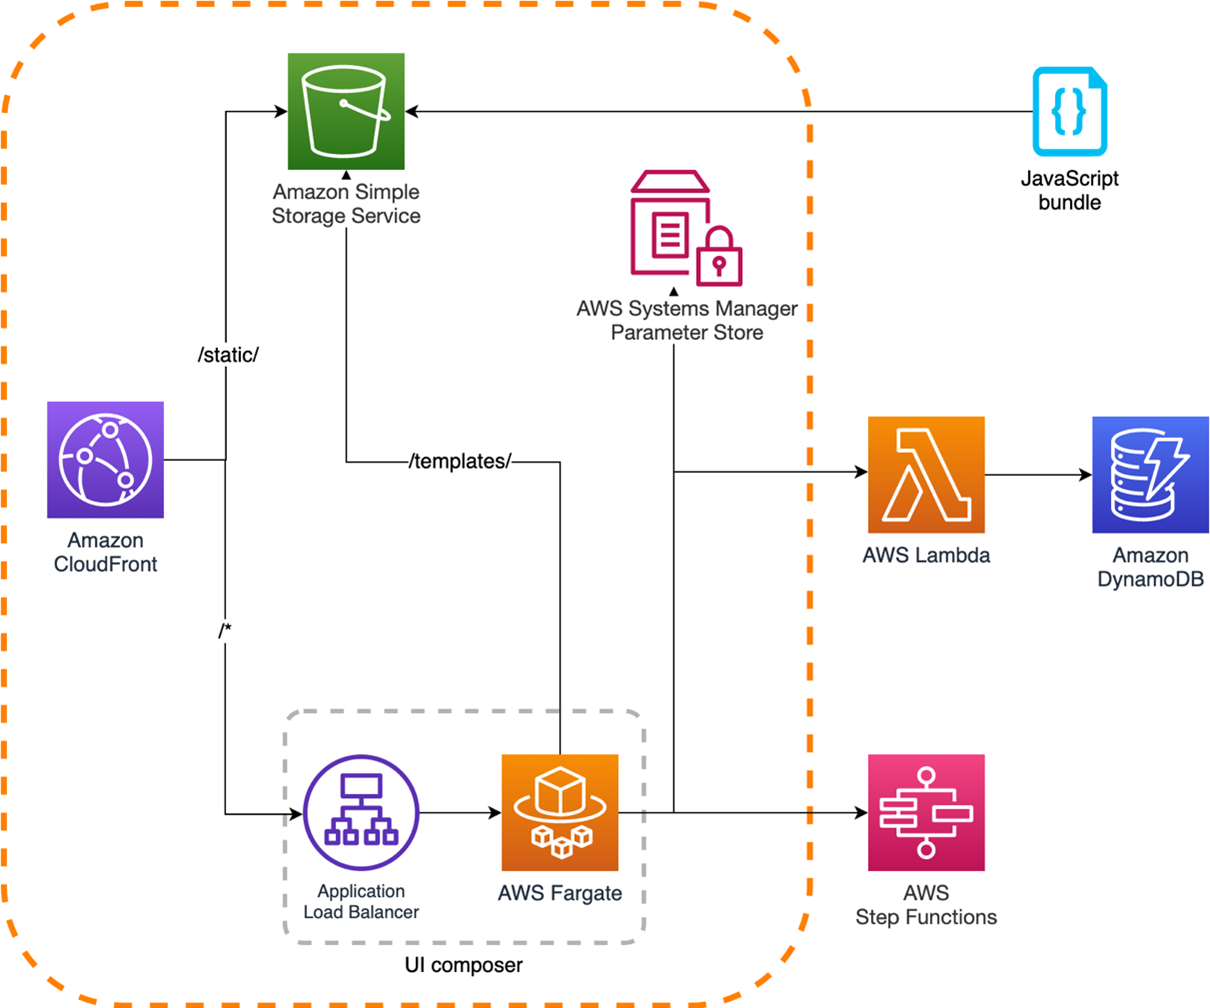
The rest of the series explores the micro-frontends composition, how to design micro-frontends using serverless services, different caching and performance optimization strategies, and the organization structure implications associated with frontend distributed systems.
A user’s request journey
The best way to navigate through this distributed system is by simulating a user request that touches all the parts implemented in the architecture.
The application example shows a product details page of a hypothetical ecommerce platform:

When a user selects an article from the catalog page, the DNS resolves the URL to an Amazon CloudFront distribution that is the reference CDN for this project.
The request is immediately fulfilled if the page is cached. Therefore, no additional logic is requested by the cloud infrastructure and the response is fast (less than the 500 ms shown in this example).
When the page is not available in the CloudFront points of presence (PoPs), the request is forwarded to the Application Load Balancer (ALB). It arrives at the AWS Fargate cluster where the UI Composer generates the page for fulfilling the request.
Using CloudFront in the architecture
CDNs are known for accelerating application delivery thanks to caching static files from nearby PoPs. CloudFront can also accelerate uncacheable content such as dynamic APIs or personalized content.
With a network of over 450 points of presence, CloudFront terminates user TCP/TLS connections within 20-30 milliseconds on average. Traffic to origin servers is carried over the AWS global network instead of the public internet. This infrastructure is a purpose-built, highly available, and low-latency private infrastructure built on a global, fully redundant, metro fiber network that is linked via terrestrial and trans-oceanic cables across the world. In addition to terminating connections close to users, CloudFront accelerates dynamic content thanks to modern internet protocols such as QUIC and TLS1.3, and persisting TCP connections to the origin servers.
CloudFront also has security benefits, offering protection in AWS against infrastructure DDoS attacks. It integrates with AWS Web Application Firewall and AWS Shield Advanced, giving you controls to block application-level DDoS attacks. CloudFront also offers native security controls such as HTTP to HTTPS redirections, CORS management, geo-blocking, tokenization, and managing security response headers.
UI Composer application logic
When the request is not fulfilled by the CloudFront cache, it is routed to the Fargate cluster. Here, multiple tasks compute and serve the page requested.
This example uses Fastify, a fast Node.js framework that is gaining popularity among the Node.js community. When the web server initializes, it loads external parameters and the template for composing a page.
const start = async () => { try { //load parameters MFElist = await init(); //load catalog template catalogTemplate = await loadFromS3(MFElist.template, MFElist.templatesBucket) await fastify.listen({ port: PORT, host: '0.0.0.0' }) } catch (err) { fastify.log.error(err) process.exit(1) }}To maintain team independence and avoid redeploying the UI composer for every application change, the HTML templates are loaded from an S3 bucket. All teams responsible for micro-frontends in the same page can position their micro-frontends into the right place of the HTML template and delegate the composition task to the UI composer.
In this demo, the initial parameters and the catalog template are retrieved once. However, in a real scenario, it’s more likely you retrieve the parameters at initialization and at a regular cadence. The template might be loaded at runtime for every request or have another background routine fetching the initialization parameters in a similar way.
When the request reaches the product details route, the web application logic calls a transformTemplate function. It passes the catalog template, retrieved from the S3 bucket at the server initialization. It returns a 200 response if the page is composed without any issues.
fastify.get('/productdetails', async(request, reply) => { try{ const catalogDetailspage = await transformTemplate(catalogTemplate) responseStream(catalogDetailspage, 200, reply) } catch(err){ console.log(err) throw new Error(err) }})The page composition is the key responsibility of the UI composer. There are several viable approaches for composing micro-frontends in a server-side rendering system, covered in the next post.
Micro-frontends discovery
To decouple workloads for multiple teams, you must use architectural patterns that support it. In a microservices architecture, a pattern that allows independent evolution of a service without coupling the DNS or IP to any microservice is the service discovery pattern.
In this example, AWS System Managers Parameters Store acts as a services registry. Every micro-frontend available in the workload registers itself once the infrastructure is provisioned.
In this way, the UI composer can request the micro-frontend ID found inside the HTML template. It can retrieve the correct way to consume the micro-frontend API using an ARN or a remote HTTP URL, for instance.

Using ARN over HTTP requests inside the workload network can help you to reduce the latency thanks to fewer network hops. Moreover, the security is delegated to IAM policies providing a robust security implementation.
The UI composer takes care to retrieve the micro-frontends endpoints at runtime before loading them into the HTML template. This is a simpler yet powerful approach for maintaining the boundaries within your organization and allowing independent teams to evolve their architecture autonomously.
Micro-frontends discovery evolution
Using Parameter Store as a service discovery system, you can deploy a new micro-frontend by adding a new key-value into the service discovery.
A more sophisticated option could be creating a service that acts as a registry and also shapes the traffic towards different micro-frontends versions using deployment strategies like canary releases or blue/green deployments.
You can start iteratively with a simple key-value store system and evolve the architecture with a more complex approach when the workload requires, providing a robust way to roll out micro-frontends services in your system.
When this is in place, it’s likely to increase the release cadence of your micro-frontends. This is because developers often feel safer releasing in production without affecting the entire user base and they can run tests alongside real traffic.
Performance considerations
This architecture uses Fargate for composing the micro-frontends instead of Lambda functions. This allows incremental rendering offered by browsers, displaying the HTML page partially before it’s completely returned.
Consider a scenario where a micro-frontend takes longer to render due to a downstream dependency or a faulty version deployed into production. Without the streaming capability, you must wait until all the micro-frontends responses arrive, buffer them in memory, compose the page and then send the final output to the browser.
Instead, by using the streaming API offered by Node.js frameworks, you can send a partial HTML page (for example, the head tag and subsequently the rest of the page), to be rendered by a browser.
Streaming also improves server overhead, because the servers don’t have to buffer entire pages. By incrementally flushing data to browsers, servers keep memory pressure low, which lets them process more requests and save overhead costs.
However, in case your workload doesn’t require these capabilities, one or multiple Lambda functions might be suitable for your project as well, reducing the infrastructure management complexity to handle.
Conclusion
This post looks at how to use the UI Composer and micro-frontends discoverability. Once this part is developed, it won’t need to change regularly. This represents the foundation for building server-side rendering micro-frontends using HTML-over-the-wire. There might be other approaches to follow for other frameworks such as Next.js due to the architectural implementation of the framework itself.
The next post will cover how the UI composer includes micro-frontends output inside an HTML template.
For more serverless learning resources, visit Serverless Land.
This blog post is written by Amir Khairalomoum, Senior Solutions Architect.
Modern applications are built with modular architectural patterns, serverless operational models, and agile developer processes. They allow you to innovate faster, reduce risk, accelerate time to market, and decrease your total cost of ownership (TCO). A microservices architecture comprises many distributed parts that can introduce complexity to application observability. Modern observability must respond to this complexity, the increased frequency of software deployments, and the short-lived nature of AWS Lambda execution environments.
The Serverless Applications Lens for the AWS Well-Architected Framework focuses on how to design, deploy, and architect your serverless application workloads in the AWS Cloud. AWS Lambda Powertools for .NET translates some of the best practices defined in the serverless lens into a suite of utilities. You can use these in your application to apply structured logging, distributed tracing, and monitoring of metrics.
Following the community’s continued adoption of AWS Lambda Powertools for Python, Java, and TypeScript, AWS Lambda Powertools for .NET is now generally available.
This post shows how to use the new open source Powertools library to implement observability best practices with minimal coding. It walks through getting started, with the provided examples available in the Powertools GitHub repository.
About Powertools
Powertools for .NET is a suite of utilities that helps with implementing observability best practices without needing to write additional custom code. It currently supports Lambda functions written in C#, with support for runtime versions .NET 6 and newer. Powertools provides three core utilities:
- Tracing provides a simpler way to send traces from functions to AWS X-Ray. It provides visibility into function calls, interactions with other AWS services, or external HTTP requests. You can add attributes to traces to allow filtering based on key information. For example, when using the Tracing attribute, it creates a ColdStart annotation. You can easily group and analyze traces to understand the initialization process.
- Logging provides a custom logger that outputs structured JSON. It allows you to pass in strings or more complex objects, and takes care of serializing the log output. The logger handles common use cases, such as logging the Lambda event payload, and capturing cold start information. This includes appending custom keys to the logger.
- Metrics simplifies collecting custom metrics from your application, without the need to make synchronous requests to external systems. This functionality allows capturing metrics asynchronously using Amazon CloudWatch Embedded Metric Format (EMF) which reduces latency and cost. This provides convenient functionality for common cases, such as validating metrics against CloudWatch EMF specification and tracking cold starts.
Getting started
The following steps explain how to use Powertools to implement structured logging, add custom metrics, and enable tracing with AWS X-Ray. The example application consists of an Amazon API Gateway endpoint, a Lambda function, and an Amazon DynamoDB table. It uses the AWS Serverless Application Model (AWS SAM) to manage the deployment.
When you send a GET request to the API Gateway endpoint, the Lambda function is invoked. This function calls a location API to find the IP address, stores it in the DynamoDB table, and returns it with a greeting message to the client.

Example application
The AWS Lambda Powertools for .NET utilities are available as NuGet packages. Each core utility has a separate NuGet package. It allows you to add only the packages you need. This helps to make the Lambda package size smaller, which can improve the performance.
To implement each of these core utilities in a separate example, use the Globals sections of the AWS SAM template to configure Powertools environment variables and enable active tracing for all Lambda functions and Amazon API Gateway stages.
Sometimes resources that you declare in an AWS SAM template have common configurations. Instead of duplicating this information in every resource, you can declare them once in the Globals section and let your resources inherit them.
Logging
The following steps explain how to implement structured logging in an application. The logging example shows you how to use the logging feature.
To add the Powertools logging library to your project, install the packages from NuGet gallery, from Visual Studio editor, or by using following .NET CLI command:
dotnet add package AWS.Lambda.Powertools.LoggingUse environment variables in the Globals sections of the AWS SAM template to configure the logging library:
Globals: Function: Environment: Variables: POWERTOOLS\_SERVICE\_NAME: powertools-dotnet-logging-sample POWERTOOLS\_LOG\_LEVEL: Debug POWERTOOLS\_LOGGER\_CASE: SnakeCaseDecorate the Lambda function handler method with the Logging attribute in the code. This enables the utility and allows you to use the Logger functionality to output structured logs by passing messages as a string. For example:
Lambda sends the output to Amazon CloudWatch Logs as a JSON-formatted line.
{ "cold\_start": true, "xray\_trace\_id": "1-621b9125-0a3b544c0244dae940ab3405", "function\_name": "powertools-dotnet-tracing-sampl-HelloWorldFunction-v0F2GJwy5r1V", "function\_version": "$LATEST", "function\_memory\_size": 256, "function\_arn": "arn:aws:lambda:eu-west-2:286043031651:function:powertools-dotnet-tracing-sample-HelloWorldFunction-v0F2GJwy5r1V", "function\_request\_id": "3ad9140b-b156-406e-b314-5ac414fecde1", "timestamp": "2022-02-27T14:56:39.2737371Z", "level": "Information", "service": "powertools-dotnet-sample", "name": "AWS.Lambda.Powertools.Logging.Logger", "message": "Getting ip address from external service"}Another common use case, especially when developing new Lambda functions, is to print a log of the event received by the handler. You can achieve this by enabling LogEvent on the Logging attribute. This is disabled by default to prevent potentially leaking sensitive event data into logs.
With logs available as structured JSON, you can perform searches on this structured data using CloudWatch Logs Insights. To search for all logs that were output during a Lambda cold start, and display the key fields in the output, run following query:

CloudWatch Logs Insights query for cold starts
Tracing
Using the Tracing attribute, you can instruct the library to send traces and metadata from the Lambda function invocation to AWS X-Ray using the AWS X-Ray SDK for .NET. The tracing example shows you how to use the tracing feature.
When your application makes calls to AWS services, the SDK tracks downstream calls in subsegments. AWS services that support tracing, and resources that you access within those services, appear as downstream nodes on the service map in the X-Ray console.
You can instrument all of your AWS SDK for .NET clients by calling RegisterXRayForAllServices before you create them.
To add the Powertools tracing library to your project, install the packages from NuGet gallery, from Visual Studio editor, or by using following .NET CLI command:
dotnet add package AWS.Lambda.Powertools.TracingUse environment variables in the Globals sections of the AWS SAM template to configure the tracing library.
Globals: Function: Tracing: Active Environment: Variables: POWERTOOLS\_SERVICE\_NAME: powertools-dotnet-tracing-sample POWERTOOLS\_TRACER\_CAPTURE\_RESPONSE: true POWERTOOLS\_TRACER\_CAPTURE\_ERROR: trueDecorate the Lambda function handler method with the Tracing attribute to enable the utility. To provide more granular details for your traces, you can use the same attribute to capture the invocation of other functions outside of the handler. For example:
Once traffic is flowing, you see a generated service map in the AWS X-Ray console. Decorating the Lambda function handler method, or any other method in the chain with the Tracing attribute, provides an overview of all the traffic flowing through the application.

AWS X-Ray trace service view
You can also view the individual traces that are generated, along with a waterfall view of the segments and subsegments that comprise your trace. This data can help you pinpoint the root cause of slow operations or errors within your application.

AWS X-Ray waterfall trace view
You can also filter traces by annotation and create custom service maps with AWS X-Ray Trace groups. In this example, use the filter expression annotation.ColdStart = true to filter traces based on the ColdStart annotation. The Tracing attribute adds these automatically when used within the handler method.
View trace attributes
Metrics
CloudWatch offers a number of included metrics to help answer general questions about the application’s throughput, error rate, and resource utilization. However, to understand the behavior of the application better, you should also add custom metrics relevant to your workload.
The metrics utility creates custom metrics asynchronously by logging metrics to standard output using the Amazon CloudWatch Embedded Metric Format (EMF).
In the sample application, you want to understand how often your service is calling the location API to identify the IP addresses. The metrics example shows you how to use the metrics feature.
To add the Powertools metrics library to your project, install the packages from the NuGet gallery, from the Visual Studio editor, or by using the following .NET CLI command:
dotnet add package AWS.Lambda.Powertools.MetricsUse environment variables in the Globals sections of the AWS SAM template to configure the metrics library:
Globals: Function: Environment: Variables: POWERTOOLS\_SERVICE\_NAME: powertools-dotnet-metrics-sample POWERTOOLS\_METRICS\_NAMESPACE: AWSLambdaPowertoolsTo create custom metrics, decorate the Lambda function with the Metrics attribute. This ensures that all metrics are properly serialized and flushed to logs when the function finishes its invocation.
You can then emit custom metrics by calling AddMetric or push a single metric with a custom namespace, service and dimensions by calling PushSingleMetric. You can also enable the CaptureColdStart on the attribute to automatically create a cold start metric.
Conclusion
CloudWatch and AWS X-Ray offer functionality that provides comprehensive observability for your applications. Lambda Powertools .NET is now available in preview. The library helps implement observability when running Lambda functions based on .NET 6 while reducing the amount of custom code.
It simplifies implementing the observability best practices defined in the Serverless Applications Lens for the AWS Well-Architected Framework for a serverless application and allows you to focus more time on the business logic.
You can find the full documentation and the source code for Powertools in GitHub. We welcome contributions via pull request, and encourage you to create an issue if you have any feedback for the project. Happy building with AWS Lambda Powertools for .NET.
For more serverless learning resources, visit Serverless Land.
This post is written by Tam Baghdassarian, Cloud Application Architect, Rama Krishna Ramaseshu, Sr Cloud App Architect, and Anand Komandooru, Sr Cloud App Architect.
Web and mobile applications must often upload objects to the AWS Cloud. For example, services such as Amazon Photos allow users to upload photos and large video files from their browser or mobile application.
Amazon S3 can be ideal to store large objects due to its 5-TB object size maximum along with its support for reducing upload times via multipart uploads and transfer acceleration.
Overview
Developers who must upload large files from their web and mobile applications to the cloud can face a number of challenges. Due to underlying TCP throughput limits, a single HTTP connection cannot use the full bandwidth available, resulting in slower upload times. Furthermore, network latency and quality can result in poor or inconsistent user experience.
Using S3 features such as presigned URLs and multipart upload, developers can securely increase throughput and minimize upload retries due to network errors. Additionally, developers can use transfer acceleration to reduce network latency and provide a consistent user experience to their web and mobile app users across the globe.
This post references a sample application consisting of a web frontend and a serverless backend application. It demonstrates the benefits of using S3’s multipart upload and transfer acceleration features.
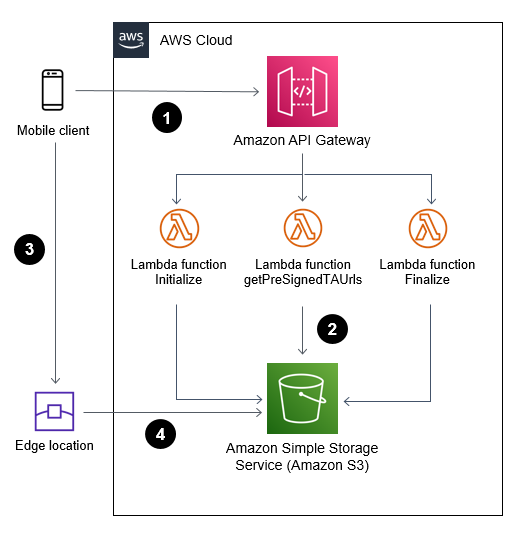
Solution overview:
- Web or mobile application (frontend) communicates with AWS Cloud (backend) through Amazon API Gateway to initiate and complete a multipart upload.
- AWS Lambda functions invoke S3 API calls on behalf of the web or mobile application.
- Web or mobile application uploads large objects to S3 using S3 transfer acceleration and presigned URLs.
- File uploads are received and acknowledged by the closest edge location to reduce latency.
Using S3 multipart upload to upload large objects
A multipart upload allows an application to upload a large object as a set of smaller parts uploaded in parallel. Upon completion, S3 combines the smaller pieces into the original larger object.
Breaking a large object upload into smaller pieces has a number of advantages. It can improve throughput by uploading a number of parts in parallel. It can also recover from a network error more quickly by only restarting the upload for the failed parts.
Multipart upload consists of:
- Initiate the multipart upload and obtain an upload id via the CreateMultipartUpload API call.
- Divide the large object into multiple parts, get a presigned URL for each part, and upload the parts of a large object in parallel via the UploadPart API call.
- Complete the upload by calling the CompleteMultipartUpload API call.
When used with presigned URLs, multipart upload allows an application to upload the large object using a secure, time-limited method without sharing private bucket credentials.
This Lambda function can initiate a multipart upload on behalf of a web or mobile application:
const multipartUpload = await s3. createMultipartUpload(multipartParams).promise()return { statusCode: 200, body: JSON.stringify({ fileId: multipartUpload.UploadId, fileKey: multipartUpload.Key, }), headers: { 'Access-Control-Allow-Origin': '*' }};The UploadId is required for subsequent calls to upload each part and complete the upload.
Uploading objects securely using S3 presigned URLs
A web or mobile application requires write permission to upload objects to a S3 bucket. This is usually accomplished by granting access to the bucket and storing credentials within the application.
You can use presigned URLs to access S3 buckets securely without the need to share or store credentials in the calling application. In addition, presigned URLs are time-limited (the default is 15 minutes) to apply security best practices.
A web application calls an API resource that uses the S3 API calls to generate a time-limited presigned URL. The web application then uses the URL to upload an object to S3 within the allotted time, without having explicit write access to the S3 bucket. Once the presigned URL expires, it can no longer be used.
When combined with multipart upload, a presigned URL can be generated for each of the upload parts, allowing the web or mobile application to upload large objects.
This example demonstrates generating a set of presigned URLs for index number of parts:
const multipartParams = { Bucket: bucket\_name, Key: fileKey, UploadId: fileId, } const promises = [] for (let index = 0; index < parts; index++) { promises.push( s3.getSignedUrlPromise("uploadPart", { ...multipartParams, PartNumber: index + 1, Expires: parseInt(url\_expiration) }), ) } const signedUrls = await Promise.all(promises)Prior to calling getSignedUrlPromise, the client must obtain an UploadId via CreateMultipartUpload. Read Generating a presigned URL to share an object for more information.
Reducing latency by using transfer acceleration
By using S3 transfer acceleration, the application can take advantage of the globally distributed edge locations in Amazon CloudFront. When combined with multipart uploads, each part can be uploaded automatically to the edge location closest to the user, reducing the upload time.
Transfer acceleration must be enabled on the S3 bucket. It can be accessed using the endpoint bucketname.s3-acceleration.amazonaws.com or bucketname.s3-accelerate.dualstack.amazonaws.com to connect to the enabled bucket over IPv6.
Use the speed comparison tool to test the benefits of the transfer acceleration from your location.
You can use transfer acceleration with multipart uploads and presigned URLs to allow a web or mobile application to upload large objects securely and efficiently.
Transfer acceleration needs must be enabled on the S3 bucket. This example creates an S3 bucket with transfer acceleration using CDK and TypeScript:
const s3Bucket = new s3.Bucket(this, "document-upload-bucket", { bucketName: “BUCKET-NAME”, encryption: BucketEncryption.S3\_MANAGED, enforceSSL: true, transferAcceleration: true, removalPolicy: cdk.RemovalPolicy.DESTROY });After activating transfer acceleration on the S3 bucket, the backend application can generate transfer acceleration-enabled presigned URLs. by initializing the S3 SDK:
s3 = new AWS.S3({useAccelerateEndpoint: true});The web or mobile application then use the presigned URLs to upload file parts.
See S3 transfer acceleration for more information.
Deploying the test solution
To set up and run the tests outlined in this blog, you need:
- An AWS account.
- Install and configure AWS CLI.
- Install and bootstrap AWS CDK.
- Deploy the backend and frontend solution at the following git repository.
- A sufficiently large test upload file of at least 100 MB.
To deploy the backend:
- Clone the repository to your local machine.
- From the backendv2 folder, install all dependencies by running:
npm install - Use CDK to deploy the backend to AWS:
cdk deploy --context env="randnumber" --context whitelistip="xx.xx.xxx.xxx"
You can use an additional context variable called “urlExpiry” to set a specific expiration time on the S3 presigned URL. The default value is set at 300 seconds. A new S3 bucket with the name “document-upload-bucket-randnumber” is created for storing the uploaded objects, and the whitelistip value allows API Gateway access from this IP address only.
Note the API Gateway endpoint URL for later.
To deploy the frontend:
- From the frontend folder, install the dependencies:
npm install - To launch the frontend application from the browser, run:
npm run start
Testing the application

To test the application:
- Launch the user interface from the frontend folder:
npm run - Enter the API Gateway address in the API URL textbox.Select the maximum size of each part of the upload (the minimum is 5 MB) and the number of parallel uploads. Use your available bandwidth, TCP window size, and retry time requirements to determine the optimal part size. Web browsers have a limit on the number of concurrent connections to the same server. Specifying a larger number of concurrent connections results in blocking on the web browser side.
- Decide if transfer acceleration should be used to further reduce latency.
- Choose a test upload file.
- Use the Monitor section to observe the total time to upload the test file.
Experiment with different values for part size, number of parallel uploads, use of transfer acceleration and the size of the test file to see the effects on total upload time. You can also use the developer tools for your browser to gain more insights.
Test results
The following tests have the following characteristics:
- The S3 bucket is located in the US East Region.
- The client’s average upload speed is 79 megabits per second.
- The Firefox browser uploaded a file of 485 MB.
Test 1 – Single part upload without transfer acceleration
To create a baseline, the test file is uploaded without transfer acceleration and using only a single part. This simulates a large file upload without the benefits of multipart upload. The baseline result is 72 seconds.

Test 2 – Single upload with transfer acceleration
The next test measured upload time using transfer acceleration while still maintaining a single upload part with no multipart upload benefits. The result is 43 seconds (40% faster).

Test 3 – Multipart upload without transfer acceleration
This test uses multipart upload by splitting the test file into 5-MB parts with a maximum of six parallel uploads. Transfer acceleration is disabled. The result is 45 seconds (38% faster).

Test 4 – Multipart upload with transfer acceleration
For this test, the test file is uploaded by splitting the file into 5-MB parts with a maximum of six parallel uploads. Transfer acceleration is enabled for each upload. The result is 28 seconds (61% faster).

The following chart summarizes the test results.
| Multipart upload | Transfer acceleration | Upload time |
| No | No | 72s |
| Yes | No | 43s |
| No | Yes | 45s |
| Yes | Yes | 28s |
Conclusion
This blog shows how web and mobile applications can upload large objects to Amazon S3 in a secured and efficient manner when using presigned URLs and multipart upload.
Developers can also use transfer acceleration to reduce latency and speed up object uploads. When combined with multipart upload, you can see upload time reduced by up to 61%.
Use the reference implementation to start incorporating multipart upload and S3 transfer acceleration in your web and mobile applications.
For more serverless learning resources, visit Serverless Land.
This blog post is written by Uri Segev, Principal Serverless Specialist Solutions Architect
When developing new applications or modernizing existing ones, you might face a dilemma: which compute technology to use? A serverless compute service such as AWS Lambda or maybe containers? Often, serverless can be the better approach thanks to automatic scaling, built-in high availability, and a pay-for-use billing model. However, you may hesitate to choose serverless for reasons such as:
- Perceived higher cost or difficulty in estimating cost
- It is a paradigm shift, which requires learning to bridge the knowledge gap
- Misconceptions about Lambda capabilities and use cases
- Concern that using Lambda will result in lock-in
- Existing investments in non-serverless platforms and tooling
This blog post suggests best practices for developing portable Lambda functions that allow you to easily port your code to containers if you later choose to. By doing so, you can avoid lock-in and try out the serverless approach in a risk-free way.
Each section of this blog post describes what you need to consider when writing portable code and the steps needed to migrate this code from Lambda to containers, if you later choose to do so.
Best practices for portable Lambda functions
Separate business logic and Lambda handler
Lambda functions are event-driven in nature. When a specific event happens, it invokes the Lambda function by calling its handler method. The handler method receives an event object which contains information regarding the reason for the function invocation. Once the function execution completes, it returns from the handler method. Whatever is returned from the handler is the function’s return value.
To write portable code, we recommend using the handler method only as an interface between the Lambda runtime (event object) and the business logic. Using Hexagonal architecture terminology, the handler should be a driving adapter making calls into the port, which is the interface exposed by the business logic The handler should extract all required information from the event object and then call a separate method that implements the business logic.
When that method returns, the handler constructs the result in the format expected by the function invoker and returns it. We also recommend splitting the handler code and the business logic code into separate files. Should you choose to migrate to containers later, you simply migrate your business logic code files with no additional changes.
The following pseudocode shows a Lambda handler that extracts information from the event object and calls the business logic. Once the business logic is done, the handler places the response in the function’s return value:
The following pseudocode shows the business logic. It’s located in a separate file and is unaware that it is being invoked from a Lambda function. It is pure logic.
This approach also makes it easier to run unit tests on the business logic without the need to construct event objects and to invoke the Lambda handler.
If you migrate to containers later, you include the business logic files in your container with new interface code as described in the following section.
Event source integration
One benefit of Lambda functions is the event source integration. For instance, if you integrate Lambda with Amazon Simple Queue Service (Amazon SQS), the Lambda service will take care of polling the queue, invoking the Lambda function and deleting the messages from the queue when done. By using this integration, you need to write less boilerplate code. You can focus only on implementing business logic and not the integration with the event source.
The following pseudocode shows how the Lambda handler looks like for an SQS event source:
As you can see in the previous code, the Lambda function has almost no knowledge that it is being invoked from SQS. There are no SQS API calls. It only knows the structure of the event object, which is specific to SQS.
When moving to a container, the integration responsibility moves from the Lambda service to you, the developer. There are different event sources in AWS, and each of them will require a different approach for consuming events and invoking business logic. For example, if the event source is Amazon API Gateway, your application will need to create an HTTP server that listens on an HTTP port and waits for incoming requests in order to invoke the business logic.
If the event source is Amazon Kinesis Data Streams, your application will need to run a poller that reads records from the shards, keep track of processed records, handle the case of a change in the number of shards in the stream, retry on errors, and more. Regardless of the event source, if you follow the previous recommendations, you will not need to change anything in the business logic code.
The following pseudocode shows how the integration with SQS will look like in a container. Note that you will lose some features such as batching, filtering, and, of course, automatic scaling.
Another point to consider here is Lambda destinations. If your function is invoked asynchronously and you configured a destination for your function, you will need to include that in the interface code. It will need to catch any business logic error and, based on that, invoke the right destination.
Package functions as containers
Lambda supports packaging functions as .zip files and container images. To develop portable code, we recommend using container images as your default packaging method. Even though you package the function as a container image, you can’t run it on other container platforms such as Amazon Elastic Container Service (Amazon ECS) or Amazon Elastic Kubernetes Service (EKS). However, by packaging it this way, the migration to containers later will be easier as you are already using the same tools and you already created a Dockerfile that will require minimal changes.
An example Dockerfile for Lambda looks like this:
If you move to containers later, you will need to change the Dockerfile to use a different base image and adapt the CMD line that defines how to start the application. This is in addition to the code changes described in the previous section.
The corresponding Dockerfile for the container will look like this:
The deployment pipeline also needs to change as we deploy to a different target. However, building the artifacts remains the same.
Single invocation per instance
Lambda functions run in their own isolated runtime environment. Each environment handles a single request at a time which works great for Lambda. However, if you migrate your application to containers, you will likely invoke the business logic from multiple threads in a single process at the same time.
This section discusses aspects of moving from a single invocation to multiple concurrent invocations within the same process.
Static variables
Static variables are those that are instantiated once and then reused across multiple invocations. Examples of such variables are database connections or configuration information.
For function optimization, and specifically for reducing cold starts and the duration of warm function invocations, we recommend initializing all static variables outside the function handler and storing them in global variables so that further invocations will reuse them.
We recommend using an initialization function that you write as part of the business logic module and that you invoke from outside the handler. This function saves information in global variables that the business logic code reuses across invocations.
The following pseudocode shows the Lambda function:
And the business logic code will look like this:
The same also applies to containers. You will usually initialize static variables when the process starts and not for every single request. When moving to containers, all you need to do is call the initialization function before starting the main application loop.
As you can see, there are no changes in the business logic code.
Database connections
As Lambda functions share nothing between the runtime environments, unlike containers they can’t rely on connection pools when connecting to a relational database. For this reason, we created Amazon RDS Proxy, which acts as a centralized connection pool used by many functions.
To write portable Lambda functions, we recommend using a connection pool object with a single connection. Your business logic code will always ask for a connection from the pool when making a database request. You will still need to use RDS Proxy.
If you later move to containers, you can increase the number of connections in the pool to a larger number with no further changes and the application will scale without overwhelming the database.
File system
Lambda functions come with a writable /tmp folder in the size of 512 MB to 10 GB. As each function instance runs in an isolated runtime environment, developers usually use fixed file names for files stored in that folder. If you run the same business logic code in a container in multiple threads, the different threads will overwrite the files created by others.
We recommended using unique file names in each invocation. Append a UUID or another random number to the file name. Delete the files once you are done with them to avoid running out of space.
If you move your code to containers later, there is nothing to do.
Portable web applications
If you develop a web application, there is another way to achieve portability. You can use the AWS Lambda Web Adapter project to host a web app inside a Lambda function. This way you can develop a web application with familiar frameworks (e.g., Express.js, Next.js, Flask, Spring Boot, Laravel, or anything that uses HTTP 1.1/1.0), and run it on Lambda. If you package your web application as a container, the same Docker image can run on Lambda (using the web adapter) and containers.
Porting from containers to Lambda
This blog post demonstrates how to develop portable Lambda functions you can easily port to containers. Taking these recommendations into consideration can also help develop portable code in general, which allows you to port containers to Lambda functions.
Some things to consider:
- Separate the business logic from the interface code in the container. The interface code should interact with the event sources and invoke the business logic.
- As Lambda functions only have a /tmp writable folder, replicate this in your containers (even though you could write to different locations).
Conclusion
This blog post suggests best practices for developing Lambda functions that allow you to gain the benefits of a serverless approach without risking lock-in.
By following these best practices for separating business logic from Lambda handlers, packaging functions as containers, handling Lambda’s single invocation per instance, and more, you can develop portable Lambda functions. As a consequence, you will be able to port your code from Lambda to containers with minimal effort if you choose to move to containers later.
Refer to these best practices and code samples to ease the adoption of a serverless approach when developing your next application.
For more serverless learning resources, visit Serverless Land.
This blog post is written by Jason Nicholls, Principal Solutions Architect AWS.
In this post we show you how to enable that Windows Defender Credential Guard (Credential Guard) on Amazon Elastic Compute Cloud (Amazon EC2) running Microsoft Windows Server. Credential Guard, when enabled on Amazon EC2 Windows Instances protects sensitive user login information from being extracted from the Operating System (OS) memory.
Microsoft Windows stores credential material such as authentication tokens in the Local Security Authority (LSA), a process in the Microsoft Windows operating system that is responsible for enforcing the security policy of the system. Traditionally these credentials are stored in LSA’s process memory accessible to the rest of the OS, making it possible for a privileged user to extract these credentials. The use of complex passwords, limiting privileged account use, and training users not to use the same password across multiple systems are steps that limit the use of credentials extracted from the LSA, but customers want to isolate these credentials from other rest of the OS.
With Credential Guard enabled, the LSA is isolated by Windows virtualization-based security (VBS). VBS is a suite of Windows security mechanisms that use hardware virtualization features to create an isolated compute environment to store user credentials referred to as the isolated LSA. The isolated LSA is inaccessible to the rest of the OS.
Prerequisites
Credential Guard requires a virtualization technology that supports Virtualization-based Security (VBS) and Unified Extensible Firmware Interface (UEFI) Secure Boot. Optionally, Credential Guard can leverage a Trusted Platform Module (TPM) to further secure credentials. In this walk-through we will use NitroTPM, a virtual TPM 2.0-compliant (ISO/IEC 11889:2015) module for your Amazon EC2 instances to enhance the security of the isolated LSA.
Launch your instance
A list of Windows Amazon Machine Image (AMI)s preconfigured to enable UEFI Secure Boot is available in our “Launch an instance with UEFI Secure Boot support ” guide. You can verify that your AMI supports UEFI Secure Boot and NitroTPM using the AWS Command Line Interface (AWS CLI) describe-images command as follows:
aws ec2 describe-images --image-ids ami-0123456789
When UEFI Secure Boot and NitroTPM are enabled for the AMI, “TpmSupport“: “v2.0“, and “BootMode”: “uefi” appear in the output respectively, such as in the following example.
{ "Images": [ { ... "BootMode": "uefi", "TpmSupport": "v2.0" } ]}Before launching the AMI verify that the instance type you want to launch supports UEFI boot mode and uses the Nitro System by using the DescribeInstanceTypes API call. Using the AWS CLI and calling describe-instance-types as follows:
aws ec2 describe-instance-types --instance-types [INSTANCE\_TYPE] --region [REGION]
Where INSTANCE\_TYPE is a supported instance type as defined in the documentation, an example is c5.large and REGION is a supported AWS Region.
The output of the command should display nitro as the hypervisor and list uefi as a supported boot mode. For example:
{ "InstanceTypes": [ { ... "Hypervisor": "nitro", ... "SupportedBootModes": [ "legacy-bios", "uefi" ] }}Use the Amazon EC2 console or AWS Command Line Interface (AWS CLI) to launch an Amazon EC2 instance which has “uefi” boot mode enabled. Administrator access to the Amazon EC2 instance is required to enable Credential Guard.
Walkthrough:
Enabling Credential Guard with Amazon EC2 Launch an Amazon EC2 Windows Instance
Launch an Amazon EC2 Windows Instance using a Windows AMI preconfigured to enable UEFI Secure Boot with Microsoft Windows Secure Boot Keys on an instance type that supports UEFI Secure Boot.
You can use the launch wizard in the Amazon EC2 console or run-instances command via the AWS CLI to launch an instance that can support Credential Guard. You need a compatible AMI ID for launching your instance which is unique for each AWS Region. You can use the following link to discover and launch instances with compatible Amazon-provided AMIs in the Amazon EC2 console:
Enable Credential Guard on the launched Instance
Now that you know how to create an AMI with UEFI Secure Boot support enabled, let’s create a Windows instance and configure Credential Guard.
Credential Guard can be enabled either by using Group Policies, the Windows Registry, or the Windows Defender Device Guard and Windows Defender Credential Guard hardware readiness tool (DG-Readiness tool). In this post we will show you how to enable Credential Guard using the Windows Registry and via the DG-Readiness tool.
Option 1: Enabling Credential Guard via the Windows Registry
Start the Amazon EC2 instance using an AMI that has the BootMode set to “uefi“. Windows AMI must be preconfigured to enable UEFI Secure Boot with Microsoft Windows Secure Boot keys as we defined earlier. Once you’re connected to the instance use the Windows System Information tool to check that Credential Guard isn’t running on the instance:
- Select Start, type msinfo32.exe, and then select System Information.
- Select System Summary on the left.
- Confirm that Virtualization-based security is Not Enabled.
 Figure 1 Overview of System Information in Windows

Figure 2 System Information confirming that Credential Guard is Not Enabled
4. Open the Windows Command Shell by selecting Start, type cmd.exe, and then press Enter.
5. Run the following commands from the Windows Command Shell to enable Credential Guard using the Windows Registry:
REG ADD "HKLM\System\CurrentControlSet\Control\DeviceGuard" /v EnableVirtualizationBasedSecurity /t REG\_DWORD /d 1 /fREG ADD "HKLM\System\CurrentControlSet\Control\DeviceGuard" /v RequirePlatformSecurityFeatures /t REG\_DWORD /d 1 /fREG ADD "HKLM\System\CurrentControlSet\Control\LSA" /v LsaCfgFlags /t REG\_DWORD /d 2 /fREG ADD "HKLM\SYSTEM\CurrentControlSet\Control\DeviceGuard\Capabilities\" /v "HyperVEnabled" /t REG\_DWORD /d 1 /f
 Figure 3 Update the Windows Registry to enable Credential Guard
6. Once the changes have been made, reboot the instance.
7. When the instance is back up, reconnect to the instance and select Start, type msinfo32.exe, and then select System Information.
8. Select System Summary on the left.
9. Note that Virtualisation-based security is now changed to Running, and that Secure Boot and Credential Guard are enabled.
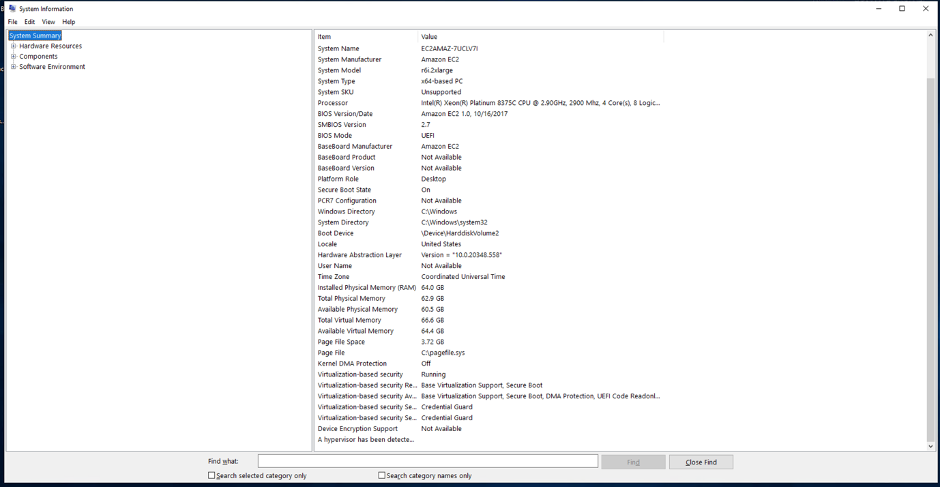 Figure 4 Overview of System Information showing Credential Guard is Enabled
 Figure 5 System Information shows Credential Guard is now Enabled
Option 2: Enabling Credential Guard via the DG-Readiness tool
Option 1 requires a remote desktop session to your Windows Instance. Option 2 is run via PowerShell which can either be done in a remote desktop session as described here or via a remote PowerShell session.
Start the Amazon EC2 instance using an AMI that has the BootMode set to “uefi“. Windows AMI must be preconfigured to enable UEFI Secure Boot with Microsoft Windows Secure Boot keys as we defined earlier. Once you’re connected to the instance start a PowerShell session:
- Select Start, type PowerShell, and then click Windows PowerShell.
 Figure 6 Start PowerShell via the Start Bar
2. Download the DG-Readiness tool by running the command:
wget https://download.microsoft.com/download/B/D/8/BD821B1F-05F2-4A7E-AA03-DF6C4F687B07/dgreadiness\_v3.6.zip -outfile dgreadiness.zip
 Figure 7 Download the DG-Readiness tool
- Uncompress the downloaded zip file using the Expand-Archive function within PowerShell
Expand-Archive -Path C:\Users\Administrator\dgreadiness.zip -DestinationPath C:\dgreadiness
- Move the DG-Readiness tool to the current folder
copy C:\dgreadiness\dgreadiness\_v3.6\DG\_Readiness\_Tool\_v3.6.ps1 .\
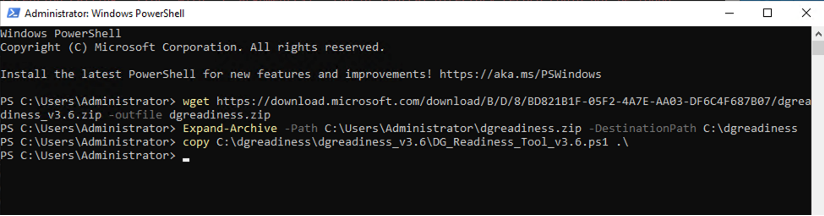 Figure 8 Copy the DG-Readiness tool to the current folder
- Confirm that Credential Guard is disabled by running the DG-Readiness tool with the -Ready option, as follows:
DG\_Readiness\_Tool\_v3.6.ps1 -Ready
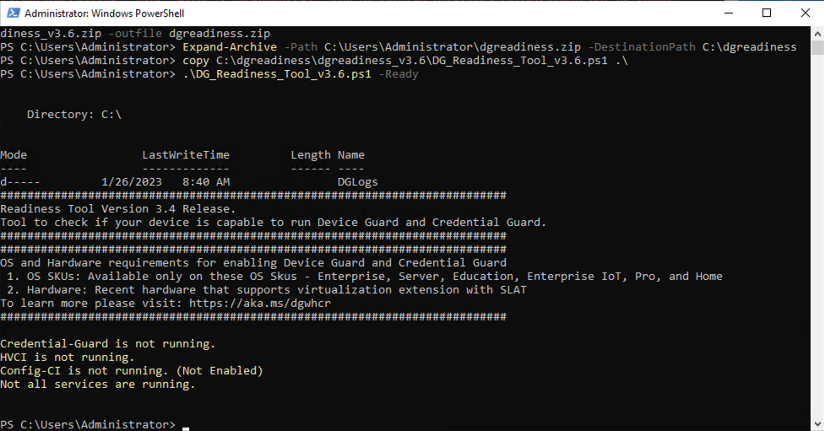 Figure 9 Using the DG-Readiness tool to confirm Credential Guard is not enabled
- Enable Credential Guard using the
-Enable -CGoptions as follows:
DG\_Readiness\_Tool\_v3.6.ps1 -Enable -CG
- Reboot the instance
- Reconnect to the instance after the reboot and confirm that Credential Guard is now running by running the command:
DG\_Readiness\_Tool\_v3.6.ps1 -Ready
 Figure 10 DG Readiness Tool shows Credential Guard is enabled and running
Conclusion
With support for Windows Defender Credential Guard on Amazon EC2 Windows Instances customers can create an isolated compute environment that is inaccessible to the rest of the OS. Credential Guard requires UEFI Secure Boot support. Credential Guard can leverage NitroTPM to further secure credentials.
To learn more about the support of Credential Guard visit documentation.
This blog post is written by Ryan Doty Solutions Architect , AWS and Vishal Manan Sr. SSA, EC2 Graviton , AWS.
Introduction
AWS customers recognize that Graviton-based EC2 instances deliver price-performance benefits but many are concerned about the effort to port existing applications. Porting code from one architecture to another can result in a substantial investment in time and effort. AWS has worked continuously to improve the migration process for customers. We recently introduced the Porting Advisor for Graviton as a tool to further simplify the migration process. In this blog, we’ll walk you through how to use Porting Advisor for Graviton so that you can learn how to use it.
Porting Advisor for Graviton is an open-source, command-line tool that analyzes source code and generates a report highlighting missing or outdated libraries and code constructs that may require modification and provides a user with alternative recommendations. It helps customers and developers accelerate their transition to Graviton-based Amazon EC2 instances by reducing the iterative process of identifying and resolving source code and library dependencies. This blog post will provide you with a step-by-step implementation on how to use Porting Advisor for Graviton. At the end of the blog, you will be able to run Porting Advisor for Graviton on your source code tree, generating findings that will help simplify the effort required to port your application.
Porting Advisor for Graviton scans for potentially unsupported or non-portable arm64 code in source code trees. The tool only scans source code files for the programming languages C/C++, Fortran, Go 1.11+, Java 8+, Python 3+, and dependency files such as project/requirements.txt file(s). Most importantly the Porting Advisor doesn’t make any code modifications, API-level recommendations, or send data back to AWS.
You can utilize Porting Advisor for Graviton either as a Python script or compiled into a binary and run on x86-64 or arm64 systems. Therefore, it can be easily implemented as part of your build processes.
Expected Results
Porting Advisor for Graviton reports the following issues:
- Inline assembly with no corresponding arm64 inline assembly.
- Assembly source files with no corresponding arm64 assembly source files.
- Missing arm64 architecture detection in autoconf config.guess scripts.
- Linking against libraries that aren’t available on the arm64 architecture.
- Use architecture specific intrinsics.
- Preprocessor errors that trigger when compiling on arm64.
- Usages of old Visual C++ runtime (Windows specific).
Compiler specific code guarded by compiler specific pre-defined macros is detected, but not reported by default. The following cross-compile specific issues are detected, but not reported by default:
- Architecture detection that depends on the host rather than the target.
- Use of build artifacts in the build process.
Skillsets needed for using the tool
Porting Advisor for Graviton is designed to be easy to use. Users though should be versed in the following skills in order to take advantage of the recommendations the tool provides:
- An understanding of the build system – project requirements and dependencies, versioning, etc.
- Basic scripting language skills around Python, PowerShell/Bash.
- Understanding hardware (inline assembly for C/C++) or compiler specific (intrinsic for C/C++) constructs when applicable.
- The ability to follow best practices in the AWS Graviton Technical Guide for code optimization.
How to use Porting Advisor for Graviton
Prerequisites
The tool requires a minimum version of Python 3.10 and Java (8+ to be installed). The installation of Java is also optional and only required if you want to scan JAR files for native method calls. You can run the tool on a Windows/Linux/MacOS machine, or in an EC2 instance. I will show case usage on Windows and Amazon Linux 2(AL2) running on an EC2 instance. It supports both arm64 and x86-64 processors.
You don’t need to be on an arm64-based processor to run the tool.

You can run the tool as a Python script or an executable. The executable requires extra steps to build. However, it can be used on another machine without the need to install Python packages.
You must copy the complete “dist” folder for it to work, as there are libraries that are present in that folder along with the executable.
Porting Advisor for Graviton can be run as a binary or as a script. You must run the script to generate the binaries
./porting-advisor-linux-x86\_64 ~/my/path/to/my/repo --output report.html ./porting-advisor-linux-x86\_64.exe ../test/CppCode/inline\_assembly --output report.html
Running Porting Advisor for Graviton as an executable
The first step is to build the executable.
Building the executable
The first step is to set up the Python Environment. If you run into any errors building the binary, see the Troubleshooting section for more details.
Building the binary on Windows


Building the binary on Linux/Mac


Running the binary
Here you can see how you can run the tool on Linux as a binary for a C++ project.

The “dist” folder will have the executable.
Running Porting Advisor for Graviton as a script
Enable the Python environment for the following:
Linux/Mac:
$. python3 -m venv .venv$. source .venv/bin/activate
PowerShell:
PS> python -m venv .venvPS> .\.venv\Scripts\Activate.ps1
The following shows how the tool would work on Windows when run as a script:

Running the Porting Advisor for Graviton on Linux as a Script
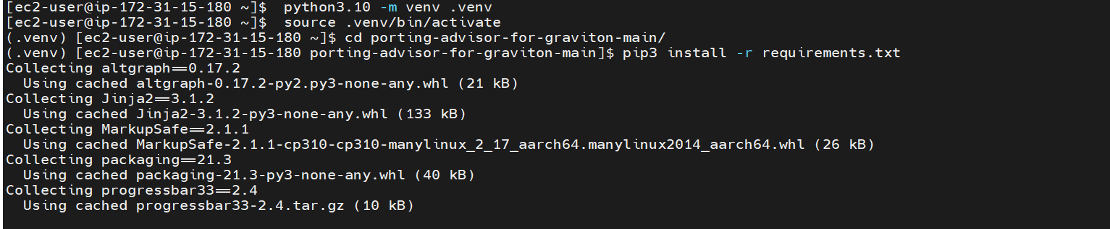

Output of the Porting Advisor for Graviton
The Porting Advisor for Graviton requires the directory parameter to point to the folder where your source code lives. If there are multiple locations, then you can run the tool as part of the script.
If no output file is supplied only standard output will be produced. The following is the output of the tool in HTML format. The first line shows the total files scanned.
- If no issues are found, then you’ll see an output like the following:

- With x86-64 specific intrinsics, such as \_bswap64, you’ll see it flagged. arm64 specific intrinsics won’t be flagged. Therefore, if your code has arm64 specific intrinsics, then the porting advisor will only flag x86-64 to arm64 and not vice versa. The primary goal of the tool is determining the arm64 readiness of your code.

- The scanner typically looks for source code files only, but it can also look for assembly files with *.s extensions. An example of a file with the C++ code with inline assembly code is as follows:
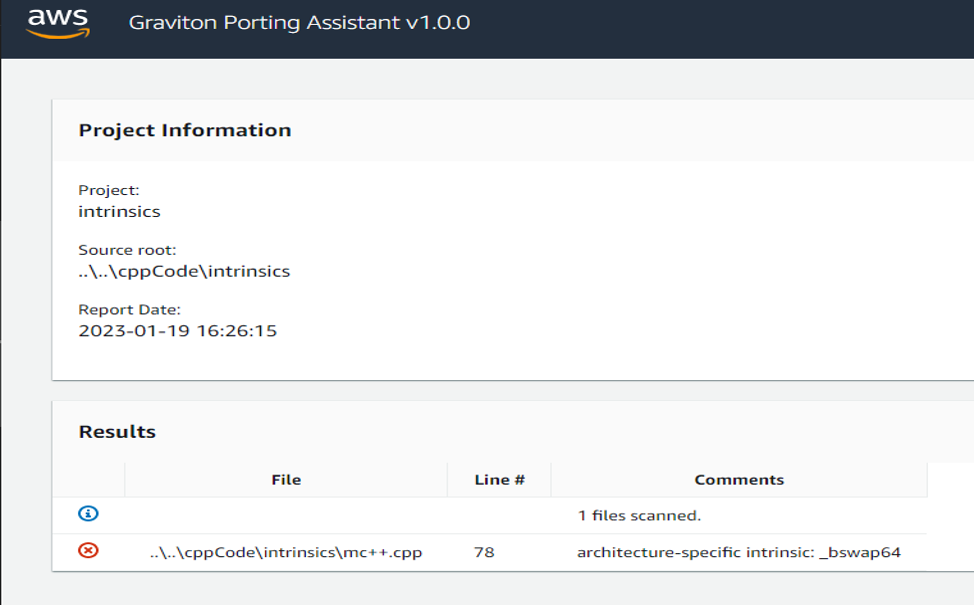
- The tool has pointed out errors such as a preprocessor error and architecture-specific intrinsic usage errors.

Next steps
If you don’t see any issues reported by the tool, then you are in good shape for doing the port. If no issues are reported it does not guarantee that it will work as port. Porting Advisor for Graviton is a tool used best as a helper. Regardless of the issues reported by the tool, we still highly suggest testing the application thoroughly.
As a good practice, we recommend that you use the latest version of your libraries.
Based on the issue, you can consider further actions. For Compiler intrinsic errors, we recommend studying Intel and arm64 intrinsics.
Once you’ve migrated your code and are using Gravition, you can start to look at taking steps to optimize your performance. If you’re interested in doing that please look at our Getting Started Guide.
If you run into any issues, then see our CONTRIBUTING file.
FAQs
- How fast is the tool? The tool is able to scan 4048 files in 1.18 seconds.
On an arm64 Based Instance:

- False Positives?
This tool scans all files in a source tree, regardless of whether they are included by the build system or not. Therefore, it may misreport issues in files that appear in the source tree but are excluded by the build system. Currently, the tool supports the following languages/dependencies: C/C++, Fortran, Go 1.11+, Java 8+, and Python 3+.
For example: You may have legacy code using Python version 2.7 that is in the source tree but isn’t being used. The tool will scan the code base and point out issues in that particular codebase even though you may not be using that piece of code. To mitigate, either remove that folder from the source code or ignore the error pointed by the tool.
- I see mention of Ruby and .Net in the Open source tool, but they don’t work on my tool.
Ruby and .Net haven’t been implemented yet, but please consider contributing to it and open an issue requesting support. If you need support then see our CONTRIBUTING file.
Troubleshooting
Errors that you may encounter while building the tool binary:
PyInstaller needs a shared version of libraries.
- Python 3.10+ not having shared libraries for use by the PyInstaller tool.


The fix for this is to build your version of Python(3.10+) with the right flags:
./configure --enable-optimizations --enable-shared
If the two flags don’t work together, try doing the build with each flag enabled sequentially.

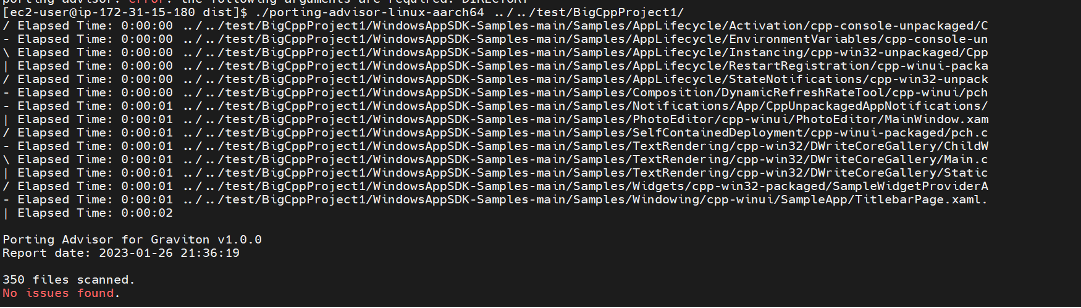
- Incorrect Python version (version less than 3.10).If you aren’t on the correct version of Python:
You will get errors similar to the ones here:

If you want to run the tool in an EC2 instance on Amazon Linux 2(AL2), then you could try upgrading/installing Python 3.10 as pointed out here.
If you run into any issues, then see our CONTRIBUTING file.

If you want to run the tool in an EC2 instance on Amazon Linux 2(AL2), then you could try upgrading/installing Python 3.10 as pointed out here.
If you run into any issues, then see our CONTRIBUTING file.
Conclusion
Porting Advisor for Graviton helps customers quantify the amount of work that is required to port an application. It accelerates your ability to transition to Graviton-based Amazon EC2 instances by reducing the iterative process of identifying and resolving source code and library dependencies.
Resources
To learn how to migrate your workloads to Graviton-based instances, see the AWS Graviton Technical Guide GitHub Repository and AWS Graviton Transition Guide. To get started with Graviton-based Amazon EC2 instances, see the AWS Management Console, AWS Command Line Interface (AWS CLI), and AWS SDKs.
Some other resources include:
- Porting Advisor for Graviton: https://github.com/aws/porting-advisor-for-graviton/
- Graviton Customer Testimonials https://aws.amazon.com/ec2/graviton/customers/
- AWS services supported on Graviton – https://aws.amazon.com/ec2/graviton
- Intrinsics – Arm Developer
- How To Install Python 3.10 on Amazon Linux 2 – TechViewLeo
This blog post is written by Alexey Paramonov, Solutions Architect, ISV and Maximilian Schellhorn, Solutions Architect ISV
This blog post demonstrates a solution based on AWS Step Functions and Amazon API Gateway WebSockets to track execution progress of a long running workflow. The solution updates the frontend regularly and users are able to track the progress and receive detailed status messages.
Websites with long-running processes often don’t provide feedback to users, leading to a poor customer experience. You might have experienced this when booking tickets, searching for hotels, or buying goods online. These sites often call multiple backend and third-party endpoints and aggregate the results to complete your request, causing the delay. In these long running scenarios, a transparent progress tracking solution can create a better user experience.
Overview
The example provided uses:
- AWS Serverless Application Model (AWS SAM) for deployment: an open-source framework for building serverless applications.
- AWS Step Functions for orchestrating the workflow.
- AWS Lambda for mocking long running processes.
- API Gateway to provide a WebSocket API for bidirectional communications between clients and the backend.
- Amazon DynamoDB for storing connection IDs from the clients.
The example provides different options to report the progress back to the WebSocket connection by using Step Functions SDK integration, Lambda integrations, or Amazon EventBridge.
The following diagram outlines the example:

- The user opens a connection to WebSocket API. The OnConnect and OnDisconnect Lambda functions in the “WebSocket Connection Management” section persist this connection in DynamoDB (see documentation). The connection is bidirectional, meaning that the user can send requests through the open connection and the backend can respond with a new progress status whenever it is available.
- The user sends a new order through the WebSocket API. API Gateway routes the request to the “OnOrder” AWS Lambda function, which starts the state machine execution.
- As the request propagates through the state machine, we send progress updates back to the user via the WebSocket API using AWS SDK service integrations.
- For more customized status responses, we can use a centralized AWS Lambda function “ReportProgress” that updates the WebSocket API.
How to respond to the client?
To send the status updates back to the client via the WebSocket API, three options are explored:
Option 1: AWS SDK integration with API Gateway invocation
As the diagram shows, the API Gateway workflow tasks starting with the prefix “Report:” send responses directly to the client via the WebSocket API. This is an example of the state machine definition for this step:
'Report: Workflow started': Type: Task Resource: arn:aws:states:::apigateway:invoke ResultPath: $.Params Parameters: ApiEndpoint: !Join [ '.',[ !Ref ProgressTrackingWebsocket, execute-api, !Ref 'AWS::Region', amazonaws.com ] ] Method: POST Stage: !Ref ApiStageName Path.$: States.Format('/@connections/{}', $.ConnectionId) RequestBody: Message: 🥁 Workflow started Progress: 10 AuthType: IAM\_ROLE Next: 'Mock: Inventory check'This option reports the progress directly without using any additional Lambda functions. This limits the system complexity, reduces latency between the progress update and the response delivered to the client, and potentially reduces costs by reducing Lambda execution duration. A potential drawback is the limited customization of the response and getting familiar with the definition language.
Option 2: Using a Lambda function for reporting the progress status
To further customize response logic, create a Lambda function for reporting. As shown in point 4 of the diagram, you can also invoke a “ReportProgress” function directly from the state machine. This Python code snippet reports the progress status back to the WebSocket API:
apigw\_management\_api\_client = boto3.client('apigatewaymanagementapi', endpoint\_url=api\_url)apigw\_management\_api\_client.post\_to\_connection( ConnectionId=connection\_id, Data=bytes(json.dumps(event), 'utf-8') )This option allows for more customizations and integration into the business logic of other Lambda functions to track progress in more detail. For example, execution of loops and reporting back on every iteration. The tradeoff is that you must handle exceptions and retries in your code. It also increases overall system complexity and additional costs associated with Lambda execution.
Option 3: Using EventBridge
You can combine option 2 with EventBridge to provide a centralized solution for reporting the progress status. The solution also handles retries with back-off if the “ReportProgress” function can’t communicate with the WebSocket API.
You can also use AWS SDK integrations from the state machine to EventBridge instead of using API Gateway. This has the additional benefit of a loosely coupled and resilient system but you could experience increased latency due to the additional services used. The combination of EventBridge and the Lambda function adds a minimal latency, but it might not be acceptable for short-lived workflows. However, if the workflow takes tens of seconds to complete and involves numerous steps, option 3 may be more suitable.
This is the architecture:

- As before.
- As before.
- AWS SDK integration sends the status message to EventBridge.
- The message propagates to the “ReportProgress” Lambda function.
- The Lambda function sends the processed message through the WebSocket API back to the client.
Deploying the example
Prerequisites
Make sure you can manage AWS resources from your terminal.
- AWS CLI and AWS SAM CLI installed.
- You have an AWS account. If not, visit this page.
- Your user has sufficient permissions to manage AWS resources.
- Git is installed.
- NPM is installed (only for local frontend deployment).
To view the source code and documentation, visit the GitHub repo. This contains both the frontend and backend code.
To deploy:
- Clone the repository:
git clone "https://github.com/aws-samples/aws-step-functions-progress-tracking.git" - Navigate to the root of the repository.
- Build and deploy the AWS SAM template:
sam build && sam deploy --guided - Copy the value of WebSocketURL in the output for later.
- The backend is now running. To test it, use a hosted frontend.
Alternatively, you can deploy the React-based frontend on your local machine:
- Navigate to “progress-tracker-frontend/”:
cd progress-tracker-frontend - Launch the react app:
npm start - The command opens the React app in your default browser. If it does not happen automatically, navigate to http://localhost:3000/ manually.
Now the application is ready to test.
Testing the example application
- The webpage requests a WebSocket URL – this is the value from the AWS SAM template deployment. Paste it into Enter WebSocket URL in the browser and choose Connect.

- On the next page, choose Send Order and watch how the progress changes.

This sends the new order request to the state machine. As it progresses, you receive status messages back through the WebSocket API. - Optionally, you can inspect the raw messages arriving to the client. Open the Developer tools in your browser and navigate to the Network tab. Filter for WS (stands for WebSocket) and refresh the page. Specify the WebSocket URL, choose Connect and then choose Send Order.

Cleaning up
The services used in this solution are eligible for AWS Free Tier. To clean up the resources, in the root directory of the repository run:
sam deleteThis removes all resources provisioned by the template.yml file.
Conclusion
In this post, you learn how to augment your Step Functions workflows with low latency progress tracking via API Gateway WebSockets. Consider adding the progress tracking to your long running workflows to improve the customer experience and provide a reactive look and feel for your application.
Navigate to the GitHub repository and review the implementation to see how your solution could become more user friendly and responsive. Start with examining the template.yml and the state machine’s definition and see how the frontend handles WebSocket communication and message visualization.
For more serverless learning resources, visit Serverless Land.
This post is written by Yashlin Naidoo, Cloud Support Engineer.
Amazon Simple Notification Service (Amazon SNS) enables you to send notifications directly to a mobile push endpoint. For iOS apps, Amazon SNS dispatches the notification on your application’s behalf to the Apple Push Notification service (APNs).
To send mobile push notifications via Amazon SNS, you must provide a set of credentials to connect to the APNs (see Prerequisites for Amazon SNS user notifications).
Amazon SNS supports two methods for authenticating with iOS mobile push endpoints when sending a mobile push notification via the APNs:
- Certificate-based authentication
- Token-based authentication
To use certificate-based authentication, you must configure Amazon SNS with a provider certificate. Amazon SNS will use this certificate on your behalf to establish a secure connection with the APNs to dispatch your mobile push notifications. For each application that you support, you will need to provide unique certificates.
As the number of applications you manage grows, you will also need to create and manage an increasing number of certificates. Furthermore, certificates expire yearly, and you must renew them to ensure that Amazon SNS can continue to send mobile push notifications on your behalf. To learn more about how to use certificate-based authentication, see Certificate-based authentication for iOS applications with Amazon SNS on the AWS Compute Blog.
For new and existing iOS applications, we recommend that you use token-based authentication. To learn more about how to use token-based authentication, see Token-Based authentication for iOS applications with Amazon SNS on the AWS Compute Blog.
There are several benefits in using token-based authentication:
- You can use a single token that is shared among all of your applications.
- You can remove the need for yearly certificate renewal for certificate-based authentication.
- You can improve the security of your application by using token-based requests. For these requests, your credentials are never transferred from Amazon SNS to your mobile push notification provider, making the communication less likely to be compromised.
Token-based authentication is the latest authentication method provided by the APNs that improves security for your applications, requires less management effort, and is more efficient. We recommend migrating as soon as possible to ensure the security and ease of operations of your applications.
This blog post provides step-by-step instructions for migrating your iOS application from certificate-based authentication to token-based authentication with Amazon SNS. You will learn how to create a new token using your Apple developer account. Next, you will migrate your platform application to token-based authentication. Finally, you will test your application by sending a test push notification via Amazon SNS to a device to confirm the successful migration.
Prerequisites
- XCode IDE
- iOS application with a valid p.12 certificate
Before proceeding with this migration, we recommend to stop sending push notifications to your applications until the migration is complete to avoid any disruptions in your message delivery workloads.
Walkthrough
You can also create a test platform application with token-based authentication to ensure that the Amazon SNS platform application is created successfully. Finally, you can create a device token and send a test push notification to it. Once confirmed that the application works correctly, you can migrate your main platform application to token-based authentication.
Creating a .p8 token to upload to Amazon SNS
- Log in to your Apple Developer account.
- Choose Certificates, Identifiers & Profiles.
- In the Keys section, choose the Add button (+).
- Under Register a New Key, for Key Name, type the token key name and tick the box for Apple Push Notifications service (APNs) for the key services.
- Select Continue.
- In the Register a New Key section, check that all values were entered correctly.
- Select Register to register the new token key.
- Download your token key. Store it in a safe location, as you can’t download the token key again.
Migrating your platform application from certificate-based authentication to token-based authentication
- Navigate to the Amazon SNS console. Expand the Mobile menu and choose Push Notification.
- Choose your platform application.
- Choose Edit. Under Apple credentials section choose Token:
- Under Token, select Choose file to upload the .p8 token key file.
- Provide values for signing key ID, team ID and bundle ID. These values can be found in your Apple Developer account. Ensure that your bundle ID is identical to the ID used for this application with certificate-based authentication.
- Event notifications – optional: refer to the following guide for enabling event notifications: Mobile app events
- Delivery status logging – optional: refer to the following guide for enabling delivery status logging: How do I access Amazon SNS topic delivery logs for push notifications? Find more information on these steps can in the Mobile push notifications best practices.

- Choose Save changes. This changes your platform application to token-based authentication.
Testing push notification delivery to your device
In this section, you will test sending a push notification to your device using the Amazon SNS console and the AWS Command Line Interface (AWS CLI).
Amazon SNS console
- From the Amazon SNS console, navigate to your platform endpoint and choose Publish message.
- For message body, select Custom payload for each delivery protocol to send to the endpoint. This example uses a custom payload that allows you to provide additional APNs headers:

- Choose Publish message.
- The push notification is delivered to your device:

AWS CLI
Note: If you receive errors when running AWS CLI commands, make sure that you’re using the most recent AWS CLI version.
Run the following command. For target-arn, specify your platform application endpoint ARN:
aws sns publish \ --target-arn arn:aws:sns:us-west-2:123456789123:endpoint/APNS\_SANDBOX/computeblogdemo/ba7a35f8-c73d-364f-9edd-5c438add0533 \ --message '{"APNS\_SANDBOX": "{\"aps\":{\"alert\":\"Sample message for iOS development endpoints\"}}"}' \ --message-attributes '{"AWS.SNS.MOBILE.APNS.PUSH\_TYPE":{"DataType":"String","StringValue":"alert"}}' \ --message-structure json- An output containing a
MessageIdis shown in case of successful delivery:{ "MessageId": "83ecb3a1-c728-5b7c-96e5-e8417d5cd4f4"} - The push notification is delivered to your device:
Troubleshooting
You might encounter various errors when migrating to token-based authentication. This section explains how to troubleshoot these errors.
If a message is not delivered after publishing it to your platform application endpoint, refer to the Amazon CloudWatch failed logs of your platform application. These logs are named sns/your-aws-region/your-accountID/app/platform\_name/application\_name/Failure.
Once you have navigated to your platform application’s CloudWatch failed log group, click on one of the log streams based on the time that you published the message. Focus on the following attributes:
statusCode: error messages are grouped according to the status code.status: shows whether a message was delivered successfully to the provider or if it failed to deliver.providerResponse: provides the response message from the provider and is only shown in case a message failed to deliver.
We will look through messages that failed to deliver because of the following errors:
InvalidProviderToken
The cause of this error can be an incorrect token key ID, team ID or if the token is invalid.
To resolve this issue, go to your Apple Developer account and ensure that you are providing the correct token ID, team ID and that your token key exists.
TopicDisallowed
The cause of this error can be an incorrect bundle ID or a device token that was created with the wrong bundle ID.
To resolve this issue, go to your Apple Developer account and navigate to your existing certificate used when migrating to token-based authentication. Confirm the bundle ID assigned to this certificate and ensure you are using the same ID for your platform application and also for your device tokens.
Conclusion
Developers can send mobile push notifications for the APNs using token-based authentication by using a .p8 key to authenticate an Apple device endpoint. This is the recommended authentication method due to improved security and lower management effort by removing the need for annual certificate renewal and by being able to share tokens among multiple applications.
To learn more about APNs token-based authentication with Amazon SNS, visit the Amazon SNS Developer Guide.
For more serverless learning resources, visit Serverless Land.
This blog post is written by Gaurav Verma, Cloud Infrastructure Architect, Professional Services AWS.
Amazon EC2 Auto Scaling helps you maintain application availability and lets you automatically add or remove Amazon Elastic Compute Cloud (Amazon EC2) instances according to the conditions that you define. You can use dynamic and predictive scaling to scale-out and scale-in EC2 instances. Auto Scaling helps to maintain the self-healing Amazon EC2 environment for an application where Auto Scaling can use the status of Amazon EC2 health checks to determine if an instance is faulty and needs replacement. Amazon EC2 Auto Scaling provides three types of health checks, which are discussed below.
EC2 Status check: AWS provides two types of health checks for EC2 instances: System status check and instance status check. System status checks monitor the AWS system on which an instance is running. If the problem is with underlying system, AWS will fix the problem. Instance status check monitors the software and network configuration of an instance. If the instance status check fails, then you can fix the problem by following the steps in the troubleshoot instances with failed status checks documentation.
Elastic Load Balancer Health Check: Auto Scaling groups are generally connected to Elastic Load Balancers (ELB). ELB provides the application-level health check by monitoring the endpoint (a webpage, or a health page in a web application) of an application. ELB health check monitors the application and marks the instance unhealthy if there is no response from an instance in the configured time.
Custom Health Check: You can use custom health checks to mark any instance as unhealthy if the instance fails for the check you define. Custom health checks can be used to implement various user requirements, such as the presence of instance tags added upon completion of a required workflow. The user data script is executed at instance boot time, and it can perform additional investigation into whether or not the user requirements are met before confirming that the instance is ready to accept load. For example, this approach could be used to confirm that the instance was successfully integrated with other parts of a complex application stack.
In some cases, a customer may add multiple checks either in the Amazon EC2 AMI or in the boot sequence to keep the instance secure and compliant. These checks can increase the boot time for the EC2 instance, and they can reboot the EC2 instance multiple times before an instance can be marked as compliant. Therefore, in some cases, an EC2 instance boot period can take forty to fifty minutes or longer.
If an EC2 instance isn’t marked as healthy within a defined time, Auto Scaling will mark an instance unhealthy, even though the instance wasn’t yet ready for evaluation. Custom health checks can help manage these situations. You can write the Amazon EC2 user data script to perform the custom health check and force Auto Scaling to wait until the instance is truly healthy (i.e., functional, secure, and compliant).
This blog describes a method to write a custom health check. We write an Amazon EC2 user data script to perform the custom health check and automate it for future EC2 instances in the Auto Scaling group. This script can wait for an instance to successfully complete the boot process and then mark the instance as healthy.
Prerequisites
You must have an AWS Identity and Access Management (IAM) role for Amazon EC2 with an Auto Scaling policy, which has these two actions allowed for the Auto Scaling group:
autoscaling:CompleteLifecycleAction
autoscaling:RecordLifecycleActionHeartbeat
Furthermore, we use the Amazon EC2 Auto Scaling lifecycle hooks. Lifecycle hooks let you create a solutions that are aware of events in Auto Scaling instance lifecycle, and then perform a custom action on instances when the lifecycle event occurs. As mentioned previously, typically a custom health check is needed when determining the workload readiness of an instance would be longer than the usual boot time for an EC2 instance that Auto Scaling assumes. Therefore, we utilize lifecycle hooks to keep the checks running until the instance is marked healthy.
Create custom health check
Let’s look at an example where an instance can only be marked as healthy if the instance has a tag with the key “Compliance-Check” and value “Successful”. Until this tag is both (a) present and (b) carries the value “Successful”, the instance shouldn’t be marked as “InService”.
- Create the Auto Scaling launch template for Amazon EC2 Auto Scaling. Name your Launch template “test”. In the additional configuration for user data, use this shell script as text.
The Following script will install the AWS Command Line Interface (AWS CLI) to interact with the AWS tagging and Auto Scaling APIs. Then, the script will run the while loop until the instance has a tag with the key “Compliance-Check” and value “Successful”. Once the instance has a tag, it will mark the instance as healthy and the instance will move into the “InService” state.
#!/bin/bashcurl "https://awscli.amazonaws.com/awscli-exe-linux-x86\_64.zip" -o "awscliv2.zip"unzip awscliv2.zipsudo ./aws/install#get instance idinstance=$(curl http://169.254.169.254/latest/meta-data/instance-id)#Checking instance statuswhile truedoreadystatus=$(aws ec2 describe-instances --instance-ids $instance --filters "Name=tag: Compliance-Check,Values= Successful" |grep -i $instance)if [[ $readystatus = *"InstanceId"* ]]; then echo $readystatus >> /home/ec2-user/user-script-output.txt aws autoscaling set-instance-health --instance-id $instance --health-status Healthy aws autoscaling complete-lifecycle-action --lifecycle-action-result CONTINUE --instance-id $instance --lifecycle-hook-name test --auto-scaling-group-name my-asg break elseaws autoscaling set-instance-health --instance-id $instance --health-status Unhealthysleep 5 fidone- Create an Amazon EC2 Auto Scaling group using the AWS CLI with the “test” launch template that you just created and a predefined lifecycle hook. First, create a JSON file “config.json” in a system where you will run the AWS command to create the Auto Scaling group.
{ "AutoScalingGroupName": "my-asg", "LaunchTemplate": {"LaunchTemplateId": "lt-1234567890abcde12"} , "MinSize": 2, "MaxSize": 4, "DesiredCapacity": 2, "VPCZoneIdentifier": "subnet-12345678, subnet-90123456", "NewInstancesProtectedFromScaleIn": true, "LifecycleHookSpecificationList": [ { "LifecycleHookName": "test", "LifecycleTransition": "autoscaling:EC2\_INSTANCE\_LAUNCHING", "HeartbeatTimeout": 300, "DefaultResult": "ABANDON" } ], "Tags": [ { "ResourceId": "my-asg", "ResourceType": "auto-scaling-group", "Key": "Compliance-Check", "Value": "UnSuccessful", "PropagateAtLaunch": true } ]}To create the Auto Scaling group with the AWS CLI, you must run the following command at the same location where you saved the preceding JSON file. Make sure to replace the relevant subnets that you intend to use in the VPCZoneIdentifier.
>> aws autoscaling create-auto-scaling-group –cli-input-json file://config.json
This command will create the Auto Scaling group with a configuration defined in the JSON file. This Auto Scaling group should have two instances and a lifecycle hook called “test” with a 300 second wait period at the time of launch of an instance.
Tests
Now is the time to test the newly-created instances with a custom health check. Instances in Auto Scaling should be in the “Pending:Wait” stage, not the “InService” stage. Instances will be in this stage for approximately five minutes because we have a lifecycle hook time of 300 seconds in the config.json file.
If the workload readiness evaluation takes more than 300 seconds in your environment, then you can increase the lifecycle hook period to as long as 7200 seconds.
Change the tag value for one instance from “UnSuccessful” to “Successful”. If you’ve changed the tag within the five minutes of instances creation, then the instance should be in the “InService” state and marked as healthy.

This test is a simulation of the situation where the health check of an instance depends on the tag values, and the tag values are only updated if the instance passes all of the checks as per the organization standards. Here we change the tag value manually, but in a real use case scenario, this value would be changed by the booting process when instances are marked as compliant.
Another test case could be that an instance should be marked as healthy if it’s added to the configuration management database, but not before that. For these checks, you can use the API with the curl command and look for the desired result. An example to call an API is in the above script, where it calls the AWS API to get the instance ID.
In case your custom health check script needs more than 7200 seconds, you can use this command to increase the lifecycle hook time:
>> aws autoscaling record-lifecycle-action-heartbeat –lifecycle-hook-name <lh\_
name> –auto-scaling-group-name <asg\_name> –instance-id <instance\_id>
This command will give you the extra time equal to the time that you have configured in the life cycle hook.
Cleanup
Once you successfully test the solution, to avoid ongoing charges for resources you created, you should delete the resources.
To delete the Amazon EC2 Auto Scaling group, run the following command:
aws autoscaling delete-auto-scaling-group --auto-scaling-group-name my-asg
To delete the launch template, run the following command:
aws ec2 delete-launch-template --launch-template-id lt-1234567890abcde12
Delete the role and policy as well if you no longer need it.
Conclusion
EC2 Auto Scaling custom health checks are useful when system or instance health is insufficient, and you want instances to be marked as healthy only after additional checks. Typically, because of these different checks, the Amazon EC2 boot period can be longer than usual, and this may impact the scale-out process when an application needs more resources.
You can start by exploring EC2 Auto Scaling warm pools for these environments. You can keep the healthy marked instances in the warm pool in the Stopped stage. Then, these instances can be brought into the main pool at the time of scale-out without spending time on the boot process and lengthy health check. If you enable scale-in protection, then these healthy instances can move back to the warm pool at the time of scale-in rather than being terminated altogether.
This blog post is written by Wassim Benhallam, Sr Cloud Application Architect AWS WWCO ProServe, and Rajesh Kesaraju, Sr. Specialist Solution Architect, EC2 Flexible Compute.
Scaling an Amazon EC2 Auto Scaling group based on Amazon Simple Queue Service (Amazon SQS) is a commonly used design pattern in decoupled applications. For example, an EC2 Auto Scaling Group can be used as a worker tier to offload the processing of audio files, images, or other files sent to the queue from an upstream tier (e.g., web tier). For latency-sensitive applications, AWS guidance describes a common pattern that allows an Auto Scaling group to scale in response to the backlog of an Amazon SQS queue while accounting for the average message processing duration (MPD) and the application’s desired latency.
This post builds on that guidance to focus on latency-sensitive applications where the MPD varies over time. Specifically, we demonstrate how to dynamically update the target value of the Auto Scaling group’s target tracking policy based on observed changes in the MPD. We also cover the utilization of Amazon EC2 Spot instances, mixed instance policies, and attribute-based instance selection in the Auto Scaling Groups as well as best practice implementation to achieve greater cost savings.
The challenge
The key challenge that this post addresses is applications that fail to honor their acceptable/target latency in situations where the MPD varies over time. Latency refers here to the time required for any queue message to be consumed and fully processed.
Consider the example of a customer using a worker tier to process image files (e.g., resizing, rescaling, or transformation) uploaded by users within a target latency of 100 seconds. The worker tier consists of an Auto Scaling group configured with a target tracking policy. To achieve the target latency mentioned previously, the customer assumes that each image can be processed in one second, and configures the target value of the scaling policy so that the average image backlog per instance is maintained at approximately 100 images.
In the first week, the customer submits 1000 images to the Amazon SQS queue for processing, each of which takes one second of processing time. Therefore, the Auto Scaling group scales to 10 instances, each of which processes 100 images in 100s, thereby honoring the target latency of 100s.
In the second week, the customer submits 1000 slightly larger images for processing. Since an image’s processing duration scales with its size, each image takes two seconds to process. As in the first week, the Auto Scaling group scales to 10 instances, but this time each instance processes 100 images in 200s, which is twice as long as was needed in the first round. As a result, the application fails to process the latter images within its acceptable latency.
Therefore, the challenge is common to any latency-sensitive application where the MPD is subject to change. Applications where the processing duration scales with input data size are particularly vulnerable to this problem. This includes image processing, document processing, computational jobs, and others.
Solution overview
Before we dive into the solution, let’s briefly review the target tracking policy’s scaling metric and its corresponding target value. A target tracking scaling policy works by adjusting the capacity to keep a scaling metric at, or close to, the specified target value. When scaling in response to an Amazon SQS backlog, it’s good practice to use a scaling metric known as the Backlog Per Instance (BPI) and a target value based on the acceptable BPI. These are computed as follows:

Given the acceptable BPI equation, a longer MPD requires us to use a smaller target value if we are to process these messages in the same acceptable latency, and vice versa. Therefore, the solution we propose here works by monitoring the average MPD over time and dynamically adjusting the target value of the Auto Scaling group’s target tracking policy (acceptable BPI) based on the observed changes in the MPD. This allows the scaling policy to adapt to variations in the average MPD over time, and thus enables the application to honor its acceptable latency.
Solution architecture
To demonstrate how the approach above can be implemented in practice, we put together an example architecture highlighting the services involved (see the following figure). We also provide an automated deployment solution for this architecture using an AWS Serverless Application Model (AWS SAM) template and some Python code (repository link). The repository also includes a README file with detailed instructions that you can follow to deploy the solution. The AWS SAM template deploys several resources, including an autoscaling group, launch template, target tracking scaling policy, an Amazon SQS queue, and a few AWS Lambda functions that serve various functions described as follows.
The Amazon SQS queue is used to accumulate messages intended for processing, while the Auto Scaling group instances are responsible for polling the queue and processing any messages received. To do this, a launch template defines a bootstrap script that allows the group’s instances to download and execute a Python code when first launched. The Python code consumes messages from the Amazon SQS queue and simulates their processing by sleeping for the MPD duration specified in the message body. After processing each message, the instance publishes the MPD as an Amazon CloudWatch metric (see the following figure).

Figure 1: Architecture diagram showing the components deployed by the AWS SAM template.
To enable scaling, the Auto Scaling group is configured with a target tracking scaling policy that specifies BPI as the scaling metric and with an initial target value provided by the user.
The BPI CloudWatch metric is calculated and published by the “Metric-Publisher” Lambda function which is invoked every one minute using an Amazon EventBridge rate expression. To calculate BPI, the Lambda function simply takes the ratio of the number of messages visible in the Amazon SQS queue by the total number of in-service instances in the Auto Scaling group, as shown in equation (2) above.
On the other hand, the scaling policy’s target value is updated by the “Target-Setter” Lambda function, which is invoked every 30 minutes using another EventBridge rate expression. To calculate the new target value, the Lambda function simply takes the ratio of the user-defined acceptable latency value by the current average MPD queried from the corresponding CloudWatch metric, as shown in the previous equation (1).
Finally, to help you quickly test this solution, a Lambda function “Testing Lambda” is also provided and can be used to send messages to the Amazon SQS queue with a processing duration of your choice. This is specified within each message’s body. You can invoke this Lambda function with different MPDs (by modifying the corresponding environment variable) to verify how the Auto Scaling group scales in response. A CloudWatch dashboard is also deployed to enable you to track key scaling metrics through time. These include the number of messages visible in the queue, the number of in-service instances in the Auto Scaling group, the MPD, and BPI vs acceptable BPI.
Solution testing
To demonstrate the solution in action and its impact on application latency, we conducted two tests that you can reproduce by following the instructions described in the “Testing” section of the repository’s README file (repository link). In both tests, we assume a hypothetical application with a target latency of 300s. We also modified the invocation frequency of the “Target Setter” Lambda function to one minute to quickly assess the impact of target value changes. In both tests, we submit 50 messages to the Amazon SQS queue through the provided helper lambda. An MPD of 25s and 50s was used for the first and second test, respectively. The provided CloudWatch dashboard shows that the ASG scales to a total of four instances in the first test, and eight instances in the second (see the following figure). See README file for a detailed description of how various metrics evolve over time.
Comparison of Tests 1 and 2
Since Test 2 messages take twice as long to process, the Auto Scaling group launched twice as many instances to attempt to process all of the messages in the same amount of time as Test 1 (latency). The following figure shows that the total time to process all 50 messages in Test 1 was 9 mins vs 10 mins in Test 2. In contrast, if we were to use a static/fixed acceptable BPI of 12, then a total of four instances would have been operational in Test 2, thereby requiring double the time of Test 1 (~20 minutes) to process all of the messages. This demonstrates the value of using a dynamic scaling target when processing messages from Amazon SQS queues, especially in circumstances where the MPD is prone to vary with time.
Figure 2: CloudWatch dashboard showing Auto Scaling group scaling test results (Test 1 and 2).
Recommended best practices for Auto Scaling groups
This section highlights a few key best practices that we recommend adopting when deploying and working with Auto Scaling groups.
Reducing cost using EC2 Spot instances
Amazon SQS helps build loosely coupled application architectures, while providing reliable asynchronous communication between the various layers/components of an application. If a worker node fails to process a message within the Amazon SQS message visibility time-out, then the message is returned to the queue and another worker node can pick up and process that message. This makes Amazon SQS-backed applications fault-tolerant by design and thus a great fit for EC2 Spot instances. EC2 spot instances are spare compute capacity in the AWS cloud that is available to you at steep discounts as compared to On-Demand prices.
Maximizing capacity using attribute-based instance selection
With the recently released attribute-based instance selection feature, you can define infrastructure requirements based on application needs such as vCPU, RAM, and processor family (e.g., x86, ARM). This removes the need to define specific instances in your Auto Scaling group configuration, and it eliminates the burden of identifying the correct instance families and sizes. In addition, newly released instance types will be automatically considered if they fit your requirements. Attribute-based instance selection lets you tap into hundreds of different EC2 instance pools, which increases the chance of getting EC2 (Spot/On-demand) instances. When using attribute-based instance selection with the capacity optimized allocation strategy, Amazon EC2 allocates instances from deeper Spot capacity pools, thereby further reducing the chance of Spot interruption.
The following sample configuration creates an Auto Scaling group with attribute-based instance selection:
AutoScalingGroupName: 'my-asg' # [REQUIRED] MixedInstancesPolicy: LaunchTemplate: LaunchTemplateSpecification: LaunchTemplateId: 'lt-0537239d9aef10a77' Overrides: - InstanceRequirements: VCpuCount: # [REQUIRED] Min: 2 Max: 4 MemoryMiB: # [REQUIRED] Min: 2048 InstancesDistribution: SpotAllocationStrategy: 'capacity-optimized'MinSize: 0 # [REQUIRED] MaxSize: 100 # [REQUIRED] DesiredCapacity: 4VPCZoneIdentifier: 'subnet-e76a128a,subnet-e66a128b,subnet-e16a128c'Conclusion
As can be seen from the test results, this approach demonstrates how an Auto Scaling group can honor a user-provided acceptable latency constraint while accomodating variations in the MPD over time. This is possible because the average MPD is monitored and regularly updated as a CloudWatch metric. In turn, this is continously used to update the target value of the group’s target tracking policy. Moreover, we have covered additional Auto Scaling group best practices suitable for this use case, including the use of Spot instances to reduce costs and attribute-based instance selection to simplify the selection of relevant instance types.
For more information on scaling options for Auto Scaling groups, visit the Amazon EC2 Auto Scaling documentation page and the SQS-based scaling guide.
This blog post is written by Sumit Menaria, Senior Hybrid Solutions Architect AWS WWSO Core Services.
AWS Outposts Rack is a fully-managed service that extends AWS infrastructure, services, APIs, and tools to customer premises. By providing local access to AWS managed infrastructure and services, Outposts rack enables customers to build and run applications on premises using the same programming interfaces as in AWS Regions, while using local compute and storage resources for low latency, local data processing, and data residency needs.
There are various data sources on premises that you might want to connect from your Outpost. These sources can include field devices, on-premises databases, mainframes, storage arrays, or end users. Each Outpost supports a single Local Gateway (LGW) construct, which enables connectivity from your Outpost subnets to an on-premises network. Note that this post is specific to Outposts racks and a different method of local communication is used for AWS Outposts servers.
Two different options for facilitating communication between your Outpost based resources and on-premises network: Direct VPC routing and customer-owned IP pool. Both of these are mutually exclusive options, and routing works differently based on your choice of the mode. The two modes are the attributes of the LGW route table that your Outpost subnets’ VPC is associated with, which specifies the communication mode for the Outpost subnets.
Direct VPC routing mode
Direct VPC routing uses the private IP address of the instances in the VPC CIDR block to facilitate communication with your on-premises network. These addresses are advertised to your on-premises network with Border Gateway Protocol (BGP). Advertisement via BGP is only for the private IP addresses that belong to the subnets on your Outpost and have a route pointing to the LGW via the subnet’s route table. This type of routing is the default mode for Outposts Rack. In this mode, the LGW doesn’t perform Network Address Translation (NAT) for instances. Furthermore, you don’t have to assign an Elastic IP address to your Amazon Elastic Compute Cloud (Amazon EC2) instance from a (CoIP) to enable communication with your on-premises resources.

In this diagram, when the instance Y wants to communicate with an on-premises server, it traverses the LGW and can talk to the on-premises server using its source address (10.0.1.11) in the Subnet CIDR range (10.0.1.0/24) that is advertised over BGP from the LGW to the Customer Network Device. Similarly when the on-premises server wants to initiate communication with the Outpost based EC2 instance, it uses the instance’s private IP address (10.0.1.11) as the destination IP address to set up the connection.
CoIP mode
Utilizing CoIP mode means that you must provide a separate IP address range from your on-premises IP space for AWS to create an address pool, known as a CoIP. With CoIP, when an Outpost based resources, such as EC2 instances, Application Load Balancer (ALB), or Amazon Relational Database Service (Amazon RDS) instances, need to communicate to your on-premises network, the Local Gateway will perform 1:1 NAT from the resource’s private IP address from the Outpost subnet range to an IP address from the CoIP pool. The subnet-to-CoIP address mapping is done by assigning an Elastic IP (EIP) from the CoIP address range allocated for resources such as EC2 instances. To enable the communication with the CoIP pool from the on-premises network, and then the LGW advertises the CoIP pool through BGP over its peering with the Customer Network Device.

In this diagram, when the instance Y wants to talk to an on-premises server, the traffic traverses the LGW and the source IP address (10.0.1.11) of the instance gets translated to an IP address (192.168.0.11) in the CoIP range that is associated with the instance. Similarly, when the on-premises server initiates the communication, the request will be sent with the CoIP address (192.168.0.11) of the instance as the destination IP address. This will be changed to the instance’s private IP address (10.0.1.11) via NAT at the LGW. The CoIP pool (192.168.0.0/26) is advertised via BGP to the Customer Network Device to provide the route to the on-premises environment for reaching the Outpost based resources.
When to choose CoIP routing mode
CoIP is particularly useful when you want to isolate your Outpost based workloads from the on-premises infrastructure and only need specific resources on the Outpost to be able to communicate to the on-premises infrastructure. This is useful in situations where large enterprise networks have hundreds of IP pools allocated and there is a high chance of overlap between IP addresses allocated to Outpost based VPCs/Subnets and those allocated to on-premises infrastructure. Furthermore, CoIP can act as another layer of security, as you may choose to allocate the CoIP addresses to only the resources which must communicate with the on-premises network. Then you can allocate for the rest of them using the subnet private IP address range for communication within the Outpost or Region based resources.
This means that you don’t need to have the number of IPs in the CoIP pool be equal to the number of resources on your Outpost. For example, you may choose to configure a /26 CoIP range and a /22 pool for subnets to meet your workload requirements.
CoIP mode can also be useful when using an external ALB on Outpost and you want to make it routable through the local internet connectivity. By using a smaller internet routable CoIP address range assignment for your external ALB, you can route traffic to the ALB on the Outpost without needing to traverse through the internet gateway (IGW) in the parent Region.
When to choose Direct VPC routing mode
You can choose Direct VPC routing if you don’t want the operational overhead of managing the additional IP pools for NAT between your Outpost based resources and on-premises network. There are also few applications which may not work well if there is an NAT of IPs between the two endpoints communicating with each other. Some examples you may see are Active Directory communication with on-premises based servers, or iSCSI mount of your instances as an additional storage to on-premises Storage Area Network (SAN). These applications may not work or may need additional tuning if they encounter NATed IP addresses between an Outpost based client on an EC2 instance and on-premises based server for a two-way communication.
When Direct VPC routing mode is used, multiple VPCs can be associated to an Outpost LGW route table, and the Outpost subnets with the LGW as the route target, are automatically advertised to the on-premises network through BGP. Therefore, you must make sure that appropriate IP planning is in place to avoid any overlap of the Outpost VPC/Subnet IP range with the on-premises IP range, as they are directly advertised from LGW toward the Customer Network Device. Having overlapping IP subnets in your network can lead to undesired effects on your application connectivity and you must pay special attention when allocating IP pools for your on-premises and Outpost based VPC address space. You can use Amazon VPC IP Address Manager (IPAM) to plan the IP space of your VPCs and CoIP pools, as well as add on-premises based IP Pools using manual allocation.
Conclusion
You can select either Direct VPC routing or CoIP mode for routing through an Outpost Local Gateway. Since this selection affects the routing for all of the subnets on your Outpost associated with the LGW route table, it should be selected based on your workload requirements and existing IP infrastructure planning. You can also change the LGW route table mode at a later stage. However, that involves network disruption and the creation of a new LGW route table. To learn more about Outposts Racks routing, visit the LGW Route table documentation.
This post is written by Arthi Jaganathan, Principal SA, Serverless and Dhiraj Mahapatro, Principal SA, Serverless.
Today, AWS is announcing three new Amazon CloudWatch metrics for asynchronous AWS Lambda function invocations: AsyncEventsReceived, AsyncEventAge, and AsyncEventsDropped. These metrics provide visibility for asynchronous Lambda function invocations.
Previously, customers found it challenging to monitor the processing of asynchronous invocations. With these new metrics for asynchronous function invocations, you can identify the root cause of processing issues. These issues include throttling, concurrency limit, function errors, processing latency because of retries, missing events, and taking corrective action.
This blog and the sample application provide examples that highlight the usage of the new metrics.
Overview

AWS services such as Amazon S3, Amazon SNS, and Amazon EventBridge invoke Lambda functions asynchronously. Lambda uses an internal queue to store events. A separate process reads events from the queue and sends them to the function.
By default, Lambda discards events from its event queue if the retry policy has exceeded the number of configured retries or the event reached its maximum age. However, the event once discarded from the event queue goes to the destination or DLQ, if configured.
This table summarizes the retry behavior. Visit the asynchronous Lambda invocations documentation to learn more:
| Cause | Retry behavior | Override |
| Function errors (returned from code or runtime, such as timeouts) | Retry twice | Set retry attempt on function between 0-2 |
| Throttles (429) and system errors (5xx) | Retry for a maximum of 6 hours | Set maximum age of event on function between 60 seconds to 6 hours |
| Zero reserved concurrency | No retry | N/A |
What’s new
The AsyncEventsReceived metric is a measure of the number of events enqueued in Lambda’s internal queue. You can track events from the client using custom CloudWatch metrics or extract it from logs using Embedded Metric Format (EMF). In case this metric is lower than the number of events that you expect, it shows that the source did not emit events or events did not arrive at the Lambda service. This is possible because of transient networking issues. Lambda does not emit this metric for retried events.
The AsyncEventAge metric is a measure of the difference between the time that an event is first enqueued in the internal queue and the time the Lambda service invokes the function. With retries, Lambda emits this metric every time it attempts to invoke the function with the event. An increasing value shows retries because of error or throttles. Customers can set alarms on this metric to alert on SLA breaches.
The AsyncEventsDropped metric is a measure of the number of events dropped because of processing failure.
How to use the new async event metrics
This flowchart shows the way that you can combine the new metrics with existing metrics to troubleshoot problems with asynchronous processing:

Example application
You can deploy a sample Lambda function to show how to use the new metrics for troubleshooting.
To test the following scenarios, you must install:
To set up the application:
- Set your AWS Region:
export REGION=<your AWS region> - Clone the GitHub repository:
git clone https://github.com/aws-samples/lambda-async-metrics-sample.gitcd lambda-async-metrics-sample - Build and deploy the application. Provide lambda-async-metric as the stack name when prompted. Keep everything else as default values:
sam buildsam deploy --guided --region $REGION - Save the name of the function in an environment variable:
FUNCTION\_NAME=$(aws cloudformation describe-stacks \ --region $REGION \ --stack-name lambda-async-metric \ --query 'Stacks[0].Outputs[?OutputKey==`HelloWorldFunctionResourceName`].OutputValue' --output text) - Invoke the function using AWS CLI:
aws lambda invoke \ --region $REGION \ --function-name $FUNCTION\_NAME \ --invocation-type Event out\_file.txt - Choose All Metrics under Metrics in the left-hand panel in the CloudWatch console and search for “async”:

- Choose Lambda > By Function Name and choose AsyncEventsReceived for the function you created. Under “Graphed metrics”, change the statistic to sum and “Period” to 1 minute. You see one record. After waiting a few seconds, refresh if you don’t see the metric immediately.

Scenarios
These scenarios show how you can use the three new metrics.
Scenario 1: Troubleshooting delays due to function error
Lambda retries processing the asynchronous invocation event for a maximum of two times, in case of function error or exception. Lambda drops the event from its internal queue if the retries are exhausted.
To simulate a function error, throw an exception from the Lambda handler:
- Edit the function code in hello\_world/app.py to raise an exception:
def handler(event, context): print(“Hello from AWS Lambda”) raise Exception(“Lambda function throwing exception”) - Build and deploy:
sam build && sam deploy –region $REGION - Invoke the function:
aws lambda invoke \ --region $REGION \ --function-name $FUNCTION\_NAME \ --invocation-type Event out\_file.txt
It is best practice to alert on function errors using the error metric and use the metrics to get better insights into retry behavior, such as interval between retries. For example, if a function errors because of a downstream system being overwhelmed, you can use AsyncEventAge and Concurrency metrics.
If you received an alert for function error, you see data points for AsyncEventsDropped. It is 1 for this scenario. Overlaying the Errors and Throttles metrics reconfirms function error causes this.

There are two retries before the Lambda service drops the event. No throttling confirms the function error. Next, you can confirm that the AsyncEventAge is increasing. Lambda publishes this metric every time it polls from the event queue and sends it to the function. This creates multiple data points for the metric.
You can duplicate the metric to see both statistics on a single graph. Here, the two lines overlap because there is only one data point published in each 1-minute interval.

The event spent 37ms in the internal queue before the first invoke attempt. Lambda’s first retry happens after 63.5 seconds. The second and final retry happens after 189.6 seconds.
Scenario 2: Troubleshooting delays because of concurrency limits
In case of throttling or system errors, Lambda retries invoking the event up to the configured MaximumEventAgeInSeconds (the maximum is 6 hours). To simulate the throttling error without hitting the account concurrency limit, you can:
- Set the function reserved concurrency to 1
- Introduce a 90 seconds sleep in the function code to simulate a lengthy function execution.
The Lambda service throttles new invocations while the first request is in progress. You invoke the function in quick succession from the command line to simulate throttling and observe the retry behavior:
- Set the function reserved concurrency to 1 by updating the AWS SAM template.
HelloWorldFunction: Type: AWS::Serverless::Function Properties: CodeUri: hello\_world/ Handler: app.lambda\_handler Runtime: python3.9 Timeout: 100 MemorySize: 128 Architectures: - x86\_64 ReservedConcurrentExecutions: 1 - Edit the function code in hello\_world/app.py to introduce a 90-second sleep. Replace existing code with the following in app.py:
import timedef handler(event, context): time.sleep(90) print("Hello from AWS Lambda") - Build and deploy:
sam build && sam deploy --region $REGION - Invoke the function twice in succession from the command line:
for i in {1..2}; do aws lambda invoke \ --region $REGION \ --function-name $FUNCTION\_NAME \ --invocation-type Event out\_file.txt; done
In a real-world use case, missing the processing SLA should trigger the troubleshooting workflow. Start with AsyncEventsReceived to confirm events enqueued by the Lambda service. This is 2 in this scenario. Look for dropped events using AsyncEventsDropped metric.

AsyncEventAge verifies delays in processing. As mentioned in the previous section, there can be multiple data points for this metric in a one-minute interval. You can duplicate the metric to compare minimum and maximum values.

There are 2 data points in the first minute. The event age increases to 31 seconds during this period.

There is only one data point for the metric in the remaining one-minute intervals, so the lines overlap. The event age increases to 59,153ms (~59 seconds) in one interval and then to 130,315ms (~130 seconds) in the next one-minute interval. Since the function sleeps for 90 seconds, it explains why the final retry is at around 2 minutes since the function received the event.
Checking function throttling, this screenshot confirms throttling six times in the first minute (07:12 UTC timestamp) and once in the subsequent minute (07:13 UTC timestamp).

This is because of the back-off behavior of Lambda’s internal queue. The data for AsyncEventAge shows that there is only one throttle in the second interval. Lambda delivers the event during the next one-minute interval after spending around 2 minutes in the internal queue.
Overlaying the ConcurrentExecutions and AsyncEventsReceived metrics provides more information. You see receipt of two events, but concurrency stayed at 1. This results in one event being throttled:
There are multiple ways to resolve throttling errors. You optimize the function to run faster or increase the function or account concurrency limits to address throttling errors.
The sample application covers other scenarios such as troubleshooting dropped events on event expiration, and troubleshooting dropped events when a function’s reserved concurrency is set to zero.
Cleaning up
Use the following command and follow the prompts to clean up the resources:
sam delete lambda-async-metric --region $REGIONConclusion
Using these new CloudWatch metrics, you can gain visibility into the processing of Lambda asynchronous invocations. This blog explained the new metrics AsyncEventsReceived, AsyncEventAge, and AsyncEventsDropped and how to use them to troubleshoot issues. With these new metrics, you can track the asynchronous invocation requests sent to Lambda functions. You monitor any delays in processing, and take corrective actions if required.
The Lambda service sends these new metrics to CloudWatch at no cost to you. However, charges apply for CloudWatch Metric Streams and CloudWatch Alarms. See CloudWatch pricing for more information.
For more serverless learning resources, visit Serverless Land.
This post is written by Rahman Syed, Sr. Solutions Architect, State & Local Government and Brian Zambrano, Sr. Specialist Solutions Architect, Serverless.
Developers of serverless applications use the AWS Serverless Application Model (AWS SAM) CLI to generate continuous integration and deployment (CI/CD) pipelines. In October 2022, AWS released OpenID Connect (OIDC) support for AWS SAM Pipelines. This improves your security posture by creating integrations that use short-lived credentials from your CI/CD provider.
OIDC is an authentication layer based on open standards that makes it easier for a client and an identity provider to exchange information. CI/CD tools like GitHub, GitLab, and Bitbucket provide support for OIDC, which ensures that you can integrate with AWS for secure deployments.
This blog post shows how to create a GitHub Actions workflow that securely integrates with AWS using GitHub as an identity provider.
Securing CI/CD systems that interact with AWS
AWS SAM Pipelines is a feature of AWS SAM CLI that generates CI/CD pipeline configurations for six CI/CD systems. These include AWS CodePipeline, Jenkins, GitHub Actions, GitLab CI/CD, and BitBucket. You can get started with these AWS-curated pipeline definitions or create your own to support your organization’s standards.
CI/CD pipelines hosted outside of AWS require credentials to deploy to your AWS environment. One way of integrating is to use an AWS Identity and Access Management (IAM) user, which requires that you store the access key and secret access key within your CI/CD provider. Long-term access keys remain valid unless you revoke them, unlike temporary security credentials that are valid for shorter periods of time.
It is a best practice to use temporary, scoped security credentials generated by AWS Security Token Service (AWS STS) to reduce your risk if credentials are exposed. Temporary tokens are generated dynamically as opposed to being stored. Because they expire after minutes or hours, temporary tokens limit the duration of any potential compromise. A token scoped with least privilege limits permissions to a set of resources and prevents wider access within your environment. AWS SAM Pipelines supports short-term credentials with three OIDC providers: GitHub, GitLab, and Bitbucket.
This post shows how AWS SAM Pipelines can integrate GitHub Actions with your AWS environment using these short-term, scoped credentials powered by the OIDC open standard. It uses a two-stage pipeline, representing a development and production environment.

This example uses GitHub as the identity provider. When the dev task in the GitHub Actions workflow attempts to assume the dev pipeline execution role in the AWS account, IAM validates that the supplied OIDC token originates from a trusted source. Configuration in IAM allows role assumption from specified GitHub repositories and branches. AWS SAM Pipelines performs the initial heavy lifting of configuring both GitHub Actions and IAM using the principle of least-privileged.
Prerequisites
- AWS SAM CLI, version 1.60.0 or higher
- GitHub account: You must have the required permissions to configure GitHub projects and create pipelines.
- Create a new GitHub repository, using the name “sam-app”.
Creating a new serverless application
To create a new serverless application:
- Create a new AWS SAM application locally:
sam init --name sam-app --runtime python3.9 --app-template hello-world --no-tracing - Initialize a git repository:
cd sam-appgit init -b maingit add .git commit -m "Creating a new SAM application" - Push the new repository to GitHub:
git remote add origin <REMOTE\_URL> # e.g. https://github.com/YOURUSER/sam-app.gitgit push -u origin main
GitHub offers multiple authentication mechanisms. Regardless of how you authenticate, ensure you have the “workflow” scope. GitHub Actions only allow changes to your pipeline when you push with credentials that have this scope attached.
Creating application deployment targets
Once the AWS SAM application is hosted in a GitHub repository, you can create CI/CD resources in AWS that support two deployment stages for the serverless application environment. This is a one-time operation.
Step 1: Creating the pipeline for the first stage.
Run the command for the first stage, answering the interactive questions:
sam pipeline bootstrap --stage devWhen prompted to choose a “user permissions provider”, make sure to select OpenID Connect (OIDC). In the next question, select GitHub Actions as the OIDC provider. These selections result in additional prompts for information that later result in a least privilege integration with GitHub Actions.
The following screenshot shows the interaction with AWS SAM CLI (some values may appear differently for you):

Step 2: Create deployment resources for the second stage.
Run the following command and answer the interactive questions:
sam pipeline bootstrap --stage prodWith these commands, AWS SAM CLI bootstraps the AWS resources that the GitHub Actions workflow later uses to deploy the two stages of the serverless application. This includes Amazon S3 buckets for artifacts and logs, and IAM roles for deployments. AWS SAM CLI also creates the IAM identity provider to establish GitHub Actions as a trusted OIDC provider.
The following screenshot shows these resources from within the AWS CloudFormation console. These resources do not represent a serverless application, but the AWS resources a GitHub Actions workflow must perform deployments. The aws-sam-cli-managed-dev-pipeline-resources stack creates an IAM OIDC identity provider used to establish trust between your AWS account and GitHub.

Generating and deploying a GitHub Actions workflow
The final step to creating a CI/CD pipeline in GitHub Actions is to use a GitHub source repository and two deployment targets in a GitHub Actions workflow.
To generate a pipeline configuration with AWS SAM Pipelines, run the following command and answer interactive questions:
sam pipeline initThe following screenshot shows the interaction with AWS SAM CLI (some values may appear differently for you):

AWS SAM CLI has created a local file named pipeline.yaml which is the GitHub Actions workflow definition. Inspect the pipeline.yaml file to see how the GitHub Actions workflow deploys within your AWS account:

In this example task, GitHub Actions initiates an Action named configure-aws-credentials that uses OIDC as the method for assuming an AWS IAM role for deployment activity. The credentials are valid for 3600 seconds (one hour).
To deploy the GitHub Actions workflow, commit the new file and push to GitHub:
git add .git commit -m "Creating a CI/CD Pipeline"git push origin mainOnce GitHub receives this commit, the repository creates a new GitHub Actions Workflow, as defined by the new pipeline.yaml configuration file.
Inspecting the GitHub Actions workflow
1. Navigate to the GitHub repository’s Actions view to see the first workflow run in progress.

2. Choosing the workflow run, you can see details about the deployment.

3. Once the deploy-testing step starts, open the CloudFormation console to see the sam-app-dev stack deploying.

4. The GitHub Actions Pipeline eventually reaches the deploy-prod step, which deploys the production environment of your AWS SAM application. At the end of the Pipeline run, you have two AWS SAM applications in your account deployed by CloudFormation via GitHub Actions. Every change pushed to the GitHub repository now triggers your new multi-stage CI/CD pipeline.

You have successfully created a CI/CD pipeline for a system located outside of AWS that can deploy to your AWS environment without the use of long-lived credentials.
Cleanup
To clean up your AWS based resources, run following AWS SAM CLI commands, answering “y” to all questions:
sam delete --stack-name sam-app-prodsam delete --stack-name sam-app-devsam delete --stack-name aws-sam-cli-managed-dev-pipeline-resourcessam delete --stack-name aws-sam-cli-managed-prod-pipeline-resourcesYou may also return to GitHub and delete the repository you created.
Conclusion
AWS SAM Pipeline support for OIDC is a new feature of AWS SAM CLI that simplifies the integration of CI/CD pipelines hosted outside of AWS. Using short-term credentials and scoping AWS actions to specific pipeline tasks reduces risk for your organization. This post shows you how to get started with AWS SAM Pipelines to create a GitHub Actions-based CI/CD pipeline with two deployment stages.
The Complete AWS SAM Workshop provides you with hands-on experience for many AWS SAM features, including CI/CD with GitHub Actions.
Watch guided video tutorials to learn how to create deployment pipelines for GitHub Actions, GitLab CI/CD, and Jenkins.
For more learning resources, visit https://serverlessland.com/explore/sam-pipelines.
This post is written by Dominik Richter (Solutions Architect)
Architectural patterns help you solve recurring challenges in software design. They are blueprints that have been used and tested many times. When you design distributed applications, enterprise integration patterns (EIP) help you integrate distributed components. For example, they describe how to integrate third-party services into your existing applications. But patterns are technology agnostic. They do not provide any guidance on how to implement them.
This post shows you how to use Amazon EventBridge Pipes to implement four common enterprise integration patterns (EIP) on AWS. This helps you to simplify your architectures. Pipes is a feature of Amazon EventBridge to connect your AWS resources. Using Pipes can reduce the complexity of your integrations. It can also reduce the amount of code you have to write and maintain.
Content filter pattern
The content filter pattern removes unwanted content from a message before forwarding it to a downstream system. Use cases for this pattern include reducing storage costs by removing unnecessary data or removing personally identifiable information (PII) for compliance purposes.
In the following example, the goal is to retain only non-PII data from “ORDER”-events. To achieve this, you must remove all events that aren’t “ORDER” events. In addition, you must remove any field in the “ORDER” events that contain PII.
While you can use this pattern with various sources and targets, the following architecture shows this pattern with Amazon Kinesis. EventBridge Pipes filtering discards unwanted events. EventBridge Pipes input transformers remove PII data from events that are forwarded to the second stream with longer retention.

Instead of using Pipes, you could connect the streams using an AWS Lambda function. This requires you to write and maintain code to read from and write to Kinesis. However, Pipes may be more cost effective than using a Lambda function.
Some situations require an enrichment function. For example, if your goal is to mask an attribute without removing it entirely. For example, you could replace the attribute “birthday” with an “age\_group”-attribute.

In this case, if you use Pipes for integration, the Lambda function contains only your business logic. On the other hand, if you use Lambda for both integration and business logic, you do not pay for Pipes. At the same time, you add complexity to your Lambda function, which now contains integration code. This can increase its execution time and cost. Therefore, your priorities determine the best option and you should compare both approaches to make a decision.
To implement Pipes using the AWS Cloud Development Kit (AWS CDK), use the following source code. The full source code for all of the patterns that are described in this blog post can be found in the AWS samples GitHub repo.
const filterPipe = new pipes.CfnPipe(this, 'FilterPipe', { roleArn: pipeRole.roleArn, source: sourceStream.streamArn, target: targetStream.streamArn, sourceParameters: { filterCriteria: { filters: [{ pattern: '{"data" : {"event\_type" : ["ORDER"] }}' }] }, kinesisStreamParameters: { startingPosition: 'LATEST' } }, targetParameters: { inputTemplate: '{"event\_type": <$.data.event\_type>, "currency": <$.data.currency>, "sum": <$.data.sum>}', kinesisStreamParameters: { partitionKey: 'event\_type' } },});To allow access to source and target, you must assign the correct permissions:
const pipeRole = new iam.Role(this, 'FilterPipeRole', { assumedBy: new iam.ServicePrincipal('pipes.amazonaws.com') });sourceStream.grantRead(pipeRole);targetStream.grantWrite(pipeRole);Message translator pattern
In an event-driven architecture, event producers and consumers are independent of each other. Therefore, they may exchange events of different formats. To enable communication, the events must be translated. This is known as the message translator pattern. For example, an event may contain an address, but the consumer expects coordinates.

If a computation is required to translate messages, use the enrichment step. The following architecture diagram shows how to accomplish this enrichment via API destinations. In the example, you can call an existing geocoding service to resolve addresses to coordinates.

There may be cases where the translation is purely syntactical. For example, a field may have a different name or structure.

You can achieve these translations without enrichment by using input transformers.

Here is the source code for the pipe, including the role with the correct permissions:
const pipeRole = new iam.Role(this, 'MessageTranslatorRole', { assumedBy: new iam.ServicePrincipal('pipes.amazonaws.com'), inlinePolicies: { invokeApiDestinationPolicy } });sourceQueue.grantConsumeMessages(pipeRole);targetStepFunctionsWorkflow.grantStartExecution(pipeRole);const messageTranslatorPipe = new pipes.CfnPipe(this, 'MessageTranslatorPipe', { roleArn: pipeRole.roleArn, source: sourceQueue.queueArn, target: targetStepFunctionsWorkflow.stateMachineArn, enrichment: enrichmentDestination.apiDestinationArn, sourceParameters: { sqsQueueParameters: { batchSize: 1 } },});Normalizer pattern
The normalizer pattern is similar to the message translator but there are different source components with different formats for events. The normalizer pattern routes each event type through its specific message translator so that downstream systems process messages with a consistent structure.

The example shows a system where different source systems store the name property differently. To process the messages differently based on their source, use an AWS Step Functions workflow. You can separate by event type and then have individual paths perform the unifying process. This diagram visualizes that you can call a Lambda function if needed. However, in basic cases like the preceding “name” example, you can modify the events using Amazon States Language (ASL).

In the example, you unify the events using Step Functions before putting them on your event bus. As is often the case with architectural choices, there are alternatives. Another approach is to introduce separate queues for each source system, connected by its own pipe containing only its unification actions.

This is the source code for the normalizer pattern using a Step Functions workflow as enrichment:
const pipeRole = new iam.Role(this, 'NormalizerRole', { assumedBy: new iam.ServicePrincipal('pipes.amazonaws.com') });sourceQueue.grantConsumeMessages(pipeRole);enrichmentWorkflow.grantStartSyncExecution(pipeRole);normalizerTargetBus.grantPutEventsTo(pipeRole);const normalizerPipe = new pipes.CfnPipe(this, 'NormalizerPipe', { roleArn: pipeRole.roleArn, source: sourceQueue.queueArn, target: normalizerTargetBus.eventBusArn, enrichment: enrichmentWorkflow.stateMachineArn, sourceParameters: { sqsQueueParameters: { batchSize: 1 } },});Claim check pattern
To reduce the size of the events in your event-driven application, you can temporarily remove attributes. This approach is known as the claim check pattern. You split a message into a reference (“claim check”) and the associated payload. Then, you store the payload in external storage and add only the claim check to events. When you process events, you retrieve relevant parts of the payload using the claim check. For example, you can retrieve a user’s name and birthday based on their userID.

The claim check pattern has two parts. First, when an event is received, you split it and store the payload elsewhere. Second, when the event is processed, you retrieve the relevant information. You can implement both aspects with a pipe.
In the first pipe, you use the enrichment to split the event, in the second to retrieve the payload. Below are several enrichment options, such as using an external API via API Destinations, or using Amazon DynamoDB via Lambda. Other enrichment options are Amazon API Gateway and Step Functions.
Using a pipe to split and retrieve messages has three advantages. First, you keep events concise as they move through the system. Second, you ensure that the event contains all relevant information when it is processed. Third, you encapsulate the complexity of splitting and retrieving within the pipe.
The following code implements a pipe for the claim check pattern using the CDK:
const pipeRole = new iam.Role(this, 'ClaimCheckRole', { assumedBy: new iam.ServicePrincipal('pipes.amazonaws.com') });claimCheckLambda.grantInvoke(pipeRole);sourceQueue.grantConsumeMessages(pipeRole);targetWorkflow.grantStartExecution(pipeRole);const claimCheckPipe = new pipes.CfnPipe(this, 'ClaimCheckPipe', { roleArn: pipeRole.roleArn, source: sourceQueue.queueArn, target: targetWorkflow.stateMachineArn, enrichment: claimCheckLambda.functionArn, sourceParameters: { sqsQueueParameters: { batchSize: 1 } }, targetParameters: { stepFunctionStateMachineParameters: { invocationType: 'FIRE\_AND\_FORGET' } },});Conclusion
This blog post shows how you can implement four enterprise integration patterns with Amazon EventBridge Pipes. In many cases, this reduces the amount of code you have to write and maintain. It can also simplify your architectures and, in some scenarios, reduce costs.
You can find the source code for all the patterns on the AWS samples GitHub repo.
For more serverless learning resources, visit Serverless Land. To find more patterns, go directly to the Serverless Patterns Collection.
This post is written by Corneliu Croitoru (Media Streaming and Edge Architect) and Benjamin Smith (Principal Developer Advocate, Serverless)
In January 2022, the Serverless Developer Advocate team launched Serverlesspresso Extensions, a program that lets you contribute to Serverlesspresso. This is a multi-tenant event-driven application for a pop-up coffee bar that allows you to order from your phone. In 2022, Serverlesspresso processed over 20,000 orders at technology events around the world. The goal of Serverlesspresso extensions is to showcase the power and simplicity of evolving an event-driven application.
Event-driven architecture is a design pattern that allows developers to create and evolve applications by responding to events generated by various parts of the system. For modern applications, the need for flexible and scalable approaches is critical, and event-driven architecture can provide a powerful solution.
This blog post shows how to build and deploy an extension to an event-driven application. It describes the benefits and challenges of evolving event-driven applications. It also walks through a real-life example that was created in under 24 hours.
Decoupled integrations
A key benefit of event-driven architecture is its ability to decouple different parts of the system, making it easier to manage changes and evolve the application. In traditional, monolithic applications, changes to one part of the system can affect the entire application.
With event-driven architecture, you can change individual parts of the system without affecting the rest of the application. Event-driven architecture also makes it easier to integrate new functionality into an existing application by creating new event handlers to respond to existing events. This way, you can add new functionality without affecting the existing system, making it easier to test and deploy.
The following diagrams illustrate how to add and remove consumers and producers without affecting the core application.

Adding and removing event-driven extensions
Extension 2 is consuming events from the event bus and emitting events back onto the bus. It can be added to the core application without creating any dependencies. When extension 2 is removed, the core application remains unchanged.
In monolithic applications, additional features can create dependencies on the core application. Removing those features keeps those dependencies in place, making it more complex to remove them.

Adding and removing monolithic extensions
Collaboration
In a traditional monolithic application, it can be difficult to collaborate with multiple developers on a single code base. It can lead to conflicts, bugs, and other issues that must be resolved. Integrating new features and components into these applications can be challenging, especially when multiple developers are using different technologies. Deploying updates can also be complex when multiple developers are involved and different parts of the application must be updated simultaneously.
With event-based applications, these challenges are often less significant. A well-designed consumer contains well-defined permissions boundaries. Its resources should not need permission to interact with resources outside the extension definition. This means you can deploy and delete them independently of other extensions and of the core application. This makes it easier to collaborate with multiple developers across different languages, runtimes, and deployment frameworks.
Near real-time feedback
Another characteristic of event-driven architecture is the ability to provide real-time feedback to users. This is because consumers can process events as they occur, making it possible to provide immediate feedback. This can be useful in applications that handle high volumes of data or interact with multiple users, as they can provide real-time updates and ensure that the application remains responsive.
An alternative approach for near real-time feedback is to use batching. This involves grouping multiple events or data points into a batch and processing them. Choosing between batching and processing data in real-time with events depends on the amount of data being processed, the latency requirements, and the complexity of the processing logic. Batching can be more efficient for large volumes of data as it reduces the overhead of processing each event individually, while processing data with events can be better suited for real-time applications that require low latency.
The newest Serverlesspresso extension uses an event-driven approach to gain real-time insight into the application.
The average wait time extension
A new extension was created by Corneliu Croitoru that calculates the average wait for each drink at the Serverlesspresso coffee bar. This extension uses AWS Step Functions, DynamoDB, and AWS Lambda. The app displays the results in near real-time, allowing customers to see how long they may need to wait for their order. The extension uses the AWS Cloud Development Kit (CDK) for deployment.
The extension uses the existing Amazon EventBridge event bus to start a Step Functions workflow. The workflow is triggered by the order submission and order completion events and calculates the average wait time for each type of drink (for example, Caffe Latte). This information is then sent back to the Serverlesspresso event bus.
The following diagram illustrates the Step Functions workflow:

When a new order submission event is emitted, the Step Functions workflow persists the event timestamp to a DynamoDB table, a key/value data store. It uses the unique order ID as the key. When an order completion event is emitted, the workflow persists the completion timestamp to DynamoDB. The workflow then invokes a Lambda function to calculate the average duration of that specific drink by using the last 10 orders stored in the DynamoDB table.
This is the DynamoDB table structure:

The workflow sends an event to the Serverlesspresso event bus with the calculated duration and drink type. A rule on the event bus routes this event to an IoT topic, which publishes it to the front-end application via an existing open WebSocket connection. The result appears on the front end:

Alternative approaches
There are a number of alternative approaches that you could use to build a real-time “average wait” extension without using events.
One such approach might be to use DynamoDB as a cache for the event-driven data. This way it would be possible to query the database periodically to check for updates. This approach can be implemented by adding a timestamp field to the database records and querying for records that have been updated since the last time you checked.
Alternatively, you could use DynamoDB streams to capture changes as they occur instead of subscribing to new events directly. However, these approaches may face several challenges. The extension would require permission to read data from the DynamoDB table or stream. Since the DynamoDB table resource is defined in the application’s core template, this presents challenges of ownership, permissions boundaries and dependencies. It adds additional complexity to the application as the extension would not be decoupled from the core.
The challenges
The biggest challenge in building this extension is the required shift in developer mindset. Despite understanding the principles of decoupled event-driven architecture, it was not until building an event-driven architecture extension that the concept became clear.
For example, you may think it necessary to deploy the existing application to submit orders, emit events onto the application event bus, and interact with various core resources. The development team had discussions about the degree to which the extension should interact with existing application components. This was not an event-driven mindset.
Each new extension must be based entirely on events. This means it can only interact with the core application through the shared event bus by consuming and emitting events. It also means that you could write the extension in any runtime, with any infrastructure as code (IaC) framework, and that it should be possible to deploy and destroy the extension stack with no effect on the core application.
Once you understand this, the next challenge is discoverability. Finding the right events to consume may prove harder than expected. This is why documenting events as you build your application is important. The event schema, producer and consumer should be documented, and evolve with each version of the event. The Serverlesspresso Events Catalog helps to overcome this in this example.
Finally, the event player can emit realistic Serverlesspresso events onto the event bus. This replaces the need to deploy the core application stack.
Conclusion
The Serverlesspresso Extensions program shows the simplicity of developing event-driven applications. Building event-driven architectures allows for decoupled integrations, making it easier to manage changes and develop the application. It also simplifies collaboration among multiple teams as consumers of events can come and go independently without affecting the procedure or core application.
Using these principles, the average wait time extension was built and deployed within 24 hours, using a different IaC framework to the core application.
Use the Serverlesspresso extensions GitHub repository to read how to build more Serverlesspresso extensions.
For more serverless learning resources, visit Serverless Land.
This post is written by John Ritsema (Principal Solutions Architect)
Continuous integration and continuous delivery (CI/CD) pipelines are effective mechanisms that allow teams to turn source code into running applications. When a developer makes a code change and pushes it to a remote repository, a pipeline with a series of steps can process the change. A pipeline integrates a change with the full code base, verifies the style and formatting, runs security checks, and runs unit tests. As the final step, it builds the code into an artifact that is deployable to an environment for consumption.
When using GitHub or many other hosted Git providers, a pull request or merge request can be submitted for a particular code change. This creates a focused place for discussion and collaboration on the change before it is approved and merged into a shared code branch.
A powerful mechanism for collaboration involves deploying a pull request (PR) to a running environment. This allows stakeholders to preview the changes live and see how they would look. Spinning up a running environment quickly allows teammates to provide almost immediate feedback, expediting the entire development process.
Deploying PRs to ephemeral environments encourages teams to make many small changes that can be previewed and tested in parallel. This avoids having to first merge into a common source branch and deploy to long-lived environments that are always on and incur costs.
Creating this mechanism has several challenges including setup complexity, environment creation time, and environment cost. This post addresses these challenges by showing how to create a CI/CD pipeline for previewing changes to web applications in ephemeral, quick-to-provision, low-cost, and scale-to-zero environments. This post walks through the steps required to set up a sample application.
Example architecture
The concepts in this post can be implemented using a number of tools and hosted Git providers that connect to CI/CD pipelines. The example code shared in this post uses GitHub Actions to trigger a workflow. The workflow uses a small Terraform module with Docker to build the application source code into a container image, push it to Amazon Elastic Container Registry (ECR), and create an AWS Lambda function with the image.
The container running on Lambda is accessible from a web browser through a Lambda function URL. This provides a dedicated HTTPS endpoint for a function.
This is used instead of AWS App Runner, Amazon ECS Fargate with an Application Load Balancer (ALB), or Amazon EKS with ALB ingress because of speed of provisioning and low cost. Lambda function URLs are ideal for occasionally used ephemeral PR environments as they can be provisioned quickly. Lambda’s scale-to-zero compute environment leads to lower cost, as charges are only incurred for actual HTTP requests. This is useful for PRs that may only be reviewed infrequently and then sit idle until the PR is either merged or closed.
This is the example architecture:
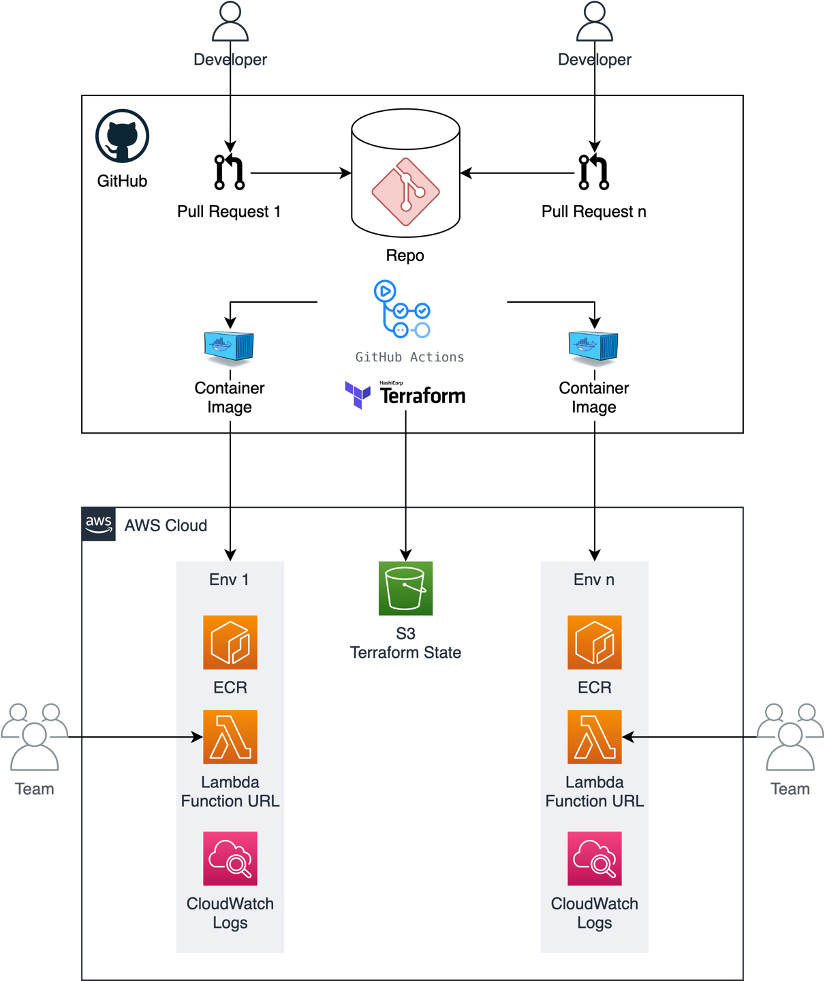
Setting up the example
The sample project shows how to implement this example. It consists of a vanilla web application written in Node.js. All of the code needed to implement the architecture is contained within the .github directory. To enable ephemeral environments for a new project, copy over the .github directory without cluttering your project files.

There are two main resources needed to run Terraform inside of GitHub Actions: an AWS IAM role and a place to store Terraform state. AWS credentials are required to give the pipeline permission to provision AWS resources.
Instead of using static IAM user credentials that must be rotated and secured, assume an IAM role to obtain temporary credentials. Terraform remote state is needed to dispose of the environment when the PR is merged or closed. The sample project uses an Amazon S3 bucket to store Terraform state.
You can use the Terraform module located under .github/setup to create these required resources.
-
- Provide the name of your GitHub organization and repository in the
terraform.tfvarsfile as input parameters. You can replace aws-samples with your GitHub user name: - To provision the resources using Terraform, run:

Store the outputted terraform.tfstate file safely so that you can manage these resources in the future if needed. - Place the Region, generated IAM role, and bucket name into the configuration file located under .github/workflows/config.env. This configuration file is read and used by the GitHub Actions workflow.
This IAM role has an inline policy that contains the minimum set of permissions needed to provision the AWS resources. This assumes that your application does not interact with external services like databases or caches. If your application needs this additional access, you can add the required permissions to the policy located here.
- Provide the name of your GitHub organization and repository in the
Running a web server in Lambda
The sample web (HTTP) application includes a Dockerfile that contains instructions for packaging the web app into a process-based container image. A Lambda extension called Lambda Web Adapter enables you to run this standard web server process on Lambda. The CI/CD workflow makes a copy of the Dockerfile and adds the following line.
This line copies the Lambda Web Adapter executable binary from a public ECR image and writes it into the container in the /opt/extensions/ directory. When the container starts, Lambda starts the Lambda Web Adapter extension. This translates Lambda event payloads from HTTP-based triggers into actual HTTP requests that it proxies to the web app running inside the container. This is the architecture:

By default, Lambda Web Adapter assumes that the web app is listening on port 8080. However, you can change this in the Dockerfile by setting the PORT environment variable.
The containerized web app experiences a “cold start”. However, this is likely not too much of a concern, as the app will only be previewed internally by teammates.
Workflow pipeline
The GitHub Actions job defined in the up.yml workflow is triggered when a PR is opened or reopened against the repository’s main branch. The following is a summary of the steps that the Job performs.
- Read the configuration from .github/workflows/config.env
- Assume the IAM Role, which has minimal permissions to deploy AWS resources
- Install the Terraform CLI
- Add the Lambda Web Adapter extension to the copy of the Dockerfile
- Run terraform apply to provision the AWS resources using the S3 bucket for Terraform remote state
- Obtain the HTTPS endpoint from Terraform and add it to the PR as a comment
The following code snippet shows the key steps (4-6) from the up.yml workflow.
The main.tf file (in the same directory) includes infrastructure as code (IaC) that is responsible for creating an ECR repository, building and pushing the container image to it, and spinning up a Lambda function based on the image. The following is a snippet from the Terraform configuration. You can see how concisely this can be configured.
Terraform outputs the generated HTTPS endpoint. The workflow writes it back to the PR as a comment so that teammates can click on the link to preview the changes:

The workflow takes about 60 seconds to spin up a new isolated containerized web application in an ephemeral environment that can be previewed.
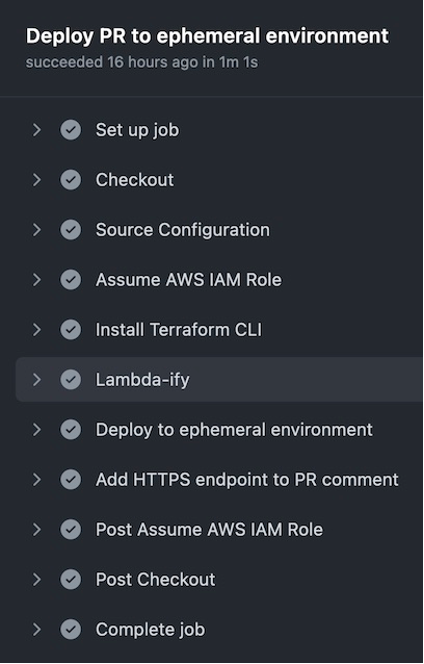
Pull request collaboration
The following screenshot shows an example PR as the author collaborates with their team. After implementing this example, when a new PR arrives, the changes are deployed to a new ephemeral environment. Stakeholders can use the link to preview what the changes look like and provide feedback.
Once the changes are approved and merged into the main branch, the GitHub Actions down.yml workflow disposes of the environment. This means that the ephemeral environment is de-provisioned, including resources like the Lambda function and the ECR repository.

Conclusion
This post discusses some of the benefits of using ephemeral environments in CI/CD pipelines. It shows how to implement a pipeline using GitHub Actions and Lambda Function URLs for fast, low-cost, and ephemeral environments.
With this example, you can deploy PRs quickly, and the cost is based on HTTP requests made to the environment. There are no compute costs incurred while a PR is open and no one is previewing the environment. The only charges are for Lambda invocations, while stakeholders are actively interacting with the environment. When a PR is merged or closed, the cloud infrastructure is disposed of. You can find all of the example code referenced in this post here.
For more serverless learning resources, visit Serverless Land.
This blog post is written by Katja-Maja Krödel, IoT Specialist Solutions Architect, and Benjamin Meyer, Senior Solutions Architect, Game Tech.
Customers use Amazon Elastic Compute Cloud (Amazon EC2) instances to develop, deploy, and test applications. To use those instances most effectively, customers have expressed the need to set back their instance to a previous state within minutes or even seconds. They want to find a quick and automated way to manage setting back their instances at scale.
The feature of replacing Root Volumes of Amazon EC2 instances enables customers to replace the root volumes of running EC2 instances to a specific snapshot or its launch state. Without stopping the instance, this allows customers to fix issues while retaining the instance store data, networking, and AWS Identity and Access Management (IAM) configuration. Customers can resume their operations with their instance store data intact. This works for all virtualized EC2 instances and bare metal EC2 Mac instances today.
In this post, we show you how to design your architecture for automated Root Volume Replacement using this Amazon EC2 feature. We start with the automated snapshot creation, continue with automatically replacing the root volume, and finish with how to keep your environment clean after your replacement job succeeds.
What is Root Volume Replacement?
Amazon EC2 enables customers to replace the root Amazon Elastic Block Store (Amazon EBS) volume for an instance without stopping the instance to which it’s attached. An Amazon EBS root volume is replaced to the launch state, or any snapshot taken from the EBS volume itself. This allows issues to be fixed, such as root volume corruption or guest OS networking errors. Replacing the root volume of an instance includes the following steps:
- A new EBS volume is created from a previously taken snapshot or the launch state
- Reboot of the instance
- While rebooting, the current root volume is detached and the new root volume is attached
The previous EBS root volume isn’t deleted and can be attached to an instance for later investigation of the volume. If replacing to a different state of the EBS than the launch state, then a snapshot of the current root volume is used.
An example use case is a continuous integration/continuous deployment (CI/CD) System that builds on EC2 instances to build artifacts. Within this system, you could alter the installed tools on the host and may cause failing builds on the same machine. To prevent any unclean builds, the introduced architecture is used to clean up the machine by replacing the root volume to a previously known good state. This is especially interesting for EC2 Mac Instances, as their Dedicated Host won’t undergo the scrubbing process, and the instance is more quickly restored than launching a fresh EC2 Mac instance on the same host.
Overview
The feature of replacing Root Volumes was introduced in April 2021 and has just been <TBD> extended to work for Bare Metal EC2 Mac Instances. This means that EC2 Mac Instances are included. If you want to reset an EC2 instance to a previously known good state, then you can create Snapshots of your EBS volumes. To reset the root volume to its launch state, no snapshot is needed. For non-root volumes, you can use these Snapshots to create new EBS volumes, and then attach those to your instance as well as detach them. To automate the process of replacing your root volume not only once, but also in a repeatable manner, we’re introducing you to an architecture that can fully-automate this process.
In the case that you use a snapshot to create a new root volume, you must take a new snapshot of that volume to be able to get back to that state later on. You can’t use a snapshot of a different volume to restore to, which is the reason that the architecture includes the automatic snapshot creation of a fresh root volume.
The architecture is built in three steps:
- Automation of Snapshot Creation for new EBS volumes
- Automation of replacing your Root Volume
- Preparation of the environment for the next Root Volume Replacement
The following diagram illustrates the architecture of this solution.

In the next sections, we go through these concepts to design the automatic Root Volume Replacement Task.
Automation of Snapshot Creation for new EBS volumes

The figure above illustrates the architecture for automatically creating a snapshot of an existing EBS volume. In this architecture, we focus on the automation of creating a snapshot whenever a new EBS root volume is created.
Amazon EventBridge is used to invoke an AWS Lambda function on an emitted createVolume event. For automated reaction to the event, you can add a rule to the EventBridge which will forward the event to an AWS Lambda function whenever a new EBS volume is created. The rule within EventBridge looks like this:
{ "source": ["aws.ec2"], "detail-type": ["EBS Volume Notification"], "detail": { "event": ["createVolume"] }}An example event is emitted when an EBS root volume is created, which will then invoke the Lambda function to look like this:
{ "version": "0", "id": "01234567-0123-0123-0123-012345678901", "detail-type": "EBS Volume Notification", "source": "aws.ec2", "account": "012345678901", "time": "yyyy-mm-ddThh:mm:ssZ", "region": "us-east-1", "resources": [ "arn:aws:ec2:us-east-1:012345678901:volume/vol-01234567" ], "detail": { "result": "available", "cause": "", "event": "createVolume", "request-id": "01234567-0123-0123-0123-0123456789ab" }}The code of the function uses the resource ARN within the received event and requests resource details about the EBS volume from the Amazon EC2 APIs. Since the event doesn’t include information if it’s a root volume, then you must verify this using the Amazon EC2 API.
The following is a summary of the tasks of the Lambda function:
- Extract the EBS ARN from the EventBridge Event
- Verify that it’s a root volume of an EC2 Instance
- Call the Amazon EC2 API
create-snapshotto create a snapshot of the root volume and add a tagreplace-snapshot=true
Then, the tag is used to clean up the environment and get rid of snapshots that aren’t needed.
As an alternative, you can emit your own event to EventBridge. This can be used to automatically create snapshots to which you can restore your volume. Instead of reacting to the createVolume event, you can use a customized approach for this architecture.
Automation of replacing your Root Volume

The figure above illustrates the procedure of replacing the EBS root volume. It starts with the event, which is created through the AWS Command Line Interface (AWS CLI), console, or usage of the API. This leads to creating a new volume from a snapshot or using the initial launch state. The EC2 instance is rebooted, and during that time the old root volume is detached and a new volume gets attached as the root volume.
To invoke the create-replace-root-volume-task, you can call the Amazon EC2 API with the following AWS CLI command:
aws ec2 create-replace-root-volume-task --instance-id <value> --snapshot <value> --tag-specifications ResourceType=string,Tags=[{Key=replaced-volume,Value=true}]If you want to restore to launch state, then omit the --snapshot parameter:
aws ec2 create-replace-root-volume-task --instance-id <value> --tag-specifications ResourceType=string,Tags=[{Key=delete-volume,Value=true}]After running this command, AWS will create a new EBS volume, add the tag to the old EBS replaced-volume=true, restart your instance, and attach the new volume to the instance as the root volume. The tag is used later to detect old root volumes and clean up the environment.
If this is combined with the earlier explained automation, then the automation will immediately take a snapshot from the new EBS volume. A restore operation can only be done to a snapshot of the current EBS root volume. Therefore, if no snapshot is taken from the freshly restored EBS volume, then no restore operation is possible except the restore to launch state.
Preparation of the Environment for the next Root Volume Replacement
After the task is completed, the old root volume isn’t removed. Additionally, snapshots of previous root volumes can’t be used to restore current root volumes. To clean up your environment, you can schedule a Lambda function which does the following steps:
- Delete detached EBS volumes with the tag
delete-volume=true - Delete snapshots with the tag
replace-snapshot=true, which aren’t associated with an existing EBS volume
Conclusion
In this post, we described an architecture to quickly restore EC2 instances through Root Volume Replacement. The feature of replacing Root Volumes of Amazon EC2 instances, now including Bare Metal EC2 Mac instances, enables customers to replace the root volumes of running EC2 instances to a specific snapshot or its launch state. Customers can resume their operations with their instance store data intact. We’ve split the process of doing this in an automated and quick manner into three steps: Create a snapshot, run the replacement task, and reset your environment to be prepared for a following replacement task. If you want to learn more about this feature, then see the Announcement of replacing Root Volumes, as well as the documentation for this feature. <TBD Announcement Bare Metal>
This blog post is written by Enrico Liguori, SA – Solutions Builder , WWPS Solution Architecture.
AWS Local Zones are a type of infrastructure deployment that places compute, storage,and other select AWS services close to large population and industry centers.
We now have a total of 32 Local Zones; 15 outside of the US (Bangkok, Buenos Aires, Copenhagen, Delhi, Hamburg, Helsinki, Kolkata, Lagos, Lima, Muscat, Perth, Querétaro, Santiago, Taipei, and Warsaw) and 17 in the US. We will continue to launch Local Zones in 21 metro areas in 18 countries, including Australia, Austria, Belgium, Brazil, Canada, Colombia, Czech Republic, Germany, Greece, India, Kenya, Netherlands, New Zealand, Norway, Philippines, Portugal, South Africa, and Vietnam.
Customers using AWS Local Zones can provision the infrastructure and services needed to host their workloads with the same APIs and tools for automation that they use in the AWS Region, included the AWS Cloud Development Kit (AWS CDK).
The AWS CDK is an open source software development framework to model and provision your cloud application resources using familiar programming languages, including TypeScript, JavaScript, Python, C#, and Java. For the solution in this post, we use Python.
Overview
In this post we demonstrate how to:
- Programmatically enable the Local Zone of your interest.
- Explore the supported APIs to check the types of Amazon Elastic Compute Cloud (Amazon EC2) instances available in a specific Local Zone and get their associated price per hour;
- Deploy a simple WordPress application in the Local Zone through AWS CDK.
Prerequisites
To be able to try the examples provided in this post, you must configure:
Enabling a Local Zone programmatically
To get started with Local Zones, you must first enable the Local Zone that you plan to use in your AWS account. In this tutorial, you can learn how to select the Local Zone that provides the lowest latency to your site and understand how to opt into the Local Zone from the AWS Management Console.
If you prefer to interact with AWS APIs programmatically, then you can enable the Local Zone of your interest by calling the ModifyAvailabilityZoneGroup API through the AWS CLI or one of the supported AWS SDKs.
The following examples show how to opt into the Atlanta Local Zone through the AWS CLI and through the Python SDK:
AWS CLI:
aws ec2 modify-availability-zone-group \ --region us-east-1 \ --group-name us-east-1-atl-1 \ --opt-in-status opted-in
Python SDK:
ec2 = boto3.client('ec2', config=Config(region\_name='us-east-1'))response = ec2.modify\_availability\_zone\_group( GroupName='us-east-1-atl-1', OptInStatus='opted-in' )
The opt in process takes approximately five minutes to complete. After this time, you can confirm the opt in status using the DescribeAvailabilityZones API.
From the AWS CLI, you can check the enabled Local Zones with:
aws ec2 describe-availability-zones --region us-east-1
Or, once again, we can use one of the supported SDKs. Here is an example using Phyton:
ec2 = boto3.client('ec2', config=Config(region\_name='us-east-1'))response = ec2.describe\_availability\_zones()
In both cases, a JSON object similar to the following, will be returned:
{"State": "available","OptInStatus": "opted-in","Messages": [],"RegionName": "us-east-1","ZoneName": "us-east-1-atl-1a","ZoneId": "use1-atl1-az1","GroupName": "us-east-1-atl-1","NetworkBorderGroup": "us-east-1-atl-1","ZoneType": "local-zone","ParentZoneName": "us-east-1d","ParentZoneId": "use1-az4"}
The OptInStatus confirms that we successful enabled the Atlanta Local Zone and that we can now deploy resources in it.
How to check available EC2 instances in Local Zones
The set of instance types available in a Local Zone might change from one Local Zone to another. This means that before starting deploying resources, it’s a good practice to check which instance types are supported in the Local Zone.
After enabling the Local Zone, we can programmatically check the instance types that are available by using DescribeInstanceTypeOfferings. To use the API with Local Zones, we must pass availability-zone as the value of the LocationType parameter and use a Filter object to select the correct Local Zone that we want to check. The resulting AWS CLI command will look like the following example:
aws ec2 describe-instance-type-offerings --location-type "availability-zone" --filters Name=location,Values=us-east-1-atl-1a --region us-east-1
Using Python SDK:
ec2 = boto3.client('ec2', config=Config(region\_name='us-east-1'))response = ec2.describe\_instance\_type\_offerings( LocationType='availability-zone', Filters=[ { 'Name': 'location', 'Values': ['us-east-1-atl-1a'] } ] )
How to check prices of EC2 instances in Local Zones
EC2 instances and other AWS resources in Local Zones will have different prices than in the parent Region. Check the pricing page for the complete list of pricing options and associated price-per-hour.
To access the pricing list programmatically, we can use the GetProducts API. The API returns the list of pricing options available for the AWS service specified in the ServiceCode parameter. We also recommend defining Filters to restrict the number of results returned. For example, to retrieve the On-Demand pricing list of a T3 Medium instance in Atlanta from the AWS CLI, we can use the following:
aws pricing get-products --format-version aws\_v1 --service-code AmazonEC2 --region us-east-1 \--filters 'Type=TERM\_MATCH,Field=instanceType,Value=t3.medium' \--filters 'Type=TERM\_MATCH,Field=location,Value=US East (Atlanta)'
Similarly, with Python SDK we can use the following:
pricing = boto3.client('pricing',config=Config(region\_name="us-east-1")) response = pricing.get\_products( ServiceCode='AmazonEC2', Filters= [ { "Type": "TERM\_MATCH", "Field": "instanceType", "Value": "t3.medium" }, { "Type": "TERM\_MATCH", "Field": "regionCode", "Value": "us-east-1-atl-1" } ], FormatVersion='aws\_v1',)
Note that the Region specified in the CLI command and in Boto3, is the location of the AWS Price List service API endpoint. This API is available only in us-east-1 and ap-south-1 Regions.
Deploying WordPress in Local Zones using AWS CDK
In this section, we see how to use the AWS CDK and Python to deploy a simple non-production WordPress installation in a Local Zone.
Architecture overview

The AWS CDK stack will deploy a new standard Amazon Virtual Private Cloud (Amazon VPC) in the parent Region (us-east-1) that will be extended to the Local Zone. This creates two subnets associated with the Atlanta Local Zone: a public subnet to expose resources on the Internet, and a private subnet to host the application and database layers. Review the AWS public documentation for a definition of public and private subnets in a VPC.
The application architecture is made of the following:
- A front-end in the private subnet where a WordPress application is installed, through a User Data script, in a type T3 medium EC2 instance.
- A back-end in the private subnet where MySQL database is installed, through a User Data script, in a type T3 medium EC2 instance.
- An Application Load Balancer (ALB) in the public subnet that will act as the entry point for the application.
- A NAT instance to allow resources in the private subnet to initiate traffic to the Internet.
Clone the sample code from the AWS CDK examples repository
We can clone the AWS CDK code hosted on GitHub with:
$ git clone https://github.com/aws-samples/aws-cdk-examples.git
Then navigate to the directory aws-cdk-examples/python/vpc-ec2-local-zones using the following:
$ cd aws-cdk-examples/python/vpc-ec2-local-zones
Before starting the provisioning, let’s look at the code in the following sections.
Networking infrastructure
The networking infrastructure is usually the first building block that we must define. In AWS CDK, this can be done using the VPC construct:
import aws\_cdk.aws\_ec2 as ec2vpc = ec2.Vpc( self, "Vpc", cidr=”172.31.100.0/24”, subnet\_configuration=[ ec2.SubnetConfiguration( name = 'Public-Subnet', subnet\_type = ec2.SubnetType.PUBLIC, cidr\_mask = 26, ), ec2.SubnetConfiguration( name = 'Private-Subnet', subnet\_type = ec2.SubnetType.PRIVATE\_ISOLATED, cidr\_mask = 26, ), ] )
Together with the VPC CIDR (i.e. 172.31.100.0/24), we define also the subnets configuration through the subnet\_configuration parameter.
Note that in the subnet definitions above there is no specification of the Availability Zone or Local Zone that we want to associate them with. We can define this setting at the VPC level, overwriting the availability\_zones method as shown here:
@propertydef availability\_zones(self): return [“us-east-1-atl-1a”]
As an alternative, you can use a Local Zone Name as the value of the availability\_zones parameter in each Subnet definition. For a complete list of Local Zone Names, check out the Zone Names on the Local Zones Locations page.
Specifying ec2.SubnetType.PUBLIC in the subnet\_type parameter, AWS CDK automatically creates an Internet Gateway (IGW) associated with our VPC and a default route in its routing table pointing to the IGW. With this setup, the Internet traffic will go directly to the IGW in the Local Zone without going through the parent AWS Region. For other connectivity options, check the AWS Local Zone User Guide.
The last piece of our networking infrastructure is a self-managed NAT instance. This will allow instances in the private subnet to communicate with services outside of the VPC and simultaneously prevent them from receiving unsolicited connection requests.
We can implement the best practices for NAT instances included in the AWS public documentation using a combination of parameters of the Instance construct, as shown here:
nat = ec2.Instance(self, "NATInstanceInLZ", vpc=vpc, security\_group=self.create\_nat\_SG(vpc), instance\_type=ec2.InstanceType.of(ec2.InstanceClass.T3, ec2.InstanceSize.MEDIUM), machine\_image=ec2.MachineImage.latest\_amazon\_linux(), user\_data=ec2.UserData.custom(user\_data), vpc\_subnets=ec2.SubnetSelection(availability\_zones=[“us-east-1-atl-1a”], subnet\_type=ec2.SubnetType.PUBLIC), source\_dest\_check=False )
In the previous code example, we specify the following as parameters:
- vpc – the VPC object created before.
- security group – the Security Group containing the rules to allow HTTP and HTTPS traffic. The Security Group is created in
create\_nat\_SGfunction provided in the code that we copied from the repository. - instance\_type – the instance type, in our case a T3 Medium.
- user\_data – it contains the required OS configuration for the NAT instance that will be performed at instance start up.
- vpc\_subnets – the public subnet.
- source\_dest\_check – False to disable the source/destination check.
The final required step is to update the route table of the private subnet with the following:
priv\_subnet.add\_route("DefRouteToNAT", router\_id=nat\_instance.instance\_id, router\_type=ec2.RouterType.INSTANCE, destination\_cidr\_block="0.0.0.0/0", enables\_internet\_connectivity=True)
The application stack
The other resources, including the front-end instance managed by AutoScaling, the back-end instance, and ALB are deployed using the standard AWS CDK constructs. Note that the ALB service is only available in some Local Zones. If you plan to use a Local Zone where ALB isn’t supported, then you must deploy a load balancer on a self-managed EC2 instance, or use a load balancer available in AWS Marketplace.
Stack deployment
Next, let’s go through the AWS CDK bootstrapping process. This is required only for the first time that we use AWS CDK in a specific AWS environment (an AWS environment is a combination of an AWS account and Region).
$ cdk bootstrap
Now we can deploy the stack with the following:
$ cdk deploy
After the deployment is completed, we can connect to the application with a browser using the URL returned in the output of the cdk deploy command:

The WordPress install wizard will be displayed in the browser, thereby confirming that the deployment worked as expected:

Note that in this post we use the Local Zone in Atlanta. Therefore, we must deploy the stack in its parent Region, US East (N. Virginia). To select the Region used by the stack, configure the AWS CLI default profile.
Cleanup
To terminate the resources that we created in this post, you can simply run the following:
$ cdk destroy
Conclusion
In this post, we demonstrated how to interact programmatically with the different AWS APIs available for Local Zones. Furthermore, we deployed a simple WordPress application in the Atlanta Local Zone after analyzing the AWS CDK code used for the deployment.
We encourage you to try the examples provided in this post and get familiar with the programmatic configuration and deployment of resources in a Local Zone.
This post is written by Ankur Sethi, Sr. Product Manager, EC2, and Kinnar Sen, Sr. Specialist Solution Architect, AWS Compute.
Amazon EC2 Auto Scaling helps customers optimize their Amazon EC2 capacity by dynamically responding to varying demand. Based on customer feedback, we enhanced the scaling experience with the launch of predictive scaling policies. Predictive scaling proactively adds EC2 instances to your Auto Scaling group in anticipation of demand spikes. This results in better availability and performance for your applications that have predictable demand patterns and long initialization times. We recently launched a couple of features designed to help you assess the value of predictive scaling – prescriptive recommendations on whether to use predictive scaling based on its potential availability and cost impact, and integration with Amazon CloudWatch to continuously monitor the accuracy of predictions. In this post, we discuss the features in detail and the steps that you can easily adopt to enjoy the benefits of predictive scaling.
Recap: Predictive Scaling
EC2 Auto Scaling helps customers maintain application availability by managing the capacity and health of the underlying cluster. Prior to predictive scaling, EC2 Auto Scaling offered dynamic scaling policies such as target tracking and step scaling. These dynamic scaling policies are configured with an Amazon CloudWatch metric that represents an application’s load. EC2 Auto Scaling constantly monitors this metric and responds according to your policies, thereby triggering the launch or termination of instances. Although it’s extremely effective and widely used, this model is reactive in nature, and for larger spikes, may lead to unfulfilled capacity momentarily as the cluster is scaling out. Customers mitigate this by adopting aggressive scale out and conservative scale in to manage the additional buffer of instances. However, sometimes applications take a long time to initialize or have a recurring pattern with a sudden spike of high demand. These can have an impact on the initial response of the system when it is scaling out. Customers asked for a proactive scaling mechanism that can scale capacity ahead of predictable spikes, and so we delivered predictive scaling.
Predictive scaling was launched to make the scaling action proactive as it anticipates the changes required in the compute demand and scales accordingly. The scaling action is determined by ensemble machine learning (ML) built with data from your Auto Scaling group’s scaling patterns, as well as billions of data points from our observations. Predictive scaling should be used for applications where demand changes rapidly but with a recurring pattern, instances require a long time to initialize, or where you’re manually invoking scheduled scaling for routine demand patterns. Predictive scaling not only forecasts capacity requirements based on historical usage, but also learns continuously, thereby making forecasts more accurate with time. Furthermore, predictive scaling policy is designed to only scale out and not scale in your Auto Scaling groups, eliminating the risk of ending with lesser capacity because of inexact predictions. You must use dynamic scaling policy, scheduled scaling, or your own custom mechanism for scale-ins. In case of exceptional demand spikes, this addition of dynamic scaling policy can also improve your application performance by bridging the gap between demand and predicted capacity.
What’s new with predictive scaling
Predictive scaling policies can be configured in a non-mutative ‘Forecast Only’ mode to evaluate the accuracy of forecasts. When you’re ready to start scaling, you can switch to the ‘Forecast and Scale’ mode. Now we prescriptively recommend whether your policy should be switched to ‘Forecast and Scale’ mode if it can potentially lead to better availability and lower costs, saving you the time and effort of doing such an evaluation manually. You can test different configurations by creating multiple predictive scaling policies in ‘Forecast Only’ mode, and choose the one that performs best in terms of availability and cost improvements.
Monitoring and observability are key elements of AWS Well Architected Framework. Now we also offer CloudWatch metrics for your predictive scaling policies so that that you can programmatically monitor your predictive scaling policy for demand pattern changes or prolonged periods of inaccurate predictions. This will enable you to monitor the key performance metrics and make it easier to adopt AWS Well-Architected best practices.
In the following sections, we deep dive into the details of these two features.
Recommendations for predictive scaling
Once you set up an Auto Scaling group with predictive scaling policy in Forecast Only mode as explained in this introduction to predictive scaling blog post , you can review the results of the forecast visually and adjust any parameters to more accurately reflect the behavior that you desire. Evaluating simply on the basis of visualization may not be very intuitive if the scaling patterns are erratic. Moreover, if you keep higher minimum capacities, then the graph may show a flat line for the actual capacity as your Auto Scaling group capacity is an outcome of existing scaling policy configurations and the minimum capacity that you configured. This makes it difficult to contemplate whether the lower capacity predicted by predictive scaling wouldn’t leave your Auto Scaling group under-scaled.
This new feature provides a prescriptive guidance to switch on predictive scaling in Forecast and Scale mode based on the factors of availability and cost savings. To determine the availability and cost savings, we compare the predictions against the actual capacity and the optimal, required capacity. This required capacity is inferred based on whether your instances were running at a higher or lower value than the target value for scaling metric that you defined as part of the predictive scaling policy configuration. For example, if an Auto Scaling group is running 10 instances at 20% CPU Utilization while the target defined in predictive scaling policy is 40%, then the instances are running under-utilized by 50% and the required capacity is assumed to be 5 instances (half of your current capacity). For an Auto Scaling group, based on the time range in which you’re interested (two weeks as default), we aggregate the cost saving and availability impact of predictive scaling. The availability impact measures for the amount of time that the actual metric value was higher than the target value that you defined to be optimal for each policy. Similarly, cost savings measures the aggregated savings based on the capacity utilization of the underlying Auto Scaling group for each defined policy. The final cost and availability will lead us to a recommendation based on:
- If availability increases (or remains same) and cost reduces (or remains same), then switch on Forecast and Scale
- If availability reduces, then disable predictive scaling
- If availability increase comes at an increased cost, then the customer should take the call based on their cost-availability tradeoff threshold
 Figure 1: Predictive Scaling Recommendations on EC2 Auto Scaling console
The preceding figure shows how the console reflects the recommendation for a predictive scaling policy. You get information on whether the policy can lead to higher availability and lower cost, which leads to a recommendation to switch to Forecast and Scale. To achieve this cost saving, you might have to lower your minimum capacity and aim for higher utilization in dynamic scaling policies.
To get the most value from this feature, we recommend that you create multiple predictive scaling policies in Forecast Only mode with different configurations, choosing different metrics and/or different target values. Target value is an important lever that changes how aggressive the capacity forecasts must be. A lower target value increases your capacity forecast resulting in better availability for your application. However, this also means more dollars to be spent on the Amazon EC2 cost. Similarly, a higher target value can leave you under-scaled while reactive scaling bridges the gap in just a few minutes. Separate estimates of cost and availability impact are provided for each of the predictive scaling policies. We recommend using a policy if either availability or cost are improved and the other variable improves or stays the same. As long as there is a predictable pattern, Auto Scaling enhanced with predictive scaling maintains high availability for your applications.
Continuous Monitoring of predictive scaling
Once you’re using a predictive scaling policy in Forecast and Scale mode based on the recommendation, you must monitor the predictive scaling policy for demand pattern changes or inaccurate predictions. We introduced two new CloudWatch Metrics for predictive scaling called ‘PredictiveScalingLoadForecast’ and ‘PredictiveScalingCapacityForecast’. Using CloudWatch mertic math feature, you can create a customized metric that measures the accuracy of predictions. For example, to monitor whether your policy is over or under-forecasting, you can publish separate metrics to measure the respective errors. In the following graphic, we show how the metric math expressions can be used to create a Mean Absolute Error for over-forecasting on the load forecasts. Because predictive scaling can only increase capacity, it is useful to alert when the policy is excessively over-forecasting to prevent unnecessary cost. Figure 2: Graphing an accuracy metric using metric math on CloudWatch
In the previous graph, the total CPU Utilization of the Auto Scaling group is represented by m1 metric in orange color while the predicted load by the policy is represented by m2 metric in green color. We used the following expression to get the ratio of over-forecasting error with respect to the actual value.
IF((m2-m1)>0, (m2-m1),0))/m1
Next, we will setup an alarm to automatically send notifications using Amazon Simple Notification Service (Amazon SNS). You can create similar accuracy monitoring for capacity forecasts, but remember that once the policy is in Forecast and Scale mode, it already starts influencing the actual capacity. Hence, putting alarms on load forecast accuracy might be more intuitive as load is generally independent of the capacity of an Auto Scaling group.
 Figure 3: Creating a CloudWatch Alarm on the accuracy metric
In the above screenshot, we have set an alarm that triggers when our custom accuracy metric goes above 0.02 (20%) for 10 out of last 12 data points which translates to 10 hours of the last 12 hours. We prefer to alarm on a greater number of data points so that we get notified only when predictive scaling is consistently giving inaccurate results.
Conclusion
With these new features, you can make a more informed decision about whether predictive scaling is right for you and which configuration makes the most sense. We recommend that you start off with Forecast Only mode and switch over to Forecast and Scale based on the recommendations. Once in Forecast and Scale mode, predictive scaling starts taking proactive scaling actions so that your instances are launched and ready to contribute to the workload in advance of the predicted demand. Then continuously monitor the forecast to maintain high availability and cost optimization of your applications. You can also use the new predictive scaling metrics and CloudWatch features, such as metric math, alarms, and notifications, to monitor and take actions when predictions are off by a set threshold for prolonged periods.
This post is written by Ben Freiberg, Senior Solutions Architect, and Marcus Ziller, Senior Solutions Architect.
One of the most common serverless patterns are APIs built with Amazon API Gateway and AWS Lambda. This approach is supported by many different frameworks across many languages. However, direct integration with AWS can enable customers to increase the cost-efficiency and resiliency of their serverless architecture. This blog post discusses best practices for using Apache Velocity Templates for direct service integration in API Gateway.
Deciding between integration via Velocity templates and Lambda functions
Many use cases of Velocity templates in API Gateway can also be solved with Lambda. With Lambda, the complexity of integrating with different backends is moved from the Velocity templating language (VTL) to the programming language. This allows customers to use existing frameworks and methodologies from the ecosystem of their preferred programming language.
However, many customers choose serverless on AWS to build lean architectures and using additional services such as Lambda functions can add complexity to your application. There are different considerations that customers can use to assess the trade-offs between the two approaches.
Developer experience
Apache Velocity has a number of operators that can be used when an expression is evaluated, most prominently in #if and #set directives. These operators allow you to implement complex transformations and business logic in your Velocity templates.
However, this adds complexity to multiple aspects of the development workflow:
- Testing: Testing Velocity templates is possible but the tools and methodologies are less mature than for traditional programming languages used in Lambda functions.
- Libraries: API Gateway offers utility functions for VTL that simplify common use cases such as data transformation. Other functionality commonly offered by programming language libraries (for example, Python Standard Library) might not be available in your template.
- Logging: It is not possible to log information to Amazon CloudWatch from a Velocity template, so there is no option to retain this information.
- Tracing: API Gateway supports request tracing via AWS X-Ray for native integrations with services such as Amazon DynamoDB.
You should use VTL for data mapping and transformations rather than complex business logic. There are exceptions but the drawbacks of using VTL for other use cases often outweigh the benefits.
API lifecycle
The API lifecycle is an important aspect to consider when deciding on Velocity or Lambda. In early stages, requirements are typically not well defined and can change rapidly while exploring the solution space. This often happens when integrating with databases such as Amazon DynamoDB and finding out the best way to organize data on the persistence layer.
For DynamoDB, this often means changes to attributes, data types, or primary keys. In such cases, it is a sensible decision to start with Lambda. Writing code in a programming language can give developers more leeway and flexibility when incorporating changes. This shortens the feedback loop for changes and can improve the developer experience.
When an API matures and is run in production, changes typically become less frequent and stability increases. At this point, it can make sense to evaluate if the Lambda function can be replaced by moving logic into Velocity templates. Especially for busy APIs, the one-time effort of moving Lambda logic to Velocity templates can pay off in the long run as it removes the cost of Lambda invocations.
Latency
In web applications, a major factor of user perceived performance is the time it takes for a page to load. In modern single page applications, this often means multiple requests to backend APIs. API Gateway offers features to minimize the latency for calls on the API layer. With Lambda for service integration, an additional component is added into the execution flow of the request, which inevitably introduces additional latency.
The degree of that additional latency depends on the specifics of the workload, and often is as low as a few milliseconds.
The following example measures no meaningful difference in latency other than cold starts of the execution environments for a basic CRUD API with a Node.js Lambda function that queries DynamoDB. I observe similar results for Go and Python.


Concurrency and scalability
Concurrency and scalability of an API changes when having an additional Lambda function in the execution path of the request. This is due to different Service Quotas and general scaling behaviors in different services.
For API Gateway, the current default quota is 10,000 requests per second (RPS) with an additional burst capacity provided by the token bucket algorithm, using a maximum bucket capacity of 5,000 requests. API Gateway quotas are independent of Region, while Lambda default concurrency limits depend on the Region.
After the initial burst, your functions’ concurrency can scale by an additional 500 instances each minute. This continues until there are enough instances to serve all requests, or until a concurrency limit is reached. For more details on this topic, refer to Understanding AWS Lambda scaling and throughput.
If your workload experiences sharp spikes of traffic, a direct integration with your persistence layer can lead to a better ability to handle such spikes without throttling user requests. Especially for Regions with an initial burst capacity of 1000 or 500, this can help avoid throttling and provide a more consistent user experience.
Best practices
Organize your project for tooling support
When VTL is used in Infrastructure as Code (IaC) artifacts such as AWS CloudFormation templates, it must be embedded into the IaC document as a string.
This approach has three main disadvantages:
- Especially with multi-line Velocity templates, this leads to IaC definitions that are difficult to read or write.
- Tools such as IDEs or Linters do not work with string representations of Velocity templates.
- The templates cannot be easily used outside of the IaC definition, such as for local testing.
Each aspect impacts developer productivity and make the implementation more prone to errors.

You should decouple the definition of Velocity templates from the definition of IaC templates wherever possible. For the CDK, the implementation requires only a few lines of code.

// The following code is licensed under MIT-0 import { readFileSync } from 'fs';import * as path from 'path';const getUserIntegrationWithVTL = new AwsIntegration({ service: 'dynamodb', integrationHttpMethod: HttpMethods.POST, action: 'GetItem', options: { // Omitted for brevity requestTemplates: { 'application/json': readFileSync(path.join('path', 'to', 'vtl', 'request.vm'), 'utf8').toString(), }, integrationResponses: [ { statusCode: '200', responseParameters: { 'method.response.header.access-control-allow-origin': "'*'", }, responseTemplates: { 'application/json': readFileSync(path.join('path', 'to', 'vtl', 'request.vm'), 'utf8').toString(), }, }, ], }, });Another advantage of this approach is that it forces you to externalize variables in your templates. When defining Velocity templates inside of IaC documents, it is possible to refer to other resources in the same IaC document and set this value in the Velocity template through string concatenation. However, this hardcodes the value into the template as opposed to the recommended way of using Stage Variables.
Test Velocity templates locally
A frequent challenge that customers face with Velocity templates is how to shorten the feedback loop when implementing a template. A common workflow to test changes to templates is:
- Make changes to the template.
- Deploy the stack.
- Test the API endpoint.
- Evaluate the results or check logs for errors.
- Complete or return to step 1.
Depending on the duration of the stack deployment, this can often lead to feedback loops of several minutes. Although the test ecosystem for Velocity is far from being as extensive as it is for mainstream programming languages, there are still ways to improve the developer experience when writing VTL.
Local Velocity rendering engine with AWS SDK
When API Gateway receives a request that has an AWS integration target, the following things happen:
- Retrieve request context: API Gateway retrieves request parameters and stage variables.
- Make request: body: API Gateway uses the template and variables from 1 to render a JSON document.
- Send request: API Gateway makes an API call to the respective AWS Service. It abstracts Authorization (via it’s IAM Role), Encoding and other aspects of the request away so that only the request body needs to be provided by API Gateway
- Retrieve response: API Gateway retrieves a JSON response from the API call.
- Make response body: If the call was successful the JSON response is used as input to render the response template. The result will then be sent back to the client that initiated the request to the API Gateway
To simplify our developing workflow, you can locally replicate the above flow with the AWS SDK and a Velocity rendering engine of your choice.
I recommend using Node.js for two reasons:
- The
velocityjslibrary is a lightweight but powerful Velocity render engine - The client methods (e.g.
dynamoDbClient.query(jsonBody)) of the AWS SDK for JavaScript generally expect the same JSON body like the AWS REST API does. For most use cases, no transformation (e.g. camel case to Pascal case) is thus needed
The following snippet shows how to test Velocity templates for request and response of a DynamoDB Service Integration. It loads templates from files and renders them with context and parameters. Refer to the git repository for more details.
// The following code is licensed under MIT-0 const fs = require('fs')const Velocity = require('velocityjs');const AWS = require('@aws-sdk/client-dynamodb');const ddb = new AWS.DynamoDB()const requestTemplate = fs.readFileSync('path/to/vtl/request.vm', 'utf8')const responseTemplate = fs.readFileSync(''path/to/vtl/response.vm', 'utf8')async function testDynamoDbIntegration() { const requestTemplateAsString = Velocity.render(requestTemplate, { // Mocks the variables provided by API Gateway context: { arguments: { tableName: 'MyTable' } }, input: { params: function() { return 'someId123' }, }, }); print(requestTemplateAsString) const sdkJsonRequestBody = JSON.parse(requestTemplateAsString) const item = await ddb.query(sdkJsonRequestBody) const response = Velocity.render(responseTemplate, { input: { path: function() { return { Items: item.Items } }, }, }) const jsonResponse = JSON.parse(response)}This approach does not cover all use cases and ultimately must be validated by a deployment of the template. However, it helps to reduce the length of one feedback loop from minutes to a few seconds and allows for faster iterations in the development of Velocity templates.
Conclusion
This blog post discusses considerations and best practices for working with Velocity Templates in API Gateway. Developer experience, latency, API lifecycle, cost, and scalability are key factors when choosing between Lambda and VTL. For most use cases, we recommend Lambda as a starting point and VTL as an optimization step.
Setting up a local test environment for VTL helps shorten the feedback loop significantly and increase developer productivity. The AWS CDK is the recommended IaC framework for working with VTL projects, since it enables you to efficiently organize your infrastructure as code project for tooling support.
For more serverless learning resources, visit Serverless Land.
This blog post is written by Jonathan Tuliani, Principal Product Manager.
Today, AWS Lambda is announcing runtime management controls which provide more visibility and control over when Lambda applies runtime updates to your functions. Lambda is also changing how it rolls out automatic runtime updates to your functions. Together, these changes provide more flexibility in how you take advantage of the latest runtime features, performance improvements, and security updates.
By default, all functions will continue to receive automatic runtime updates. You do not need to change how you use Lambda to continue to benefit from the security and operational simplicity of the managed runtimes Lambda provides. The runtime controls are optional capabilities for advanced customers that require more control over their runtime changes.
This post explains what new runtime management controls are available and how you can take advantage of this new capability.
Overview
For each runtime, Lambda provides a managed execution environment. This includes the underlying Amazon Linux operating system, programming language runtime, and AWS SDKs. Lambda takes on the operational burden of applying patches and security updates to all these components. Customers tell us how much they appreciate being able to deploy a function and leave it, sometimes for years, without having to apply patches. With Lambda, patching ‘just works’, automatically.
Lambda strives to provide updates which are backward compatible with existing functions. However, as with all software patching, there are rare cases where a patch can expose an underlying issue with an existing function that depends on the previous behavior. For example, consider a bug in one of the runtime OS packages. Applying a patch to fix the bug is the right choice for the vast majority of customers and functions. However, in rare cases, a function may depend on the previous (incorrect) behavior. Customers with critical workloads running in Lambda tell us they would like a way to further mitigate even this slight risk of disruption.
With the launch of runtime management controls, Lambda now offers three new capabilities. First, Lambda provides visibility into which patch version of a runtime your function is using and when runtime updates are applied. Second, you can optionally synchronize runtime updates with function deployments. This provides you with control over when Lambda applies runtime updates and enables early detection of rare runtime update incompatibilities. Third, in the rare case where a runtime update incompatibility occurs, you can roll back your function to an earlier runtime version. This keeps your function working and minimizes disruption, providing time to remedy the incompatibility before returning to the latest runtime version.
Runtime identifiers and runtime versions
Lambda runtimes define the components of the execution environment in which your function code runs. This includes the OS, programming language runtime, environment variables, and certificates. For Python, Node.js and Ruby, the runtime also includes the AWS SDK. Each Lambda runtime has a unique runtime identifier, for example, nodejs18.x, or python3.9. Each runtime identifier represents a distinct major release of the programming language.
Runtime management controls introduce the concept of Lambda runtime versions. A runtime version is an immutable version of a particular runtime. Each Lambda runtime, such as Node.js 16, or Python 3.9, starts with an initial runtime version. Every time Lambda updates the runtime, it adds a new runtime version to that runtime. These updates cover all runtime components (OS, language runtime, etc.) and therefore use a Lambda-defined numbering scheme, independent of the version numbers used by the programming language. For each runtime version, Lambda also publishes a corresponding base image for customers who package their functions as container images.
New runtime identifiers represent a major release for the programming language, and sometimes other runtime components, such as the OS or SDK. Lambda cannot guarantee compatibility between runtime identifiers, although most times you can upgrade your functions with little or no modification. You control when you upgrade your functions to a new runtime identifier. In contrast, new runtime versions for the same runtime identifier have a very high level of backward compatibility with existing functions. By default, Lambda automatically applies runtime updates by moving functions from the previous runtime version to a newer runtime version.
Each runtime version has a version number, and an Amazon Resource Name (ARN). You can view the version in a new platform log line, INIT\_START. Lambda emits this log line each time it creates a new execution environment during the cold start initialization process.
INIT\_START Runtime Version: python:3.9.v14 Runtime Version ARN: arn:aws:lambda:eu-south-1::runtime:7b620fc2e66107a1046b140b9d320295811af3ad5d4c6a011fad1fa65127e9e6I
Runtime versions improve visibility into managed runtime updates. You can use the INIT\_START log line to identify when the function transitions from one runtime version to another. This helps you investigate whether a runtime update might have caused any unexpected behavior of your functions. Changes in behavior caused by runtime updates are very rare. If your function isn’t behaving as expected, by far the most likely cause is an error in the function code or configuration.
Runtime management modes
With runtime management controls, you now have more control over when Lambda applies runtime updates to your functions. You can now specify a runtime management configuration for each function. You can set the runtime management configuration independently for $LATEST and each published function version.
You can specify one of three runtime update modes: auto, function update, or manual. The runtime update mode controls when Lambda updates the function version to a new runtime version. By default, all functions receive runtime updates automatically, the alternatives are for advanced users in specific cases.
Automatic
Auto updates are the default, and are the right choice for most customers to ensure that you continue to benefit from runtime version updates. They help minimize your operational overheads by letting Lambda take care of runtime updates.
While Lambda has always provided automatic runtime updates, this release includes a change to how automatic runtime updates are rolled out. Previously, Lambda applied runtime updates to all functions in each region, following a region-by-region deployment sequence. With this release, functions configured to use the auto runtime update mode now receive runtime updates in two phases. Initially, Lambda only applies a new runtime version to newly created or updated functions. After this initial period is complete, Lambda then applies the runtime update to any remaining functions configured to use the auto runtime update mode.
This two-phase rollout synchronizes runtime updates with function updates for customers who are actively developing their functions. This makes it easier to detect and respond to any unexpected changes in behavior. For functions not in active development, auto mode continues to provide the operational benefits of fully automatic runtime updates.
Function update
In function update mode, Lambda updates your function to the latest available runtime version whenever you change your function code or configuration. This is the same as the first phase of auto mode. The difference is that, in auto mode, there is a second phase when Lambda applies runtime updates to functions which have not been changed. In function update mode, if you do not change a function, it continues to use the current runtime version indefinitely. This means that when using function update mode, you must update your functions regularly to keep their runtimes up-to-date. If you do not update a function regularly, you should use the auto runtime update mode.
Synchronizing runtime updates with function deployments gives you control over when Lambda applies runtime updates. For example, you can avoid applying updates during business-critical events, such as a product launch or holiday sales.
When used with CI/CD pipelines, function update mode enables early detection and mitigation in the rare event of a runtime update incompatibility. This is especially effective if you create a new published function version with each deployment. Each published function version captures a static copy of the function code and configuration, so that you can roll back to a previously published function version if required. Using function update mode extends the published function version to also capture the runtime version. This allows you to synchronize rollout and rollback of the entire Lambda execution environment, including function code, configuration, and runtime version.
Manual
Consider the rare event that a runtime update is incompatible with one of your functions. With runtime management controls, you can now roll back to an earlier runtime version. This keeps your function working and minimizes disruption, giving you time to remedy the incompatibility before returning to the latest runtime version.
There are two ways to implement a runtime version rollback. You can use function update mode with a published function version to synchronize the rollback of code, configuration, and runtime version. Or, for functions using the default auto runtime update mode, you can roll back your runtime version by using manual mode.
The manual runtime update mode provides you with full control over which runtime version your function uses. When enabling manual mode, you must specify the ARN of the runtime version to use, which you can find from the INIT\_START log line.
Lambda does not impose a time limit on how long you can use any particular runtime version. However, AWS strongly recommends using manual mode only for short-term remediation of code incompatibilities. Revert your function back to auto mode as soon as you resolve the issue. Functions using the same runtime version for an extended period may eventually stop working due to, for example, a certificate expiry.
Using runtime management controls
You can configure runtime management controls via the Lambda AWS Management Console and AWS Command Line Interface (AWS CLI). You can also use infrastructure as code tools such as AWS CloudFormation and the AWS Serverless Application Model (AWS SAM).
Console
From the Lambda console, navigate to a specific function. You can find runtime management controls on the Code tab, in the Runtime settings panel. Expand Runtime management configuration to view the current runtime update mode and runtime version ARN.

Runtime settings
To change runtime update mode, select Edit runtime management configuration. You can choose between automatic, function update, and manual runtime update modes.
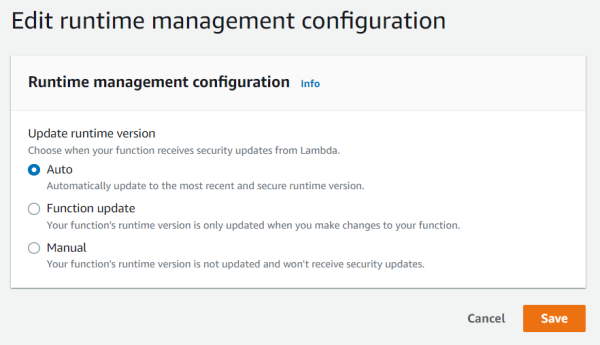
Edit runtime management configuration (Auto)
In manual mode, you must also specify the runtime version ARN.

Edit runtime management configuration (Manual)
AWS SAM
AWS SAM is an open-source framework for building serverless applications. You can specify runtime management settings using the RuntimeManagementConfig property.
Resources: HelloWorldFunction: Type: AWS::Serverless::Function Properties: Handler: lambda\_function.handler Runtime: python3.9 RuntimeManagementConfig: UpdateOn: Manual RuntimeVersionArn: arn:aws:lambda:eu-west-1::runtime:7b620fc2e66107a1046b140b9d320295811af3ad5d4c6a011fad1fa65127e9e6AWS CLI
You can also manage runtime management settings using the AWS CLI. You configure runtime management controls via a dedicated command aws lambda put-runtime-management-config, rather than aws lambda update-function-configuration.
aws lambda put-runtime-management-config --function-name <function\_arn> --update-runtime-on Manual --runtime-version-arn <runtime\_version\_arn>To view the existing runtime management configuration, use aws lambda get-runtime-management-config.
aws lambda get-runtime-management-config --function-name <function\_arn>The current runtime version ARN is also returned by aws lambda get-function and aws lambda get-function-configuration.
Conclusion
Runtime management controls provide more visibility and flexibility over when and how Lambda applies runtime updates to your functions. You can specify one of three update modes: auto, function update, or manual. These modes allow you to continue to take advantage of Lambda’s automatic patching, synchronize runtime updates with your deployments, and rollback to an earlier runtime version in the rare event that a runtime update negatively impacts your function.
For more information on runtime management controls, see our documentation page.
For more serverless learning resources, visit Serverless Land.
This post is written by Adrian Hornsby (Principal System Dev Engineer) and Marcia Villalba (Principal Developer Advocate).
AWS Lambda comprises over 80 services working together to provide the serverless compute service that it offers to customers. Under the hood, many of these services are built on top of Amazon Elastic Compute Cloud (Amazon EC2) instances, provisioned within Availability Zones. However, AWS Lambda is a Regional service. This means that customers use Lambda services from the Region level and its services are designed to be resilient to impairments that the underlying Availability Zones might have.
This blog post discusses how a Regional service such as Lambda takes advantage of Availability Zones and static stability to achieve its high availability target, and shows how Lambda teams verify their service’s static stability using AWS Fault Injection Simulator (AWS FIS). It also provides a solution using AWS services and tools to achieve Lambda’s resiliency strategy, using FIS, Amazon CloudWatch, and Amazon Route 53 Application Recovery Controller (Route 53 ARC).
The role of Availability Zones
Availability Zones are physically isolated sections of an AWS Region, designed to operate but also fail independently. They are separated by a meaningful distance from each other, up to 100 kilometers (60 miles), to prevent correlated failures, but close enough to use synchronous replication with single-digit millisecond latency.
Customers and AWS services have been using Availability Zones for years to build highly available, fault tolerant, and scalable applications. In particular, AWS Regional services such as AWS Lambda, Amazon DynamoDB, Amazon Simple Queue Service (Amazon SQS), and Amazon Simple Storage Service (Amazon S3), have achieved their high availability promises by spreading multiple independent replicas of their services across multiple Availability Zones. It uses the principles of independence and redundancy of Availability Zones to maximize the overall availability of that service.
Each replica is called a zonal replica. The system is designed so that any of the replicas can fail at any time. When a replica fails, it can be temporarily removed from the system until everything works as expected again. When that happens, the load is shared between the remaining zonal replicas.
Designing for failures
One lesson we learned at AWS when building services is when there is an Availability Zone impairment, it is better not to rely on control plane operations to remediate the failure. A control plane operation can, for example, be provisioning more capacity in an Availability Zone that is not affected by the impairment.
This principle is called static stability, and it describes the capability for a system to keep its original steady-state (or behavior) even when subjected to disruptive events without having to make any changes. A statically stable service should have as few dependencies as possible for its recovery process.
For a Regional service like AWS Lambda, this means that the remaining capacity in the healthy Availability Zones can absorb the traffic from a potentially impaired Availability Zone without having to scale up. This implies over-provisioning resources in all Availability Zones. Having that extra capacity pre-provisioned helps Lambda achieve its static stability. It is a tradeoff between the cost of over-provisioning resources and service availability. Since AWS Lambda promises high availability to its customers, with a monthly uptime service commitment of 99.95%, that tradeoff falls towards service availability.
How to prepare for failures
Preparing for an Availability Zone impairment is difficult because the symptoms and size of the impact can vary widely. An Availability Zone may be partially accessible or totally unreachable, and everything in between. Causes for the impairment can range from fiber cuts, power issues, overheating, hardware malfunctions, networking problems, capacity issues, and other unexpected situations. While those happen, they happen rarely. The most common categories of failures are bad deployments and bad configurations.
While some of these failures can be difficult to infer or reproduce, common symptoms include disruption of connectivity, increased latency, increased traffic due to retry storms, increased CPU and memory usage, and slow I/O.
At AWS, we learned to expect the unexpected and plan for failure. This means injecting faults in the system to reproduce some of the common symptoms of Availability Zone impairments, then observe how the system responds, and implement improvements. In addition, injecting faults in the system helps uncover potential monitoring and alarming blind spots, and gives an opportunity for teams to practice and improve their response to events with a focus on reducing time to recovery.
How Lambda tests its response to an Availability Zone impairment
Lambda’s approach to being resilient to Availability Zone impairments is to rely on static stability and automated systems. Humans are slower than machines for detecting issues and mitigating them. Therefore, Lambda must ensure that its services can detect issues within a zonal replica and remediate automatically within minutes and with no operator intervention. This auto-remediation is done by shifting customer traffic away from the affected Availability Zone to healthy ones, and it is called Availability Zone evacuation.
To do this, Lambda built a tool that detects failures and performs the Availability Zone evacuation when needed. This tool does a statistical comparison of metrics between different Availability Zones and EC2 instances in order to identify unhealthy Availability Zones. If an Availability Zone is found to have issues, the tool starts the evacuation out of the unhealthy Availability Zone automatically. This automation cuts the time to the first action from 30 minutes to less than 3 minutes.
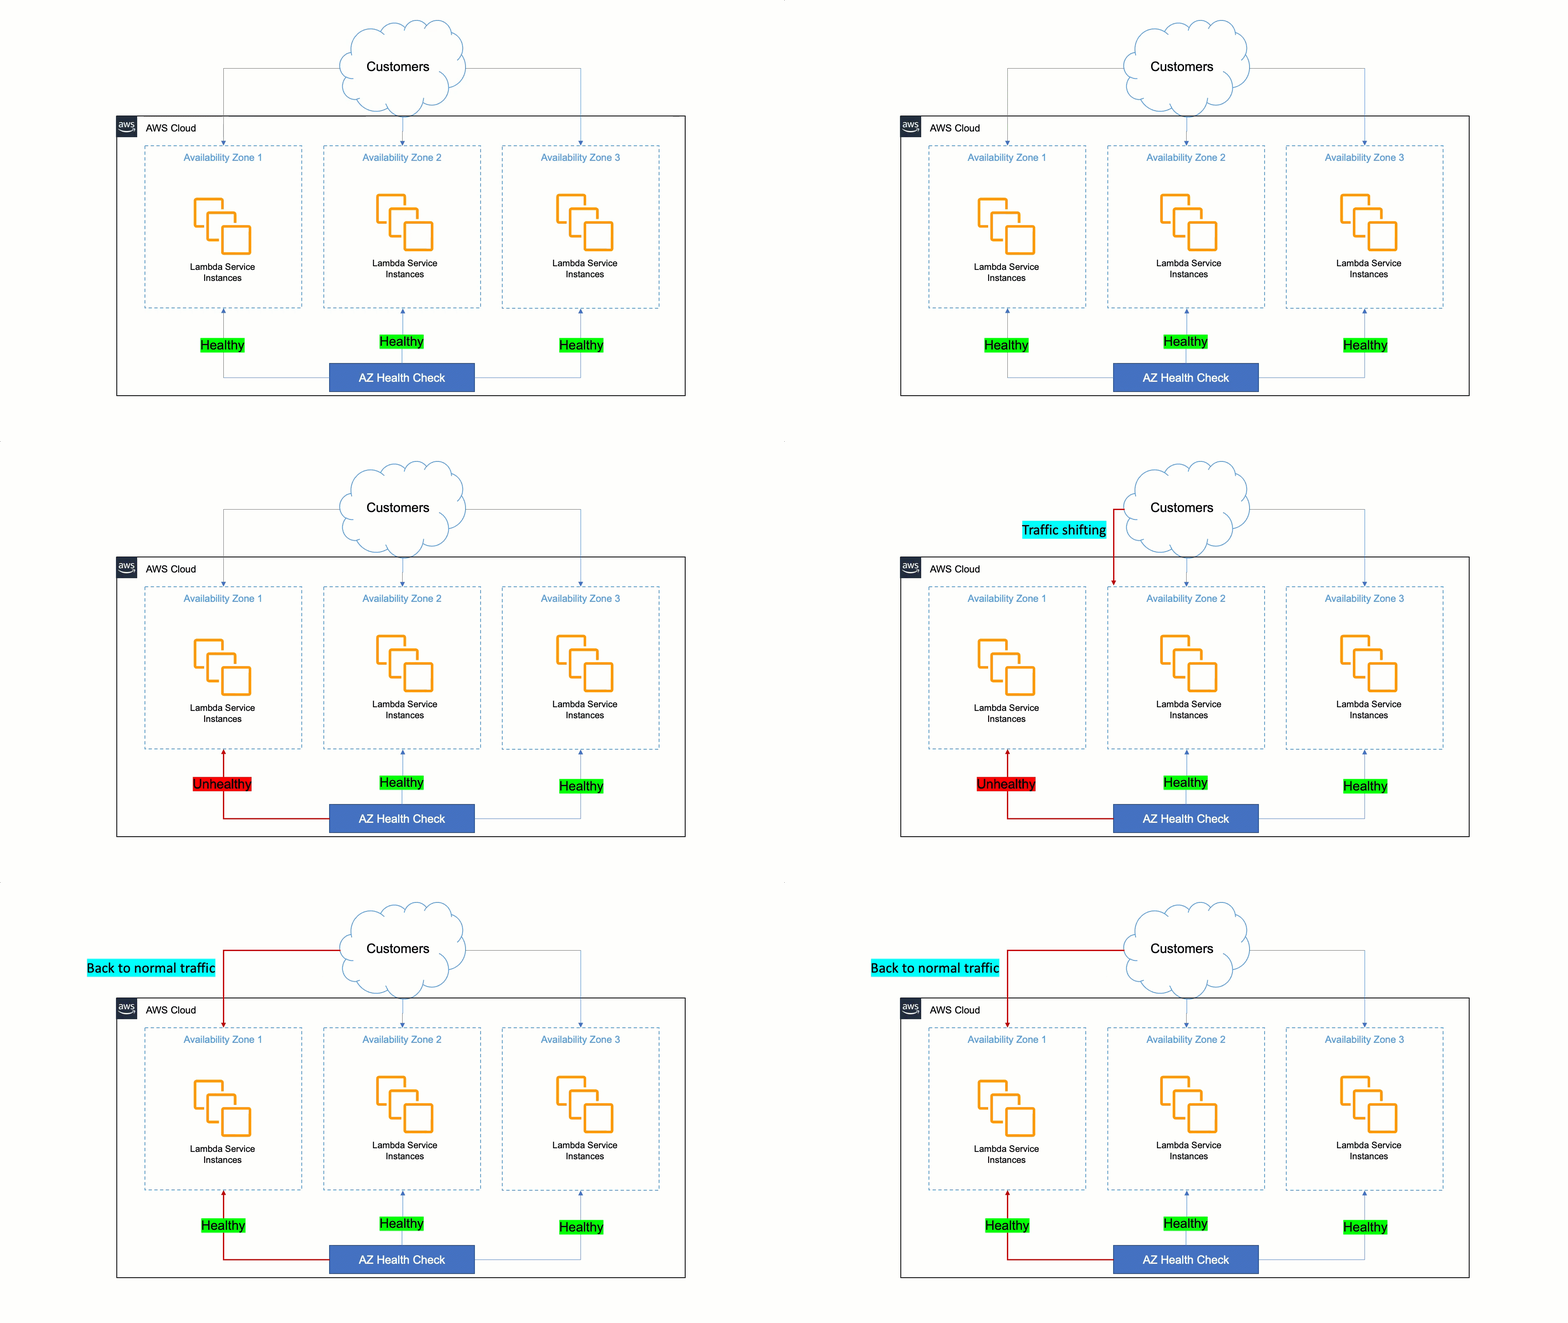
How AWS Lambda uses AWS FIS
To verify the automation continuously works as expected, Lambda performs a wide variety of tests, which includes Availability Zone failure testing in their pre-production environment. The main objective of these tests is to verify the services are statically stable in the presence of Availability Zone impairments, and to verify that the Availability Zone evacuation can be successfully initiated. The benefit of having an automated test is that teams can repeat it regularly and don’t need to have special skills. One click is all it takes to launch the test.
For these tests, Lambda uses AWS FIS to inject faults into their large fleet of EC2 instances. They use AWS FIS with support of the AWS System Manager (SSM) agent and resource filters to target their fleet of EC2 instances in a particular Availability Zone. This is a versatile approach that can inject resource faults, such as CPU and memory exhaustion, and networking faults, such as packet latency, loss, or drop.
Injecting packet loss or latency is very important, since these symptoms can have a serious impact on application and network performance. Indeed, latency and loss, even in small quantities, can create inefficiencies and prevent applications from running at their peak performance. For Lambda, being able to detect increased latency or loss before it affects customers is critical.
How to recover your applications rapidly from Availability Zones failures
You can build a similar solution to rapidly recover your applications from a zonal failure. The solution must have a mechanism to evacuate an impaired Availability Zone, a monitoring system that allows you to detect when a zonal replica is impaired, and a way to test the static stability of your system. AWS provides many tools and services that can help you build this solution to achieve Lambda’s resiliency strategy.
For performing Availability Zone evacuation, you can use the new zonal shift capability from Route 53 ARC, which at the time of writing is in preview. Zonal shift lets you evacuate an Availability Zone for applications that are uses Elastic Load Balancing. If you find out that a zonal replica is impaired or unhealthy, you can use zonal shift to evacuate the Availability Zone for a period of time, while the issue gets fixed.
For performing the zonal shift, you must detect when a zonal replica is unhealthy. Your application must provide a signal of its health per Availability Zone. There are two common ways to capture this signal. First, passively, you can check your metrics, like response times, HTTP status codes, and other metrics that can help track fatal errors in your applications. Or actively, using synthetic monitoring, which allows you to create synthetic requests against your production application to provide a more complete view of the customer experience.
Amazon CloudWatch Synthetics provides canaries, which are scripts that run on a schedule and perform synthetic requests in your application endpoints and APIs. Canaries perform the same actions as customers and continuously verify the customer experience. You can create a canary for each zonal replica of your application and monitor the results independently.
With this information, if the user experience diminishes in one of the replicas, you can start an Availability Zone evacuation using zonal shift and minimize the bad experience for the user while you find and fix the sources of the failure.
To ensure that you can successfully recover from a failure, you must test the solution in advance. Without testing, it is just an assumption. To prove or disprove your assumptions about your system’s capability to handle disruptive events such as issues within an Availability Zones, you can use FIS.
With FIS, you can inject faults simultaneously in multiple resources within the same failure domain, such as Availability Zones. FIS currently integrates with several AWS services including EC2, Amazon Elastic Kubernetes Service (Amazon EKS), Amazon Elastic Container Service (Amazon ECS), Amazon Relational Database Service (Amazon RDS), AWS Networking, and CloudWatch.
Typical use cases for testing a workload’s resilience to Availability Zones impairment are, for example, terminating all compute resources and databases within a particular Availability Zone, injecting latency or packet loss, increasing resource consumption (CPU, memory, and I/O) in compute resources in a particular Availability Zone, or impacting network communication within or between Availability Zones.
For more information and a step-by-step example of how to recover rapidly from application failures in a single Availability Zone and testing it with AWS FIS, read this blog post.
Conclusion
This article discusses static stability, a mechanism that is used by AWS services such as Lambda to build resilient Regional services. It also discusses how AWS takes advantage of the same services and infrastructure as customers. It shows how Lambda uses multiple Availability Zones and services like AWS FIS to build highly available services and improve its recovery time from unexpected failures to only a few minutes without human intervention. Finally, it shows a solution that you can implement for your applications to achieve Lambda’s resilience strategy.
To learn more about AWS FIS, there are many tutorials and a workshop you can check out.
For more serverless learning resources, visit Serverless Land.
This post is written by Swarna Kunnath (Cloud Application Architect), and Anand Komandooru (Sr. Cloud Application Architect).
This blog post shows how to republish messages that arrive from Internet of Things (IoT) devices across AWS accounts using a replatforming approach. A replatforming approach minimizes changes to the core application architecture, allowing an organization to reduce risk and meet business needs more quickly. In this post, you also learn how to track an IoT device’s location using the Amazon Location Service.
The example used in this post relates to an aviation company that has airplanes with line replacement unit devices or transponders. Transponders are IoT devices that send airplane geospatial data (location and altitude) to the AWS IoT Core service. The company’s airplane transponders send location data to the AWS IoT Core service provisioned in an existing AWS account (source account). The solution required manual intervention to track airplane location sent by the transponders.
They must rearchitect their application due to an internal reorganization event. As part of the rearchitecture approach, the business decides to enhance the application to process the transponder messages in another AWS account (destination account). In addition, the business needs full automation of the airplane’s location tracking process, to minimize the risk of the application changes, and to deliver the changes quickly.
Solution overview
The high-level solution republishes the IoT messages from the source account to the destination account using AWS IoT Core, Amazon SQS, AWS Lambda, and integrates the application with Amazon Location Service. IoT messages are replicated to an IoT topic in the destination account for downstream processing, minimizing changes to the original application architecture. Integration with Amazon Location Service automates the process of device location tracking and alert generation.
The AWS IoT platform allows you to connect your internet-enabled devices to the AWS Cloud via MQTT, HTTP, or WebSocket protocol. Once connected, the devices send data to the MQTT topics. Data ingested on MQTT topics is routed into AWS services (Amazon S3, SQS, Amazon DynamoDB, and Lambda) by configuring rules in the AWS IoT Rules Engine. The AWS IoT Rules Engine offers ways to define queries to format and filter messages published by these devices, and supports integration with several other AWS services as targets.
The Amazon Location Service lets you add geospatial data including capabilities such as maps, points of interest, geocoding, routing, geofences, and tracking. The tracker with geofence tracks the location of the device based on the geospatial data in the published IoT messages. Amazon Location Service generates enter and exit events and integrates with Amazon EventBridge and Amazon Simple Notification Service (Amazon SNS) to generate alerts based on defined filters in EventBridge rules.
The solution in this post delivers high availability, scalability, and cost efficiency by using serverless and managed services. The serverless services used by this solution also provide automatic scaling and built-in high availability. Integrating Amazon Location Service with AWS IoT and EventBridge helps to automate the auditing and processing of geospatial messages.
Solution architecture

These steps describe an end-to-end sequence of events:
- An IoT device (a transponder in an airplane) publishes a message to the AWS IoT Core service in the source account.
- The message arrives at an AWS IoT Core topic in the source account.
- AWS IoT Rules Engine receives the message and processes it, using IoT rules attached to the corresponding topic in the source account.
- An AWS IoT rule replicates the message to an SQS queue in the destination account.
- A Lambda function in the destination account polls the SQS queue and publishes received messages in batches to the destination account IoT topic.
- The Location action configured to the IoT rule sends the messages to Amazon Location Service tracker from the IoT topic.
- An Amazon Location tracker sends events when an IoT device enters or exits a linked geofence.
- EventBridge receives these events and, via the configured event rule, sends out SNS notifications for the configured devices.
Pre-requisites
This example has the following prerequisites:
- Access to the AWS services mentioned in this blog post within two AWS Accounts.
- A local install of AWS SAM CLI to build and deploy the sample code.
Solution walkthrough
To deploy this solution, first deploy IoT components via the AWS Serverless Application Model (AWS SAM), in the source and destination accounts. After, configure Amazon Location Service resources in the destination account. To learn more, visit the AWS SAM deployment documentation.
Deploying the code
Deploy the following AWS SAM templates in order:
- acct2-destination-iot-template.yaml: This creates an SQS queue in the destination account.
- acct1-source-iot-template.yaml: This configures the SQS queue created in the destination account. It’s a target to the IoT topic in the source account with appropriate cross account IAM access permissions.
To build and deploy the code, run:
sam build --template <TemplateName>.yamlsam deploy --guidedConfiguring a tracker
Amazon Location Trackers send device location updates that provide data to retrieve current and historical locations for devices.
Using Amazon Location Trackers and Amazon Location Geofences together, you can automatically evaluate the location updates from your IoT devices against your geofences to generate the geofence events. Actions could be taken to generate the alerts based on the areas of interest.
- Follow the instructions in the documentation to create the tracker resource from the AWS Management Console. Use this information for the new tracker:
- Name: Enter a unique name that has a maximum of 100 characters. For example, FlightTracker.
- Description: Enter an optional description. For example, Tracker for storing device positions.
- Configure a Location action to the destination IoT rule that receives messages from the destination IoT topic and publishes them in batches to the configured Tracker device (for example, FlightTracker). The parameters in the JSON data that is returned to the Location action can also be configured via substitution templates.
Geofence collection
Geofences contain points and vertices that form a closed boundary, which defines an area of interest. For example, flight origin and destination details. You can use tools, such as GeoJSON.io, to draw geofences and save the output as a GeoJSON file. Follow the instructions in the documentation to create the GeoJSON file and link it to the geofence collection.
- Create the geofence collection with a GeoJSON file and link it to the tracker you just created.
- Link the tracker to the geofence by following these instructions and start tracking the device’s location updates. You can link them together so that you automatically evaluate location updates against all your geofences. You can evaluate device positions against geofences on demand as well.
When device positions are evaluated against geofences, they generate events. For example, when a plane enters or exits a location specified in the geofence.
You can configure EventBridge with rules to react to these events. You can set up SNS to notify your clients when a specific tracker device location changes. Follow the instructions in the documentation on how to set up EventBridge rules to integrate with Amazon Location Service events.
Testing the solution
You can test the first part of the solution by sending an IoT message with location details in the JSON format from the source account and verify that the message arrives at the destination account SQS queue. Detailed instructions to publish a test message from the source account that includes location information (latitude and longitude) can be found here.
Messages from the destination account SQS queue are published to the Amazon Location Service Tracker. When the location in the test message matches the criteria provided in the geofence, Amazon Location Service generates an event. EventBridge has a rule configured that gets matched when an Amazon Location tracker event arrives, and the rule target is an SNS topic that sends an email or text message to the client.
Cleaning up
To avoid incurring future charges, delete the CloudFormation stacks, location tracker, and geofence collection created as part of the solution walk-through. Replace the resource identifiers in the following commands with the ID/name of the resources.
- Delete the SAM application stack:
aws cloudformation delete-stack --stack-name <StackName>Refer to this documentation for further information.
- Delete the location tracker:
aws location delete-tracker --tracker-name <TrackerName> - Delete the geofence collection:
aws location delete-geofence-collection --collection-name <GeoCollectionName>
Conclusion
This blog post shows how to create a serverless solution for cross account IoT message publishing and tracking device location updates using Amazon Location Service.
It describes the process of how to publish AWS IoT messages across multiple accounts. Integration with the Amazon Location Service shows how to track IoT device location updates and generate alerts, alleviating the need for manual device location tracking.
For more serverless learning resources, visit Serverless Land.
This blog post is written by Solutions Architects John Lee and Jeetendra Vaidya.
AWS Lambda now provides a way to control the maximum number of concurrent functions invoked by Amazon SQS as an event source. You can use this feature to control the concurrency of Lambda functions processing messages in individual SQS queues.
This post describes how to set the maximum concurrency of SQS triggers when using SQS as an event source with Lambda. It also provides an overview of the scaling behavior of Lambda using this architectural pattern, challenges this feature helps address, and a demo of the maximum concurrency feature.
Overview
Lambda uses an event source mapping to process items from a stream or queue. The event source mapping reads from an event source, such as an SQS queue, optionally filters the messages, batches them, and invokes the mapped Lambda function.
The scaling behavior for Lambda integration with SQS FIFO queues is simple. A single Lambda function processes batches of messages within a single message group to ensure that messages are processed in order.
For SQS standard queues, the event source mapping polls the queue to consume incoming messages, starting at five concurrent batches with five functions at a time. As messages are added to the SQS queue, Lambda continues to scale out to meet demand, adding up to 60 functions per minute, up to 1,000 functions, to consume those messages. To learn more about Lambda scaling behavior, read ”Understanding how AWS Lambda scales with Amazon SQS standard queues.”

Lambda processing standard SQS queues
Challenges
When a large number of messages are in the SQS queue, Lambda scales out, adding additional functions to process the messages. The scale out can consume the concurrency quota in the account. To prevent this from happening, you can set reserved concurrency for individual Lambda functions. This ensures that the specified Lambda function can always scale to that much concurrency, but it also cannot exceed this number.
When the Lambda function concurrency reaches the reserved concurrency limit, the queue configuration specifies the subsequent behavior. The message is returned to the queue and retried based on the redrive policy, expired based on its retention policy, or sent to another SQS dead-letter queue (DLQ). While sending unprocessed messages to a DLQ is a good option to preserve messages, it requires a separate mechanism to inspect and process messages from the DLQ.
The following example shows a Lambda function reaching its reserved concurrency quota of 10.

Lambda reaching reserved concurrency of 10.
Maximum Lambda concurrency with SQS as an event source
The launch of maximum concurrency for SQS as an event source allows you to control Lambda function concurrency per source. You set the maximum concurrency on the event source mapping, not on the Lambda function.
This event source mapping setting does not change the scaling or batching behavior of Lambda with SQS. You can continue to batch messages with a customized batch size and window. It rather sets a limit on the maximum number of concurrent function invocations per SQS event source. Once Lambda scales and reaches the maximum concurrency configured on the event source, Lambda stops reading more messages from the queue. This feature also provides you with the flexibility to define the maximum concurrency for individual event sources when the Lambda function has multiple event sources.
Maximum concurrency is set to 10 for the SQS queue.
This feature can help prevent a Lambda function from consuming all available Lambda concurrency of the account and avoids messages returning to the queue unnecessarily because of Lambda functions being throttled. It provides an easier way to control and consume messages at a desired pace, controlled by the maximum number of concurrent Lambda functions.
The maximum concurrency setting does not replace the existing reserved concurrency feature. Both serve distinct purposes and the two features can be used together. Maximum concurrency can help prevent overwhelming downstream systems and unnecessary throttled invocations. Reserved concurrency guarantees a maximum number of concurrent instances for the function.
When used together, the Lambda function can have its own allocated capacity (reserved concurrency), while being able to control the throughput for each event source (maximum concurrency). When using the two features together, you must set the function reserved concurrency higher than the maximum concurrency on the SQS event source mapping to prevent throttling.
Setting maximum concurrency for SQS as an event source
You can configure the maximum concurrency for an SQS event source through the AWS Management Console, AWS Command Line Interface (CLI), or infrastructure as code tools such as AWS Serverless Application Model (AWS SAM). The minimum supported value is 2 and the maximum value is 1000. Refer to the Lambda quotas documentation for the latest limits.

Configuring the maximum concurrency for an SQS trigger in the console
You can set the maximum concurrency through the create-event-source-mapping AWS CLI command.
aws lambda create-event-source-mapping --function-name my-function --ScalingConfig {MaxConcurrency=2} --event-source-arn arn:aws:sqs:us-east-2:123456789012:my-queueSeeing the maximum concurrency setting in action
The following demo compares Lambda receiving and processes messages differently when using maximum concurrency compared to reserved concurrency.
This GitHub repository contains an AWS SAM template that deploys the following resources:
- ReservedConcurrencyQueue (SQS queue)
- ReservedConcurrencyDeadLetterQueue (SQS queue)
- ReservedConcurrencyFunction (Lambda function)
- MaxConcurrencyQueue (SQS queue)
- MaxConcurrencyDeadLetterQueue (SQS queue)
- MaxConcurrencyFunction (Lambda function)
- CloudWatchDashboard (CloudWatch dashboard)
The AWS SAM template provisions two sets of identical architectures and an Amazon CloudWatch dashboard to monitor the resources. Each architecture comprises a Lambda function receiving messages from an SQS queue, and a DLQ for the SQS queue.
The maxReceiveCount is set as 1 for the SQS queues, which sends any returned messages directly to the DLQ. The ReservedConcurrencyFunction has its reserved concurrency set to 5, and the MaxConcurrencyFunction has the maximum concurrency for the SQS event source set to 5.
Pre-requisites
Running this demo requires the AWS CLI and the AWS SAM CLI. After installing both CLIs, clone this GitHub repository and navigate to the root of the directory:
git clone https://github.com/aws-samples/aws-lambda-amazon-sqs-max-concurrencycd aws-lambda-amazon-sqs-max-concurrencyDeploying the AWS SAM template
- Build the AWS SAM template with the build command to prepare for deployment to your AWS environment.
- Use the guided deploy command to deploy the resources in your account.
- Give the stack a name and accept the remaining default values. Once deployed, you can track the progress through the CLI or by navigating to the AWS CloudFormation page in the AWS Management Console.
- Note the queue URLs from the Outputs tab in the AWS SAM CLI, CloudFormation console, or navigate to the SQS console to find the queue URLs.
sam buildsam deploy --guided
The Outputs tab of the launched AWS SAM template provides URLs to CloudWatch dashboard and SQS queues.
Running the demo
The deployed Lambda function code simulates processing by sleeping for 10 seconds before returning a 200 response. This allows the function to reach a high function concurrency number with only a small number of messages.
To add 25 messages to the Reserved Concurrency queue, run the following commands. Replace <ReservedConcurrencyQueueURL> with your queue URL from the AWS SAM Outputs.
for i in {1..25}; do aws sqs send-message --queue-url <ReservedConcurrencyQueueURL> --message-body testing; done To add 25 messages to the Maximum Concurrency queue, run the following commands. Replace <MaxConcurrencyQueueURL> with your queue URL from the AWS SAM Outputs.
for i in {1..25}; do aws sqs send-message --queue-url <MaxConcurrencyQueueURL> --message-body testing; done After sending messages to both queues, navigate to the dashboard URL available in the Outputs tab to view the CloudWatch dashboard.
Validating results
Both Lambda functions have the same number of invocations and the same concurrent invocations fixed at 5. The CloudWatch dashboard shows the ReservedConcurrencyFunction experienced throttling and 9 messages, as seen in the top-right metric, were sent to the corresponding DLQ. The MaxConcurrencyFunction did not experience any throttling and messages were not delivered to the DLQ.

CloudWatch dashboard showing throttling and DLQs.
Clean up
To remove all the resources created in this demo, use the delete command and follow the prompts:
sam deleteConclusion
You can now control the maximum number of concurrent functions invoked by SQS as a Lambda event source. This post explains the scaling behavior of Lambda using this architectural pattern, challenges this feature helps address, and a demo of maximum concurrency in action.
There are no additional charges to use this feature besides the standard SQS and Lambda charges. You can start using maximum concurrency for SQS as an event source with new or existing event source mappings by connecting it with SQS. This feature is available in all Regions where Lambda and SQS are available.
For more serverless learning resources, visit Serverless Land.
This blog post is written by Isha Dua Sr. Solutions Architect AWS, Ananth Kommuri Solutions Architect AWS, and Dr. Sam Mokhtari Sr. Sustainability Lead SA WA for AWS.
Today, more than ever, sustainability and cost-savings are top of mind for nearly every organization. Research has shown that AWS’ infrastructure is 3.6 times more energy efficient than the median of U.S. enterprise data centers and up to five times more energy efficient than the average in Europe. That said, simply migrating to AWS isn’t enough to meet the Environmental, Social, Governance (ESG) and Cloud Financial Management (CFM) goals that today’s customers are setting. In order to make conscious use of our planet’s resources, applications running on the cloud must be built with efficiency in mind.
That’s because cloud sustainability is a shared responsibility. At AWS, we’re responsible for optimizing the sustainability of the cloud – building efficient infrastructure, enough options to meet every customer’s needs, and the tools to manage it all effectively. As an AWS customer, you’re responsible for sustainability in the cloud – building workloads in a way that minimizes the total number of resource requirements and makes the most of what must be consumed.
Most AWS service charges are correlated with hardware usage, so reducing resource consumption also has the added benefit of reducing costs. In this blog post, we’ll highlight best practices for running efficient compute environments on AWS that maximize utilization and decrease waste, with both sustainability and cost-savings in mind.
First: Measure What Matters
Application optimization is a continuous process, but it has to start somewhere. The AWS Well Architected Framework Sustainability pillar includes an improvement process that helps customers map their journey and understand the impact of possible changes. There is a saying “you can’t improve what you don’t measure.”, which is why it’s important to define and regularly track metrics which are important to your business. Scope 2 Carbon emissions, such as those provided by the AWS Customer Carbon Footprint Tool, are one metric that many organizations use to benchmark their sustainability initiatives, but they shouldn’t be the only one.
Even after AWS meets our 2025 goal of powering our operations with 100% renewable energy, it’s still be important to maximize the utilization and minimize the consumption of the resources that you use. Just like installing solar panels on your house, it’s important to limit your total consumption to ensure you can be powered by that energy. That’s why many organizations use proxy metrics such as vCPU Hours, storage usage, and data transfer to evaluate their hardware consumption and measure improvements made to infrastructure over time.
In addition to these metrics, it’s helpful to baseline utilization against the value delivered to your end-users and customers. Tracking utilization alongside business metrics (orders shipped, page views, total API calls, etc) allows you to normalize resource consumption with the value delivered to your organization. It also provides a simple way to track progress towards your goals over time. For example, if the number of orders on your ecommerce site remained constant over the last month, but your AWS infrastructure usage decreased by 20%, you can attribute the efficiency gains to your optimization efforts, not changes in your customer behavior.
Utilize all of the available pricing models
Compute tasks are the foundation of many customers’ workloads, so it typically sees biggest benefit by optimization. Amazon EC2 provides resizable compute across a wide variety of compute instances, is well-suited to virtually every use case, is available via a number of highly flexible pricing options. One of the simplest changes you can make to decrease your costs on AWS is to review the purchase options for the compute and storage resources that you already use.
Amazon EC2 provides multiple purchasing options to enable you to optimize your costs based on your needs. Because every workload has different requirements, we recommend a combination of purchase options tailored for your specific workload needs. For steady-state workloads that can have a 1-3 year commitment, using Compute Savings Plans helps you save costs, move from one instance type to a newer, more energy-efficient alternative, or even between compute solutions (e.g., from EC2 instances to AWS Lambda functions, or AWS Fargate).
EC2 Spot instances are another great way to decrease cost and increase efficiency on AWS. Spot Instances make unused Amazon EC2 capacity available for customers at discounted prices. At AWS, one of our goals it to maximize utilization of our physical resources. By choosing EC2 Spot instances, you’re running on hardware that would otherwise be sitting idle in our datacenters. This increases the overall efficiency of the cloud, because more of our physical infrastructure is being used for meaningful work. Spot instances use market-based pricing that changes automatically based on supply and demand. This means that the hardware with the most spare capacity sees the highest discounts, sometimes up to XX% off on-demand prices, to encourage our customers to choose that configuration.
Savings Plans are ideal for predicable, steady-state work. On-demand is best suited for new, stateful, and spiky workloads which can’t be instance, location, or time flexible. Finally, Spot instances are a great way to supplement the other options for applications that are fault tolerant and flexible. AWS recommends using a mix of pricing models based on your workload needs and ability to be flexible.

By using these pricing models, you’re creating signals for your future compute needs, which helps AWS better forecast resource demands, manage capacity, and run our infrastructure in a more sustainable way.
Choose efficient, purpose-built processors whenever possible
Choosing the right processor for your application is as equally important consideration because under certain use cases a more powerful processor can allow for the same level of compute power with a smaller carbon footprint. AWS has the broadest choice of processors, such as Intel – Xeon scalable processors, AMD – AMD EPYC processors, GPU’s FPGAs, and Custom ASICs for Accelerated Computing.
AWS Graviton3, AWS’s latest and most power-efficient processor, delivers 3X better CPU performance per-watt than any other processor in AWS, provides up to 40% better price performance over comparable current generation x86-based instances for various workloads, and helps customers reduce their carbon footprint. Consider transitioning your workload to Graviton-based instances to improve the performance efficiency of your workload (see AWS Graviton Fast Start and AWS Graviton2 for ISVs). Note the considerations when transitioning workloads to AWS Graviton-based Amazon EC2 instances.
For machine learning (ML) workloads, use Amazon EC2 instances based on purpose-built Amazon Machine Learning (Amazon ML) chips, such as AWS Trainium, AWS Inferentia, and Amazon EC2 DL1.
Optimize for hardware utilization
The goal of efficient environments is to use only as many resources as required in order to meet your needs. Thankfully, this is made easier on the cloud because of the variety of instance choices, the ability to scale dynamically, and the wide array of tools to help track and optimize your cloud usage. At AWS, we offer a number of tools and services that can help you to optimize both the size of individual resources, as well as scale the total number of resources based on traffic and load.
Two of the most important tools to measure and track utilization are Amazon CloudWatch and the AWS Cost & Usage Report (CUR). With CloudWatch, you can get a unified view of your resource metrics and usage, then analyze the impact of user load on capacity utilization over time. The Cost & Usage Report (CUR) can help you understand which resources are contributing the most to your AWS usage, allowing you to fine-tune your efficiency and save on costs. CUR data is stored in S3, which allows you to query it with tools like Amazon Athena or generate custom reports in Amazon QuickSight or integrate with AWS Partner tools for better visibility and insights.
An example of a tool powered by CUR data is the AWS Cost Intelligence Dashboard. The Cost Intelligence Dashboard provides a detailed, granular, and recommendation-driven view of your AWS usage. With its prebuilt visualizations, it can help you identify which service and underlying resources are contributing the most towards your AWS usage, and see the potential savings you can realize by optimizing. It even provides right sizing recommendations and the appropriate EC2 instance family to help you optimize your resources.
Cost Intelligence Dashboard is also integrated with AWS Compute Optimizer, which makes instance type and size recommendations based on workload characteristics. For example, it can identify if the workload is CPU-intensive, if it exhibits a daily pattern, or if local storage is accessed frequently. Compute Optimizer then infers how the workload would have performed on various hardware platforms (for example, Amazon EC2 instance types) or using different configurations (for example, Amazon EBS volume IOPS settings, and AWS Lambda function memory sizes) to offer recommendations. For stable workloads, check AWS Compute Optimizer at regular intervals to identify right-sizing opportunities for instances. By right sizing with Compute Optimizer, you can increase resource utilization and reduce costs by up to 25%. Similarly, Lambda Power Tuning can help choose the memory allocated to Lambda functions is an optimization process that balances speed (duration) and cost while lowering your carbon emission in the process.
CloudWatch metrics are used to power EC2 Autoscaling, which can automatically choose the right instance to fit your needs with attribute-based instance selection and scale your entire instance fleet up and down based on demand in order to maintain high utilization. AWS Auto Scaling makes scaling simple with recommendations that let you optimize performance, costs, or balance between them. Configuring and testing workload elasticity will help save money, maintain performance benchmarks, and reduce the environmental impact of workloads. You can utilize the elasticity of the cloud to automatically increase the capacity during user load spikes, and then scale down when the load decreases. Amazon EC2 Auto Scaling allows your workload to automatically scale up and down based on demand. You can set up scheduled or dynamic scaling policies based on metrics such as average CPU utilization or average network in or out. Then, you can integrate AWS Instance Scheduler and Scheduled scaling for Amazon EC2 Auto Scaling to schedule shut downs and terminate resources that run only during business hours or on weekdays to further reduce your carbon footprint.
Design applications to minimize overhead and use fewer resources
Using the latest Amazon Machine Image (AMI) gives you updated operating systems, packages, libraries, and applications, which enable easier adoption as more efficient technologies become available. Up-to-date software includes features to measure the impact of your workload more accurately, as vendors deliver features to meet their own sustainability goals.
By reducing the amount of equipment that your company has on-premises and using managed services, you can help facilitate the move to a smaller, greener footprint. Instead of buying, storing, maintaining, disposing of, and replacing expensive equipment, businesses can purchase services as they need that are already optimized with a greener footprint. Managed services also shift responsibility for maintaining high average utilization and sustainability optimization of the deployed hardware to AWS. Using managed services will help distribute the sustainability impact of the service across all of the service tenants, thereby reducing your individual contribution. The following services help reduce your environmental impact because capacity management is automatically optimized.
| AWS Managed Service | Recommendation for sustainability improvement |
| You can use Amazon Aurora Serverless to automatically start up, shut down, and scale capacity up or down based on your application’s needs. | |
| You can use Amazon Redshift Serverless to run and scale data warehouse capacity. | |
| You can Migrate AWS Lambda functions to Arm-based AWS Graviton2 processors. | |
| You can run Amazon ECS on AWS Fargate to avoid the undifferentiated heavy lifting by leveraging sustainability best practices AWS put in place for management of the control plane. | |
| You can use EMR Serverless to avoid over- or under-provisioning resources for your data processing jobs. | |
| You can use Auto-scaling for AWS Glue to enable on-demand scaling up and scaling down of the computing resources. |
Centralized data centers consume a lot of energy, produce a lot of carbon emissions and cause significant electronic waste. While more data centers are moving towards green energy, an even more sustainable approach (alongside these so-called “green data centers”) is to actually cut unnecessary cloud traffic, central computation and storage as much as possible by shifting computation to the edge. Edge Computing stores and uses data locally, on or near the device it was created on. This reduces the amount of traffic sent to the cloud and, at scale, can limit the overall energy used and carbon emissions.
Use storage that best supports how your data is accessed and stored to minimize the resources provisioned while supporting your workload. Solid state devices (SSDs) are more energy intensive than magnetic drives and should be used only for active data use cases. You should look into using ephemeral storage whenever possible and categorize, centralize, deduplicate, and compress persistent storage.
AWS Outposts, AWS Local Zones and AWS Wavelength services deliver data processing, analysis, and storage close to your endpoints, allowing you to deploy APIs and tools to locations outside AWS data centers. Build high-performance applications that can process and store data close to where it’s generated, enabling ultra-low latency, intelligent, and real-time responsiveness. By processing data closer to the source, edge computing can reduce latency, which means that less energy is required to keep devices and applications running smoothly. Edge computing can help to reduce the carbon footprint of data centers by using renewable energy sources such as solar and wind power.
Conclusion
In this blog post, we discussed key methods and recommended actions you can take to optimize your AWS compute infrastructure for resource efficiency. Using the appropriate EC2 instance types with the right size, processor, instance storage and pricing model can enhance the sustainability of your applications. Use of AWS managed services, options for edge computing and continuously optimizing your resource usage can further improve the energy efficiency of your workloads. You can also analyze the changes in your emissions over time as you migrate workloads to AWS, re-architect applications, or deprecate unused resources using the Customer Carbon Footprint Tool.
Ready to get started? Check out the AWS Sustainability page to find out more about our commitment to sustainability and learn more about renewable energy usage, case studies on sustainability through the cloud, and more.
This blog is written by Mark Rogers, SDE II – Customer Engineering AWS.
In part 1, I showed you how to run Apache CloudStack with KVM on a single Amazon Elastic Compute Cloud (Amazon EC2) instance. That simple setup is great for experimentation and light workloads. In this post, things will get a lot more interesting. I’ll show you how to create an overlay network in your Amazon Virtual Private Cloud (Amazon VPC) that allows CloudStack to scale horizontally across multiple EC2 instances. This same method could work with other hypervisors, too.
If you haven’t read it yet, then start with part 1. It explains why this network setup is necessary. The same prerequisites apply to both posts.
Making things easier
I wrote some scripts to automate the CloudStack installation and OS configuration on CentOS 7. You can customize them to meet your needs. I also wrote some AWS CloudFormation templates you can copy in order to create a demo environment. The README file has more details.
The scalable method
Our team started out using a single EC2 instance, as described in my last post. That worked at first, but it didn’t have the capacity we needed. We were limited to a couple of dozen VMs, but we needed hundreds. We also needed to scale up and down as our needs changed. This meant we needed the ability to add and remove CloudStack hosts. Using a Linux bridge as a virtual subnet was no longer adequate.
To support adding hosts, we need a subnet that spans multiple instances. The solution I found is Virtual Extensible LAN (VXLAN). It’s lightweight, easy to configure, and included in the Linux kernel. VXLAN creates a layer 2 overlay network that abstracts away the details of the underlying network. It allows machines in different parts of a network to communicate as if they’re all attached to the same simple network switch.
Another example of an overlay network is an Amazon VPC. It acts like a physical network, but it’s actually a layer on top of other networks. It’s networks all the way down. VXLAN provides a top layer where CloudStack can sit comfortably, handling all of your VM needs, blissfully unaware of the world below it.
An overlay network comes with some big advantages. The biggest improvement is that you can have multiple hosts, allowing for horizontal scaling. Having more hosts not only gives you more computing power, but also lets you do rolling maintenance. Instead of putting the database and file storage on the management server, I’ll show you how to use Amazon Elastic File System (Amazon EFS) and Amazon Relational Database Service (Amazon RDS) for scalable and reliable storage.
EC2 Instances
Let’s start with three Amazon EC2 instances. One will be a router between the overlay network and your Amazon VPC, the second one will be your CloudStack management server, and the third one will be your VM host. You’ll also need a way to connect to your instances, such as a bastion host or a VPN endpoint.
 VXLAN must send and receive multicast traffic. Only Nitro instances can be multicast senders. As you plan, look at the list of Nitro instance types.
The router won’t need much computing power, but it will need enough network bandwidth to meet your needs. If you put Amazon EFS in the same subnet as your instances, then they’ll communicate with it directly, thereby reducing the load on the router. Decide how much network throughput you want, and then pick a suitable Nitro instance type.
After creating the router instance, configure AWS to use it as a router. Stop source/destination checking in the instance’s network settings. Then update the applicable AWS route tables to use the router as the target for the overlay network. The router’s security group needs to allow ingress to the CloudStack UI (TCP port 8080) and any services you plan to offer from VMs.
For the management server, you’ll want a Nitro instance type. It’s going to use more CPU than your router, so plan accordingly.
In addition to being a Nitro type, the host instance must also be a metal type. Metal instances have hardware virtualization support, which is needed by KVM. If you have a new AWS account with a low on-demand vCPU limit, then consider starting with an m5zn.metal, which has 48 vCPUs. Otherwise, I suggest going directly to a c5.metal because it provides 96 vCPUs for a similar price. There are bigger types available depending on your compute needs, budget, and vCPU limit. If your account’s on-demand vCPU limit is too low, then you can file a support ticket to have it raised.
Networking
All of the instances should be on a dedicated subnet. Sharing the subnet with other instances can cause communication issues. For an example, refer to the following figure. The subnet has an instance named TroubleMaker that’s not on the overlay network. If TroubleMaker sends a request to the management instance’s overlay network address, then here’s what happens:
- The request goes through the AWS subnet to the router.
- The router forwards the request via the overlay network.
- The CloudStack management instance has a connection to the same AWS subnet that TroubleMaker is on. Therefore, it responds directly instead of using the router. This isn’t the return path that AWS is expecting, so the response is dropped.

If you move TroubleMaker to a different subnet, then the requests and responses will all go through the router. That will fix the communication issues.
The instances in the overlay network will use special interfaces that serve as VXLAN tunnel endpoints (VTEPs). The VTEPs must know how to contact each other via the underlay network. You could manually give each instance a list of all of the other instances, but that’s a maintenance nightmare. It’s better to let the VTEPs discover each other, which they can do using multicast. You can add multicast support using AWS Transit Gateway.
Here are the steps to make VXLAN multicasts work:
- Enable multicast support when you create the transit gateway.
- Attach the transit gateway to your subnet.
- Create a transit gateway multicast domain with IGMPv2 support enabled.
- Associate the multicast domain with your subnet.
- Configure the eth0 interface on each instance to use IGMPv2. The following sample code shows how to do this.
- Make sure that your instance security groups allow ingress for IGMP queries (protocol 2 traffic from 0.0.0.0/32) and VXLAN traffic (UDP port 4789 from the other instances).
CloudStack VMs must connect to the same bridge as the VXLAN interface. As mentioned in the previous post, CloudStack cares about names. I recommend giving the interface a name starting with “eth”. Moreover, this naming convention tells CloudStack which bridge to use, thereby avoiding the need for a dummy interface like the one in the simple setup.
The following snippet shows how I configured the networking in CentOS 7. You must provide values for these variables:
$overlay\_host\_ip\_address,$overlay\_netmask, and$overlay\_gateway\_ip: Use values for the overlay network that you’re creating.$dns\_address: I recommend using the base of the VPC IPv4 network range, plus two. You shouldn’t use 169.654.169.253 because CloudStack reserves link-local addresses for its own use.$multicast\_address: The multicast address that you want VXLAN to use. Pick something in the multicast range that won’t conflict with anything else. I recommend choosing from the IPv4 local scope (239.255.0.0/16).$interface\_name: The name of the interface VXLAN should use to communicate with the physical network. This is typically eth0.
A couple of the steps are different for the router instance than for the other instances. Pay attention to the comments!
yum install -y bridge-utils net-tools# IMPORTANT: Omit the GATEWAY setting on the router instance!cat << EOF > /etc/sysconfig/network-scripts/ifcfg-cloudbr0DEVICE=cloudbr0TYPE=BridgeONBOOT=yesBOOTPROTO=noneIPV6INIT=noIPV6\_AUTOCONF=noDELAY=5STP=noUSERCTL=noNM\_CONTROLLED=noIPADDR=$overlay\_host\_ip\_addressNETMASK=$overlay\_netmaskDNS1=$dns\_addressGATEWAY=$overlay\_gateway\_ipEOFcat << EOF > /sbin/ifup-local#!/bin/bash# Set up VXLAN once cloudbr0 is available.if [[ \$1 == "cloudbr0" ]]then ip link add ethvxlan0 type vxlan id 100 dstport 4789 group "$multicast\_address" dev "$interface\_name" brctl addif cloudbr0 ethvxlan0 ip link set up dev ethvxlan0fiEOFchmod +x /sbin/ifup-local# Transit Gateway requires IGMP version 2echo "net.ipv4.conf.$interface\_name.force\_igmp\_version=2" >> /etc/sysctl.confsysctl -p# Enable IPv4 forwarding# IMPORTANT: Only do this on the router instance!echo 'net.ipv4.ip\_forward=1' >> /etc/sysctl.confsysctl -p# Restart the network service to make the changes take effect.systemctl restart network
Storage
Let’s look at storage. Create an Amazon RDS database using the MySQL 8.0 engine, and set a master password for CloudStack’s database setup tool to use. Refer to the CloudStack documentation to find the MySQL settings that you’ll need. You can put the settings in an RDS parameter group. In case you’re wondering why I’m not using Amazon Aurora, it’s because CloudStack needs the MyISAM storage engine, which isn’t available in Aurora.
I recommend Amazon EFS for file storage. For efficiency, create a mount target in the subnet with your EC2 instances. That will enable them to communicate directly with the mount target, thereby bypassing the overlay network and router. Note that the system VMs will use Amazon EFS via the router.
If you want, you can consolidate your CloudStack file systems. Just create a single file system with directories for each zone and type of storage. For example, I use directories named /zone1/primary, /zone1/secondary, /zone2/primary, etc. You should also consider enabling provisioned throughput on the file system, or you may run out of bursting credits after booting a few VMs.
One consequence of the file system’s scalability is that the amount of free space (8 exabytes) will cause an integer overflow in CloudStack! To avoid this problem, reduce storage.overprovisioning.factor in CloudStack’s global settings from 2 to 1.
When your environment is ready, install CloudStack. When it asks for a default gateway, remember to use the router’s overlay network address. When you add a host, make sure that you use the host’s overlay network IP address.
Cleanup
If you used my CloudFormation template, delete the stack and remove any route table entries you added.
If you didn’t use CloudFormation, here are the things to delete:
- The CloudStack EC2 instances
- The Amazon RDS database and parameter group
- The Amazon EFS file system
- The transit gateway multicast domain subnet association
- The transit gateway multicast domain
- The transit gateway VPC attachment
- The transit gateway
- The route table entries that you created
- The security groups that you created for the instances, database, and file system
Conclusion
The approach I shared has many steps, but they’re not bad when you have a plan. Whether you need a simple setup for experiments, or you need a scalable environment for a data center migration, you now have a path forward. Give it a try, and comment here about the things you learned. I hope you find it useful and fun!
“Apache”, “Apache CloudStack”, and “CloudStack” are trademarks of the Apache Software Foundation.
This blog is written by Mark Rogers, SDE II – Customer Engineering AWS.
How do you put a cloud inside another cloud? Some features that make Amazon Elastic Compute Cloud (Amazon EC2) secure and wonderful also make running CloudStack difficult. The biggest obstacle is that AWS and CloudStack both want to manage network resources. Therefore, we must keep them out of each other’s way. This requires some steps that aren’t obvious, and it took a long time to figure out. I’m going to share what I learned, so that you can navigate the process more easily.
Apache CloudStack is an open-source platform for deploying and managing virtual machines (VMs) and the associated network and storage infrastructure. You would normally run it on your own hardware to create your own cloud. But there can be advantages to running it inside of an Amazon Virtual Private Cloud (Amazon VPC), including how it could help you migrate out of a data center. It’s a great way to create disposable environments for experiments or training. Furthermore, it’s a convenient way to test-drive the new CloudStack support in Amazon Elastic Kubernetes Service (Amazon EKS) Anywhere. In my case, I needed to create development and test environments for a project that uses the CloudStack API. The environments needed to be shared and scalable. Our build pipelines were already in AWS, so it made sense to put the new environments there, too.
CloudStack can work with a number of hypervisors. The instructions in this article will use Kernel-based Virtual Machine (KVM) on Linux. KVM will manage the VMs at a low level, and CloudStack will manage KVM.
Prerequisites
Most of the information in this article should be applicable to a range of CloudStack versions. I targeted CloudStack 4.14 on CentOS 7. I also tested CloudStack versions 4.16 and 4.17, and I recommend them.
The official CentOS 7 x86\_64 HVM image works well. If you use a different Linux flavor or version, then you might have to modify some of the implementation details.
You’ll need to know the basics of CloudStack. The scope of this article is making CloudStack and AWS coexist peacefully. Once CloudStack is running, I’m assuming that you’ll handle things from there. Refer to the AWS documentation and CloudStack documentation for information on security and other best practices.
Making things easier
I wrote some scripts to automate the installation. You can run them on EC2 instances with CentOS 7, and they’ll do all the installation and OS configuration for you. You can use them as they are, or customize them to meet your needs. I also wrote some AWS CloudFormation templates you can copy in order to create a demo environment. The README file has more details.
Amazon EC2 instance types
KVM requires hardware virtualization support. Most EC2 instances are VMs that don’t support nested virtualization. To get access to the bare hardware, you need a metal instance type.
I like c5.metal because it’s one of the least expensive metal types, and has a low cost per vCPU. It has 96 vCPUs and 192 GiB of memory. If you run 20 VMs on it, with 4 CPU cores and 8 GiB of memory each, then you’d still have 16 vCPUs and 32 GiB to share between the operating system, CloudStack, and MySQL. Using CloudStack’s overprovisioning feature, you could fit even more VMs if they’re running light loads.
Networking
The biggest challenge is the network. AWS knows which IP and MAC addresses should exist, and it knows the machines to which they should belong. It blocks any traffic that doesn’t fit its idea of how the network should behave. Simultaneously, CloudStack assumes that any IP or MAC address it invents should work just fine. When CloudStack assigns addresses to VMs on an AWS subnet, their network traffic gets blocked.
You could get around this by enabling network address translation (NAT) on the instance running CloudStack. That’s a great solution if it fits your needs, but it makes it hard for other machines in your Amazon VPC to contact your VMs. I recommend a different approach.
Although AWS restricts what you can do with its layer 2 network, it’s perfectly happy to let you run your own layer 3 router. Your EC2 instance can act as a router to a new virtual subnet that’s outside of the jurisdiction of AWS. The instance integrates with AWS just like a VPN appliance, routing traffic to wherever it needs to go. CloudStack can do whatever it wants in the virtual subnet, and everybody’s happy.
What do I mean by a virtual subnet? This is a subnet that exists only inside the EC2 instance. It consists of logical network interfaces attached to a Linux bridge. The entire subnet exists inside a single EC2 instance. It doesn’t scale well, but it’s simple. In my next post, I’ll cover a more complicated setup with an overlay network that spans multiple instances to allow horizontal scaling.
The simple way
The simple way is to put everything in one EC2 instance, including the database, file storage, and a virtual subnet. Because everything’s stored locally, allocate enough disk space for your needs. 500 GB will be enough to support a few basic VMs. Create or select a security group for your instance that gives users access to the CloudStack UI (TCP port 8080). The security group should also allow access to any services that you’ll offer from your VMs.

When you have your instance, configure AWS to treat it as a router.
- Go to Amazon EC2 in the AWS Management Console.
- Select your instance, and stop source/destination checking.

3. Update the subnet route tables.
a. Go to the VPC settings, and select Route Tables.
b. Identify the tables for subnets that need CloudStack access.
c. In each of these tables, add a route to the new virtual subnet. The route target should be your EC2 instance.
4. Depending on your network needs, you may also need to add routes to transit gateways, VPN endpoints, etc.
Because everything will be on one server, creating a virtual subnet is simply a matter of creating a Linux bridge. CloudStack must find a network adapter attached to the bridge. Therefore, add a dummy interface with a name that CloudStack will recognize.
 The following snippet shows how I configure networking in CentOS 7. You must provide values for the variables $virutal\_host\_ip\_address and $virtual\_netmask to reflect the virtual subnet that you want to create. For $dns\_address, I recommend the base of the VPC IPv4 network range, plus two. You shouldn’t use 169.654.169.253 because CloudStack reserves link-local addresses for its own use.
yum install -y bridge-utils net-tools# The bridge must be named cloudbr0.cat << EOF > /etc/sysconfig/network-scripts/ifcfg-cloudbr0DEVICE=cloudbr0TYPE=BridgeONBOOT=yesBOOTPROTO=noneIPV6INIT=noIPV6\_AUTOCONF=noDELAY=5STP=yesUSERCTL=noNM\_CONTROLLED=noIPADDR=$virtual\_host\_ip\_addressNETMASK=$virtual\_netmaskDNS1=$dns\_addressEOF# Create a dummy network interface.cat << EOF > /etc/sysconfig/modules/dummy.modules#!/bin/sh/sbin/modprobe dummy numdummies=1/sbin/ip link set name ethdummy0 dev dummy0EOFchmod +x /etc/sysconfig/modules/dummy.modules/etc/sysconfig/modules/dummy.modulescat << EOF > /etc/sysconfig/network-scripts/ifcfg-ethdummy0TYPE=EthernetBOOTPROTO=noneNAME=ethdummy0DEVICE=ethdummy0ONBOOT=yesBRIDGE=cloudbr0NM\_CONTROLLED=noEOF# Turn the instance into a routerecho 'net.ipv4.ip\_forward=1' >> /etc/sysctl.confsysctl -p# Must kill dhclient or the network service won't restart properly.# A reboot would also work, if you’d rather do that.pkill dhclientsystemctl restart network
CloudStack must know which IP addresses to use for inter-service communication. It will select by resolving the machine’s fully qualified domain name (FQDN) to an address. The following commands will make it to choose the right one. You must provide a value for $virtual\_host\_ip\_address.
hostnamectl set-hostname cloudstack.localdomainecho "$virtual\_host\_ip\_address cloudstack.localdomain" >> /etc/hosts
You can finish the setup by following the Quick Installation Guide.
Remember that CloudStack is only directly connected to your virtual network. The EC2 instance is the router that connects the virtual subnet to the Amazon VPC. When you’re configuring CloudStack, use your instance’s virtual subnet address as the default gateway.

To access CloudStack from your workstation, you’ll need a connection to your VPC. This can be through a client VPN or a bastion host. If you use a bastion, its subnet needs a route to your virtual subnet, and you’ll need an SSH tunnel for your browser to access the CloudStack UI. The UI is at http://x.x.x.x:8080/client/, where x.x.x.x is your CloudStack instance’s virtual subnet address. Note that CloudStack’s console viewer won’t work if you’re using an SSH tunnel.
If you’re just experimenting with CloudStack, then I suggest saving money by stopping your instance when it isn’t needed. The safe way to do that is:
- Disable your zone in the CloudStack UI.
- Put the primary storage into maintenance mode.
- Wait for the switch to maintenance mode to be complete.
- Stop the EC2 instance.
When you’re ready to turn everything back on, simply reverse those steps. If you have any virtual routers in CloudStack, then you may need to start those, too.
Cleanup
If you used my CloudFormation template, then delete the stack and remove any route table entries you added. If you didn’t use CloudFormation, then terminate the EC2 instance, delete the security group you created for it, and remove any route table entries that you added.
Conclusion
Getting CloudStack to run on AWS isn’t so bad. The hardest part is simply knowing how. The setup explained here is great for small installations, but it can only scale vertically. In my next post, I’ll show you how to create an installation that scales horizontally. Instead of using a virtual subnet that exists in a single EC2 instance, we’ll build an overlay network that spans multiple instances. It will use more components and features, including some that might be new to you. I hope you find it interesting!
Now that you can create a simple setup, give it a try! I hope you have fun and learn something new along the way. Comment with the results of your experiments.
“Apache”, “Apache CloudStack”, and “CloudStack” are trademarks of the Apache Software Foundation.
This is written by Julian Bonilla, Senior Solutions Architect, and Matthew de Anda, Startup Solutions Architect.
React is a popular JavaScript library used to create single-page applications (SPAs). React focuses on helping to build UIs, but leaves it up to developers to decide how to accomplish other aspects involved with developing a SPA.
Next.js is a React framework to help provide more structure and solve common application requirements such as routing and data fetching. Next.js also provides multiple types of rendering methods – Static Site Generation (SSG), Server-Side Rendering (SSR), Incremental Static Regeneration (ISR), and Client-Side Rendering (CSR).
This post demonstrates how to build a Next.js application with Serverless services on AWS and explains Next.js Server-Side rendering. To deploy this solution and to provision the AWS resources, you can use either AWS Serverless Application Model (AWS SAM) or AWS Cloud Development Kit (CDK). Both are open-source frameworks to automate AWS deployment. AWS SAM is a declarative framework for building serverless applications and CDK is an imperative framework to define cloud application resources using familiar programming languages.
Overview
To render a Next.js application, you use Amazon S3, Amazon CloudFront, Amazon API Gateway, and AWS Lambda. Static resources are hosted in a private S3 bucket with a CloudFront distribution. Since static sources are generated at build time, this takes advantage of CloudFront so browsers can load these files cached on the network edge instead of from the server.
The Next.js application components that uses server-side rendering is rendered with a Lambda function using AWS Lambda Web Adapter. The CloudFront distribution is configured to forward requests to the API Gateway endpoint, which then calls the Lambda function.

- Static files (for example, CSS, JavaScript, and HTML) are mapped to
/\_next/static/*and/public/*. - Server-side rendering is mapped with default behavior (*).
- The AWS Lambda Adapter runs Next.js Output File Tracing.
What’s Next.js?
Next.js is a React framework that creates a more opinionated approach to building web applications while providing additional structure and features such as Server-Side Rendering and Static Site Generation.
These additional rendering options provide more flexibility over the typical ways a React application is built, which is to render in the client’s browser with JavaScript. This can help in scenarios where customers have JavaScript disabled and can improve search engine optimization (SEO). While you can implement SSR in React applications, Next.js makes it simpler for developers.
Next.js rendering strategies
These are the different rendering strategies offered by Next.js:
- Static Site Generation generates static resources at build time and is a good rendering strategy for static content that rarely changes and SEO.
- Server-Side Rendering generates each page on-demand at request time and is good for pages that are dynamic. Since from the browser perspective it’s still pre-rendered, like Static Site Generation, it’s also good for SEO.
- Incremental Static Regeneration is a new rendering strategy that is good for apps with many pages where build times are high. With Incremental Static Regeneration, you can build page per-page without needing to rebuild the entire app.
- Client-Side Rendering is the typical rendering strategy where the application is rendered in the browser with JavaScript. Next.js lets you choose the appropriate rendering method page-by-page. When a Next.js application is built, Next.js transforms the application to production-optimized files. You have HTML for statically generated pages, JavaScript for rendering on the server, JavaScript for rendering on the client, and CSS files.
Next.js also supports static HTML export, which has no server side component. Features that require a server are not supported with this approach. These apps can be hosted from S3 and CloudFront.
The remainder of this post focuses on Static Site Generation and Server-Side Rendering.
Next.js application project structure
Understanding how Next.js structures projects can give insight into how you deploy the application. A page is a React Component exported from files in the “pages” directory. These files are also used for routing where pages/index.js is routed to / route.
By default, these pages are pre-rendered. Static assets, such as images, are stored under “public” directory and can be referenced from /. Since these files are best stored in persistent storage and backed by a content delivery network (CDN), you can add a prefix in the implementation to distinguish these static files.
To create dynamic routes, add brackets to a page file – for example, pages/user/[id].js. This creates a statically generated page with the path /user/<id> where <id> can be dynamic.
API routes provide a way to create an API endpoint and are located in the pages/api directory. When building, Next.js generates an optimized version of your application under the .next directory. Static files not stored in the public directory are in .next/static. These static files are expected to be uploaded as \_next/static to a CDN.
No other code in the .next/directory should be uploaded to a CDN because that would expose server code and other configuration.
Implementation
Next.js pre-renders HTML for every page using Static Site Generation or Server-side Rendering. For Static Site Generation, pages are rendered at build time and can be cached in CloudFront. Server-side rendered pages are rendered at request time, and typically fetch data from downstream resources on each request.
Clients connect to a CloudFront distribution, which is configured to forward requests for static resources to S3 and all other requests to API Gateway. API Gateway forwards requests to the Next.js application running on Lambda, which performs the server-side rendering.
At build time, Next.js Output File Tracing determines the minimal set of files needed for deploying to Lambda. The files are automatically copied to a standalone directory and must be enabled in next.config.js.
const nextConfig = { reactStrictMode: true, output: 'standalone',}module.exports = nextConfigSince the Next.js application is essentially a webserver, this example uses the AWS Lambda Web Adapter as a Lambda layer to convert incoming events from API Gateway to HTTP requests that Next.js can process.
Once processed, the AWS Lambda Web Adapter converts the HTTP response back to a Lambda event response. The Lambda handler is configured to run the minimal server.js file created by the standalone build step.
The CloudFront distribution has two origins: one for the S3 bucket and another for the API Gateway. Two behaviors are created to specify path patterns to route static content produced by Next.js and static resources stored under the public/static directory. Next.js uses the public directory under root to serve static assets such as images.
These assets are then served under / so if you add public/me.png, it would be served at /me.png. This makes it harder to create a CloudFront behavior for these assets. One workaround is to create a static directory under the public directory and then map it to the CloudFront behavior. The default(*) path pattern behavior has the origin set to API Gateway with caching disabled.
Prerequisites and deployment
Refer to the project in its GitHub repository for instructions to deploy the solution using AWS SAM or AWS CDK. Multiple resources are provisioned for you as part of the deployment, and it takes several minutes to complete. The example Next.js application deployed is created using Create Next App.
Understanding the Next.js Application
To create a new page, you create a file under the pages directory and that creates a route based on the name (e.g. pages/hello.js creates route /hello). To create dynamic routes, create a file following the project’s example of pages/posts/[id].js to produce routes for posts/1, posts/2, and so forth.
For API routes, any file added to the directory pages/api is mapped to /api/* and becomes an API endpoint. These are server-side only bundles hosted by API Gateway and Lambda.
Conclusion
This blog shows how to run Next.js applications using S3, CloudFront, API Gateway, and Lambda. This architecture supports building Next.js applications that can use static-site generation, server-side rendering, and client-side rendering. The blog also covers how you can use open-source frameworks, AWS SAM and CDK, to build and deploy your Next.js applications.
If your organization is looking for a fully managed hosting of your Next.js applications, AWS Amplify Hosting supports Next.js. If interested in learning more about server-side rendering and micro-frontends, see Server-side rendering micro-frontends – the architecture.
For more serverless learning resources, visit Serverless Land.
Welcome to the 20th edition of the AWS Serverless ICYMI (in case you missed it) quarterly recap. Every quarter, we share all the most recent product launches, feature enhancements, blog posts, webinars, Twitch live streams, and other interesting things that you might have missed! In case you missed our last ICYMI, check out what happened last quarter here.
AWS Lambda
For developers using Java, AWS Lambda has introduced Lambda SnapStart. SnapStart is a new capability that can improve the start-up performance of functions using Corretto (java11) runtime by up to 10 times, at no extra cost.
To use this capability, you must enable it in your function and then publish a new version. This triggers the optimization process. This process initializes the function, takes an immutable, encrypted snapshot of the memory and disk state, and caches it for reuse. When the function is invoked, the state is retrieved from the cache in chunks, on an as-needed basis, and it is used to populate the execution environment.
The ICYMI: Serverless pre:Invent 2022 post shares some of the launches for Lambda before November 21, like the support of Lambda functions using Node.js 18 as a runtime, the Lambda Telemetry API, and new .NET tooling to support .NET 7 applications.
Also, now Amazon Inspector supports Lambda functions. You can enable Amazon Inspector to scan your functions continually for known vulnerabilities. The log4j vulnerability shows how important it is to scan your code for vulnerabilities continuously, not only after deployment. Vulnerabilities can be discovered at any time, and with Amazon Inspector, your functions and layers are rescanned whenever a new vulnerability is published.
AWS Step Functions
There were many new launches for AWS Step Functions, like intrinsic functions, cross-account access capabilities, and the new executions experience for Express Workflows covered in the pre:Invent post.
During AWS re:Invent this year, we announced Step Functions Distributed Map. If you need to process many files, or items inside CSV or JSON files, this new flow can help you. The new distributed map flow orchestrates large-scale parallel workloads.
This feature is optimized for files stored in Amazon S3. You can either process in parallel multiple files stored in a bucket, or process one large JSON or CSV file, in which each line contains an independent item. For example, you can convert a video file into multiple .gif animations using a distributed map, or process over 37 GB of aggregated weather data to find the highest temperature of the day.
 Amazon EventBridge

Amazon EventBridge launched two major features: Scheduler and Pipes. Amazon EventBridge Scheduler allows you to create, run, and manage scheduled tasks at scale. You can schedule one-time or recurring tasks across 270 services and over 6.000 APIs.
Amazon EventBridge Pipes allows you to create point-to-point integrations between event producers and consumers. With Pipes you can now connect different sources, like Amazon Kinesis Data Streams, Amazon DynamoDB Streams, Amazon SQS, Amazon Managed Streaming for Apache Kafka, and Amazon MQ to over 14 targets, such as Step Functions, Kinesis Data Streams, Lambda, and others. It not only allows you to connect these different event producers to consumers, but also provides filtering and enriching capabilities for events. 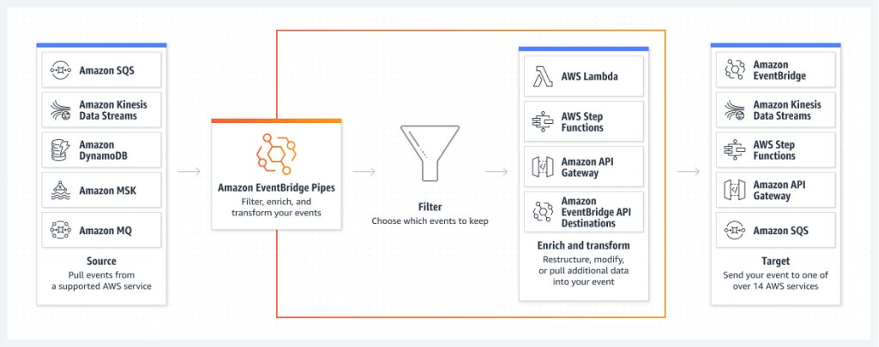
EventBridge now supports enhanced filtering capabilities including:
- Matching against characters at the end of a value (suffix filtering)
- Ignoring case sensitivity (equals-ignore-case)
- OR matching: A single rule can match if any conditions across multiple separate fields are true.
It’s now also simpler to build rules, and you can generate AWS CloudFormation from the console pages and generate event patterns from a schema.
AWS Serverless Application Model (AWS SAM)
There were many announcements for AWS SAM during this quarter summarized in the ICMYI: Serverless pre:Invent 2022 post, like AWS SAM Connectors, SAM CLI Pipelines now support OpenID Connect Protocol, and AWS SAM CLI Terraform support.
AWS Application Composer
AWS Application Composer is a new visual designer that you can use to build serverless applications using multiple AWS services. This is ideal if you want to build a prototype, review with others architectures, generate diagrams for your projects, or onboard new team members to a project.
Within a simple user interface, you can drag and drop the different AWS resources and configure them visually. You can use AWS Application Composer together with AWS SAM Accelerate to build and test your applications in the AWS Cloud.
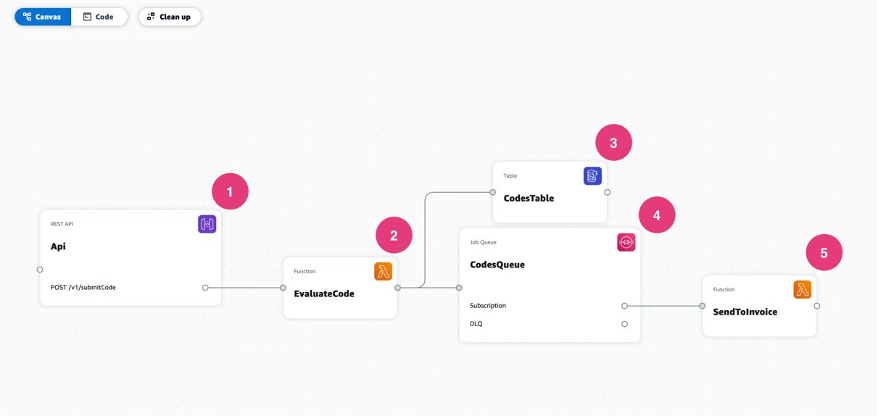
AWS Serverless digital learning badges
The new AWS Serverless digital learning badges let you show your AWS Serverless knowledge and skills. This is a verifiable digital badge that is aligned with the AWS Serverless Learning Plan.
This badge proves your knowledge and skills for Lambda, Amazon API Gateway, and designing serverless applications. To earn this badge, you must score at least 80 percent on the assessment associated with the Learning Plan. Visit this link if you are ready to get started learning or just jump directly to the assessment. 
News from other services:
Amazon SNS
Amazon SQS
- Introducing attribute-based access controls (ABAC) for Amazon SQS
- Amazon SQS announces Server-Side Encryption with Amazon SQS-managed encryption keys (SSE-SQS) by default
AWS AppSync and AWS Amplify
- AWS AppSync GraphQL APIs Supports JavaScript Resolvers
- AWS Amplify Hosting announces support for Next.js 12 and 13
- AWS Amplify Flutter Announces Web and Desktop support (Developer Preview) for API, Analytics, and Storage
- Announcing new AWS Amplify Library for Swift, now with support for both iOS and macOS
Observability
- Protect Sensitive Data with Amazon CloudWatch Logs
- Amazon CloudWatch Cross-Account Observability
- AWS X-Ray adds trace linking for event-driven applications built on Amazon SQS and AWS Lambda
AWS re:Invent 2022
AWS re:Invent was held in Las Vegas from November 28 to December 2, 2022. Werner Vogels, Amazon’s CTO, highlighted event-driven applications during his keynote. He stated that the world is asynchronous and showed how strange a synchronous world would be. During the keynote, he showcased Serverlesspresso as an example of an event-driven application.  The Serverless DA team presented many breakouts, workshops, and chalk talks. Rewatch all our breakout content:
- Building Serverlesspresso: Creating event-driven architectures (SVS312)
- Advanced serverless workflow patterns and best practices (API309)
- Building next-gen applications with event-driven architectures (API311-R)
- Building global event-driven applications (API302-R)
- Best practices for advanced serverless developers (SVS401)
- Lift and shift a web application to serverless: Yes, it’s possible! (BOA326)
- Building observable applications with OpenTelemetry (BOA310)
- Building real-world serverless applications with AWS SAM (SVS303)
In addition, we brought Serverlesspresso back to Vegas. Serverlesspresso is a contactless, serverless order management system for a physical coffee bar. The architecture comprises several serverless apps that support an ordering process from a customer’s smartphone to a real espresso bar. The customer can check the virtual line, place an order, and receive a notification when their drink is ready for pickup.
Serverless blog posts
October
- Oct 5 – Announcing server-side encryption with Amazon Simple Queue Service -managed encryption keys (SSE-SQS) by default
- Oct 12 – Simplifying serverless permissions with AWS SAM Connectors
- Oct 18 – Propagating valid mTLS client certificate identity to downstream services using Amazon API Gateway
- Oct 26 – Serverless and Application Integration sessions at AWS re:Invent 2022
- Oct 27 – Implementing a UML state machine using AWS Step Functions
November
- Nov 7 – Server-side rendering micro-frontends – the architecture
- Nov 9 – Enriching operational events with AWS Serverless
- Nov 10 – Introducing the AWS Lambda Telemetry API
- Nov 10 – Introducing Amazon EventBridge Scheduler
- Nov 15 – Better together: AWS SAM CLI and HashiCorp Terraform
- Nov 15 – Building serverless .NET applications on AWS Lambda using .NET 7
- Nov 17 – Introducing attribute-based access controls (ABAC) for Amazon SQS
- Nov 18 – Node.js 18.x runtime now available in AWS Lambda
- Nov 18 – Introducing cross-account access capabilities for AWS Step Functions
- Nov 18 – Using the AWS Parameter and Secrets Lambda extension to cache parameters and secrets
- Nov 18 – Introducing container, database, and queue utilization metrics for the Amazon MWAA environment
- Nov 21 – ICYMI: Serverless pre:Invent 2022
- Nov 22 – Introducing payload-based message filtering for Amazon SNS
- Nov 29 – Starting up faster with AWS Lambda SnapStart
- Nov 29 – Reducing Java cold starts on AWS Lambda functions with SnapStart
- Nov 29 – Introducing new AWS Serverless digital learning badges
December
- Dec 1 – Visualize and create your serverless workloads with AWS Application Composer
- Dec 6 – Introducing Serverlesspresso Extensions
- Dec 7 – Securing Lambda Function URLs using Amazon Cognito, Amazon CloudFront and AWS WAF
- Dec 13 – Visualizing the impact of AWS Lambda code updates
- Dec 14 – Chaos experiments using AWS Step Functions and AWS Fault Injection Simulator
- Dec 15 – Architecture patterns for consuming private APIs cross-account
Videos
Serverless Office Hours – Tuesday 10 AM PT
Weekly live virtual office hours: In each session, we talk about a specific topic or technology related to serverless and open it up to helping with your real serverless challenges and issues. Ask us anything about serverless technologies and applications.
YouTube: youtube.com/serverlessland
Twitch: twitch.tv/aws
October
- Oct 11 – AWS SAM Accelerate and nested stacks
- Oct 18 – The Serverless Snippets Collection
- Oct 25 – AWS Step Functions – What’s New
November
- Nov 1 – Simpler permissions with AWS SAM connectors
- Nov 8 – Amazon MSK Serverless
- Nov 15 – Amazon EventBridge Scheduler
- Nov 22 – pre:Invent 2022!
December
- Dec 6 – Reduce Java cold starts by 10x with AWS Lambda
- Dec 13 – Amazon EventBridge Pipes
- Dec 20 – AWS Step Functions large-scale parallel data processing
FooBar Serverless YouTube Channel
Marcia Villalba frequently publishes new videos on her popular FooBar Serverless YouTube channel.
October
- Oct 1 – Pub/Sub – Amazon SNS – Exploring Event-Driven Patterns
- Oct 13 – Event Streaming – Amazon Kinesis – Exploring Event-Driven Patterns
November
- Nov 3 – Why to build a multi-Region serverless application and why not?
- Nov 10 – Read and Write Data patterns for Multi-Region architectures
- Nov 17 – Understanding AWS Lambda scaling and throughput
- Nov 24 –
 Amazon EventBridge Scheduler | Schedule tasks over +200 targets!
December
- Dec 8 – Getting started with Route53 for multi-Region applications
- Dec 15 – Building an application that routes traffic to a Region based on latency
- Dec 21 – Building DynamoDB Global Tables with AWS CDK for multi-region serverless applications
Still looking for more?
The Serverless landing page has more information. The Lambda resources page contains case studies, webinars, whitepapers, customer stories, reference architectures, and even more Getting Started tutorials. If you want to learn more about event-driven architectures, read our new guide that will help you get started.
You can also follow the Serverless Developer Advocacy team on Twitter and LinkedIn to see the latest news, follow conversations, and interact with the team.
- James Beswick: Twitter and LinkedIn
- David Boyne: Twitter and LinkedIn
- Eric Johnson: Twitter and LinkedIn
- Ben Smith: Twitter and LinkedIn
- Marcia Villalba: Twitter and LinkedIn
- Julian Wood: Twitter and LinkedIn
For more serverless learning resources, visit Serverless Land.
This blog written by Thomas Moore, Senior Solutions Architect and Josh Hart, Senior Solutions Architect.
Amazon API Gateway allows developers to create private REST APIs that are only accessible from a virtual private cloud (VPC). Traffic to the private API uses secure connections and does not leave the AWS network, meaning AWS isolates it from the public internet. This makes private API Gateway endpoints a good fit for publishing internal APIs, such as those used by backend microservice communication.
In microservice architectures, where multiple teams build and manage components, different AWS accounts often consume private API endpoints.
This blog post shows how a service can consume a private API Gateway endpoint that is published in another AWS account securely over AWS PrivateLink.
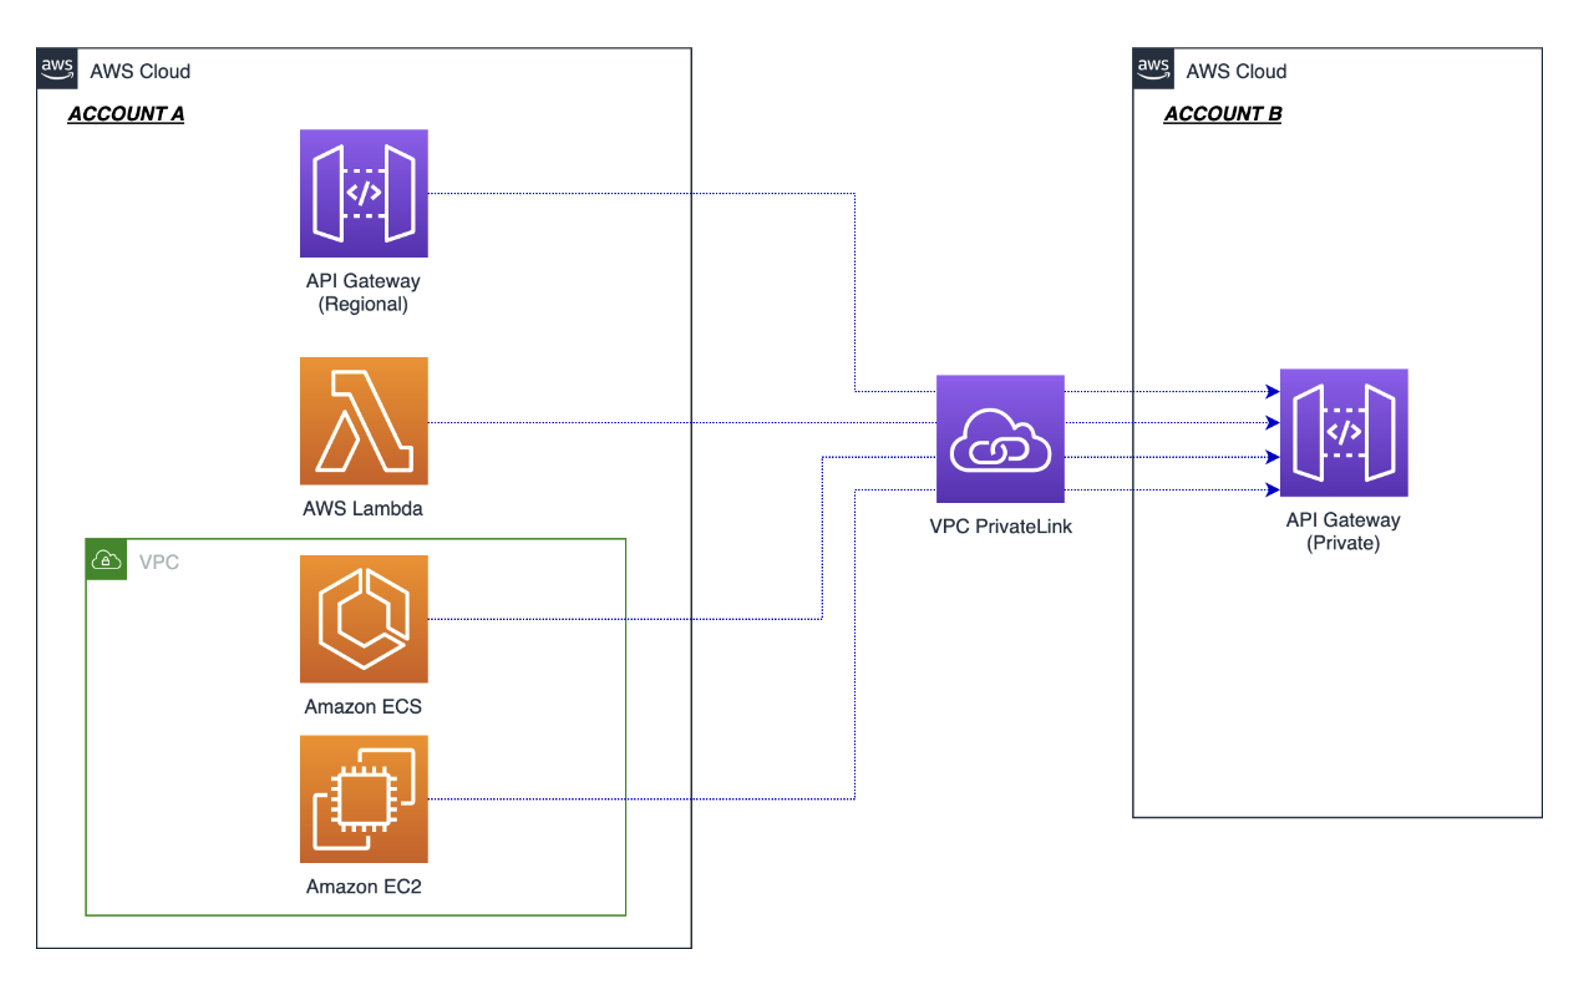
Consuming API Gateway private endpoint cross-account via AWS PrivateLink.
This blog covers consuming API Gateway endpoints cross-account. For exposing cross-account resources behind an API Gateway, read this existing blog post.
Overview
To access API Gateway private endpoints, you must create an interface VPC endpoint (named execute-api) inside your VPC. This creates an AWS PrivateLink connection between your AWS account VPC and the API Gateway service VPC. The PrivateLink connection allows traffic to flow over private IP address space without traversing the internet.
PrivateLink allows access to private API Gateway endpoints in different AWS accounts, without VPC peering, VPN connections, or AWS Transit Gateway. A single execute-api endpoint is used to connect to any API Gateway, regardless of which AWS account the destination API Gateway is in. Resource policies control which VPC endpoints have access to the API Gateway private endpoint. This makes the cross-account architecture simpler, with no complex routing or inter-vpc connectivity.
The following diagram shows how interface VPC endpoints in a consumer account create a PrivateLink connection back to the API Gateway service account VPC. The resource policy applied to the private API determines which VPC endpoint can access the API. For this reason, it is critical to ensure that the resource policy is correct to prevent unintentional access from other AWS account VPC endpoints.

Access to private API Gateway endpoints requires an AWS PrivateLink connection to an AWS service account VPC.
In this example, the resource policy denies all connections to the private API endpoint unless the aws:SourceVpce condition matches vpce-1a2b3c4d in account A. This means that connections from other execute-api VPC endpoints are denied. To allow access from account B, add vpce-9z8y7x6w to the resource policy. Refer to the documentation to learn about other condition keys you can use in API Gateway resource policies.
For more detail on how VPC links work, read Understanding VPC links in Amazon API Gateway private integrations.
The following sections cover three architecture patterns to consume API Gateway private endpoints cross-account:
- Regional API Gateway to private API Gateway
- Lambda function calling API Gateway in another account
- Container microservice calling API Gateway in another account using mTLS
Regional API Gateway to private API Gateway cross-account
When building microservices in different AWS accounts, private API Gateway endpoints are often used to allow service-to-service communication. Sometimes a portion of these endpoints must be exposed publicly for end user consumption. One pattern for this is to have a central public API Gateway, which acts as the front-door to multiple private API Gateway endpoints. This allows for central governance of authentication, logging and monitoring.
The following diagram shows how to achieve this using a VPC link. VPC links enable you to connect API Gateway integrations to private resources inside a VPC. The API Gateway VPC interface endpoint is the VPC resource that you want to connect to, as this is routing traffic to the private API Gateway endpoints in different AWS accounts.

API Gateway Regional endpoint consuming API Gateway private endpoints cross-account
VPC link requires the use of a Network Load Balancer (NLB). The target group of the NLB points to the private IP addresses of the VPC endpoint, normally one for each Availability Zone. The target group health check must validate the API Gateway service is online. You can use the API Gateway reserved /ping path for this, which returns an HTTP status code of 200 when the service is healthy.
You can deploy this pattern in your own account using the example CDK code found on GitHub.
Lambda function calling private API Gateway cross-account
Another popular requirement is for AWS Lambda functions to invoke private API Gateway endpoints cross-account. This enables service-to-service communication in microservice architectures.
The following diagram shows how to achieve this using interface endpoints for Lambda, which allows access to private resources inside your VPC. This allows Lambda to access the API Gateway VPC endpoint and, therefore, the private API Gateway endpoints in another account.

Consuming API Gateway private endpoints from Lambda cross-account
Unlike the previous example, there is no NLB or VPC link required. The resource policy on the private API Gateway must allow access from the VPC endpoint in the account where the consuming Lambda function is.
As the Lambda function has a VPC attachment, it will use DNS resolution from inside the VPC. This means that if you selected the Enable Private DNS Name option when creating the interface VPC endpoint for API Gateway the https://{restapi-id}.execute-api.{region}.amazonaws.com endpoint will automatically resolve to private IP addresses. Note that this DNS configuration can block access from Regional and edge-optimized API endpoints from inside the VPC. For more information, refer to the knowledge center article.
You can deploy this pattern in your own account using the sample CDK code found on GitHub.
Calling private API Gateway cross-account with mutual TLS (mTLS)
Customers that operate in regulated industries, such as open banking, must often implement mutual TLS (mTLS) for securely accessing their APIs. It is also great for Internet of Things (IoT) applications to authenticate devices using digital certificates.

Mutual TLS (mTLS) verifies both the client and server via certificates with TLS
Regional API Gateway has native support for mTLS but, currently, private API Gateway does not support mTLS, so you must terminate mTLS before the API Gateway. One pattern is to implement a proxy service in the producer account that resolves the mTLS handshake, terminates mTLS, and proxies the request to the private API Gateway over regular HTTPS.
The following diagram shows how to use a combination of PrivateLink, an NGINX-based proxy, and private API Gateway to implement mTLS and consume the private API across accounts.
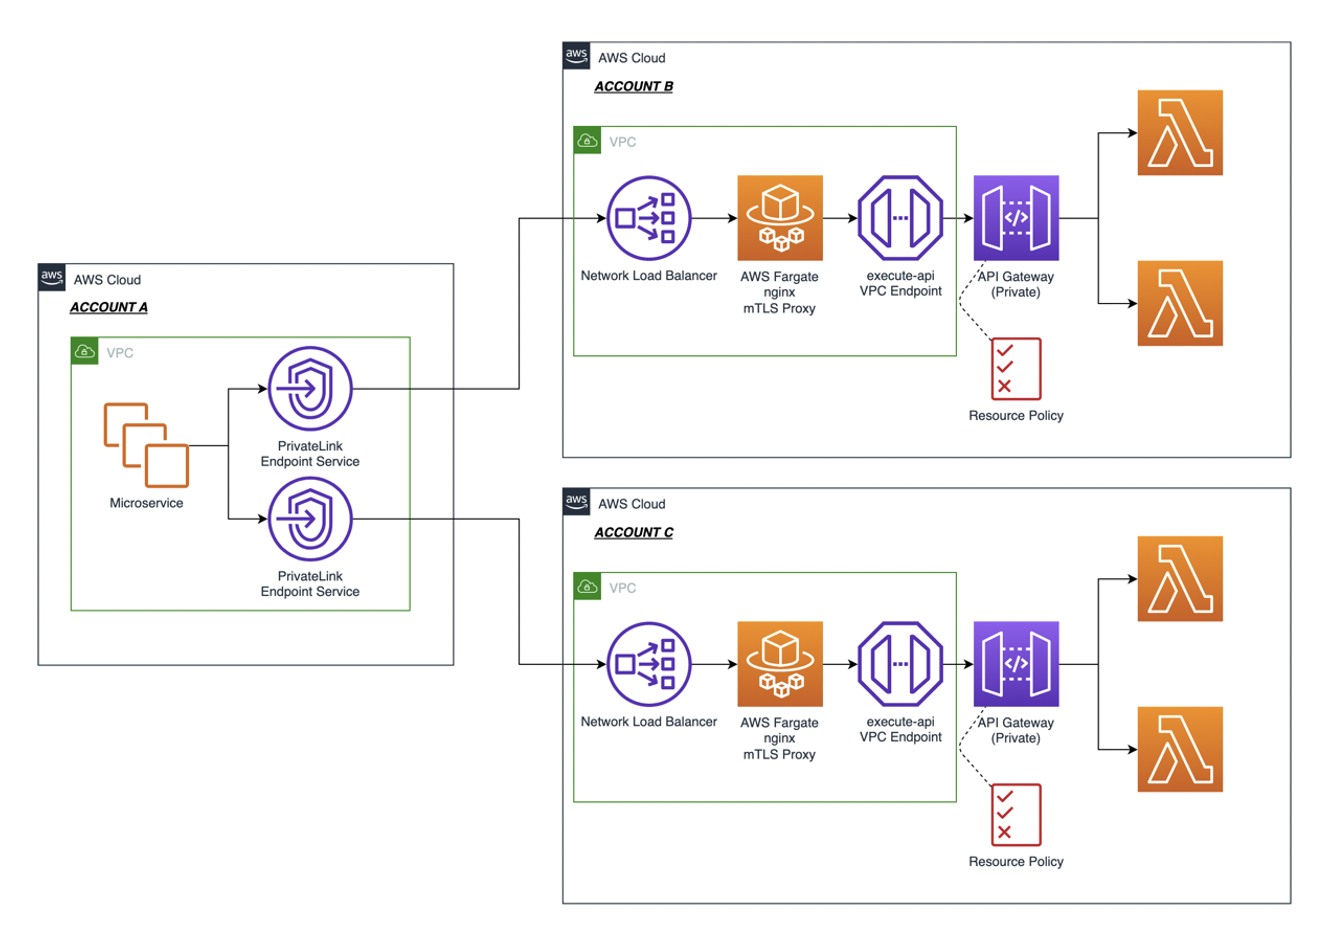
Consuming API Gateway private endpoints cross-account with mTLS
In this architecture diagram, Amazon ECS Fargate is used to host the container task running the NGINX proxy server. This proxy validates the certificate passed by the connecting client before passing the connection to API Gateway via the execute-proxy VPC endpoint. The following sample NGINX configuration shows how the mTLS proxy service works by using ssl\_verify\_client and ssl\_client\_certificate settings to verify the connecting client’s certificate, and proxy\_pass to forward the request onto API Gateway.
server { listen 443 ssl; ssl\_certificate /etc/ssl/server.crt; ssl\_certificate\_key /etc/ssl/server.key; ssl\_protocols TLSv1.2; ssl\_prefer\_server\_ciphers on; ssl\_ciphers ECDH+AESGCM:ECDH+AES256:ECDH+AES128:DH+3DES:!ADH:!AECDH:!MD5; ssl\_client\_certificate /etc/ssl/client.crt; ssl\_verify\_client on; location / { proxy\_pass https://{api-gateway-endpoint-api}; }}The connecting client must supply the client certificate when connecting to the API via the VPC endpoint service:
curl --key client.key --cert client.crt --cacert server.crt https://{vpc-endpoint-service-url}Use VPC security group rules on both the VPC endpoint and the NGINX proxy to prevent clients bypassing the mTLS endpoint and connecting directly to the API Gateway endpoint.
There is an example NGINX config and Dockerfile to configure this solution in the GitHub repository.
Conclusion
This post explores three solutions to consume private API Gateway across AWS accounts. A key component of all the solutions is the VPC interface endpoint. Using VPC Endpoints & PrivateLink, you can consume resources securely and even your own microservices across AWS accounts. For more details, read Enabling New SaaS Strategies with AWS PrivateLink. Visit the GitHub repository to get started implementing one of these solutions today.
For more serverless learning resources, visit Serverless Land.
This post is written by Arunsingh Jeyasingh Jacob, Senior Solutions Architect, and Sindhura Palakodety, Senior Solutions Architect.
To run business-critical applications at scale, it is important to determine the resiliency of the application. Chaos experiments induce controlled failures into a distributed application to gain confidence in the application behavior. The learnings from these experiments can be fed into a continuous feedback cycle to improve the resiliency.
In 2021, AWS launched AWS Fault Injection Simulator (FIS). This is a fully managed service for running Fault Injection experiments on AWS. It makes it easier to improve an application’s performance, observability, and resiliency. With Fault Injection Simulator, AWS customers can quickly set up experiments using pre-built templates that generate the desired disruptions.
Overview
This post uses AWS Step Functions to create and run AWS Fault Injection Simulator (FIS) experiments. You are encouraged to perform these experiments in a test account. Do not use the example in a production environment without making appropriate code changes.
The demo-fis-stepfunctions code deployed in this post is used to build the Step Functions state machine for FIS experiments.
There are two Step Functions workflows that are deployed. One is for chaos testing Amazon EC2 workloads and the other one is for Amazon ECS workloads.
The Step Functions workflow for EC2 workloads
The following Step Functions workflow shows an EC2 chaos experiment to stress CPU utilization, and stop and terminate EC2 instances.

EC2 experiment templates
This workflow runs through FIS experiment template creation followed by the execution of the FIS experiment. The FIS experiment template contains one or more actions to run on specified targets during an experiment. By creating a template, you are not running experiments against any workload, but creating a definition for the experiment.
The EC2 experiment templates created in this workflow are:
- EC2CPUStressExperimentTemplate
- EC2StopExperimentTemplate
- EC2TerminateExperimentTemplate
These are the terms used in the FIS experiment template:
- Actions: While creating an experimentation template, you must define an action once during an experiment.
- Targets: A target is one or more AWS resources on which an action is performed by AWS Fault Injection Simulator (AWS FIS) during an experiment. For example, defining which instances to stress CPUs based on the tags.
- Filters: Resource filters are queries that identify target resources according to specific attributes.
- IAM role: This IAM role is assumed by FIS to perform the actions mentioned in the template. The Step Functions role must pass permissions to this FIS role.
- Client token: The Step Functions execution fails if a client token is not passed.
- Selection mode: Run experiments on all the resources matching the target criteria or specify the number of resources. For example, the EC2CPUStressExperimentTemplate targets one resource in random.
The ‘EC2CPUStressExperimentTemplate’ code defines how to stop EC2 instances with the tag ‘FISAction: CPUStress’:
{ "Targets": { "CPUStressInstances": { "ResourceType": "aws:ec2:instance", "ResourceTags": { "FISAction": "CPUStress" }, "Filters": [ { "Path": "VpcId", "Values": [ "${VpcID}" ] } ], "SelectionMode": "COUNT(1)" } }}Targets can also be filtered using parameters like Amazon VPC ID. You can change the Step Functions definition by modifying the targets, actions, and filters.
EC2 FIS experiments
FIS experiment uses the experiment template definition during the state execution, and targets the appropriate resources.
- There are three EC2 FIS experiments created as a part of the workflow:1. CPUStressInstances: This runs after the ‘EC2CPUStressExperimentTemplate’ state. In this state, AWS Systems Manager (SSM) attempts to add CPU stress on the target instance with the tag “FISAction: CPUStress”. You can monitor the metric in the Amazon CloudWatch dashboard, and take actions using Amazon CloudWatch alarms.

- StopInstances: Here, the target instances enter the ‘stopping’ state. Based on the template definition, all the EC2 instances with the tag “FISAction:Stop” in the filtered VPC are stopped.
- TerminateInstances: This terminates the target instances with the tag “FISAction:Terminate” in the filtered VPC.
The Step Functions workflow for Amazon ECS workloads
The following Step Functions workflow shows an FIS experiment to stop ECS tasks:

- Amazon ECS experiment template: The ECSStopTaskExperimentTemplate state is created in this workflow. This FIS template defines the action to be run during the experiment.
- Amazon ECS experiments: After creating the experiment template, the ECSStopTask state runs the FIS experiment.
- ECSStopTask: FIS targets all the Amazon ECS tasks with the tag “FISAction: StopECSTask” and stops the tasks.
After the FIS experiment state is initiated, the status of the experiment can be polled before proceeding to the next state. The FIS experiments have multiple states like pending, initiating, running, completed, stopping, stopped, and failed.
The choice state in the workflow checks for the ‘running’ state by polling the status using FIS: GetExperiment API. A ‘failed’ status will result in the workflow failure. You can also design the workflow by introducing wait times between the experiments or by including flow activities like parallel.
Deploying with the AWS Serverless Application Model
This example has the following prerequisites:
- Create an AWS account if you don’t have one already.
- A valid existing VPC with subnets.
- A local install of Git CLI.
- A local install of AWS SAM CLI to build and deploy the sample code.
After installation, follow these steps to deploy the example:
- Clone the sample code:
git clone https://github.com/aws-samples/aws-stepfunctions-examples.gitcd sam/demo-fis-stepfunctions/ - Modify the templates as needed. You can also edit the state machine code from the AWS Management Console after you deploy this code.
- Build and deploy the code:
sam build sam deploy --guided
To learn more, visit the AWS SAM deployment documentation. This launches an AWS CloudFormation stack that creates the state machine, AWS IAM roles and CloudWatch log group. The next step is to run the state machines.
Running the Step Functions workflows
The AWS SAM deployment creates two Step Functions state machines in the deployed AWS Region: FISTest-aws-region-StateMachineFIS and FISTest-aws-region-StateMachineECSFIS.
Before running the state machine FISTest-aws-region-StateMachineFIS, create three EC2 instances with the tags “FISAction: CPUStress”, “FISAction:Stop” and “FISAction:Terminate” respectively.
- Navigate to the Step Functions console.
- Choose FISTest-aws-region-StateMachineFIS then Start execution.
As the workflow progresses, CPU Utilization spikes in one Amazon EC2 instance. The other Amazon EC2 instances are stopped and terminated.
To run chaos experiments on an ECS cluster, you can either use an existing ECS cluster or create a new cluster. To create an ECS cluster:
- Navigate to the ECS console.
- Choose Get Started.
- Choose sample-app and follow the instructions to deploy. Wait for the cluster to be created.
- Choose the sample cluster, then choose Tasks.
- Choose the running tasks and add the tag “FISAction: StopECSTask”
From the browser, the public IP assigned to the task takes you to the sample application.
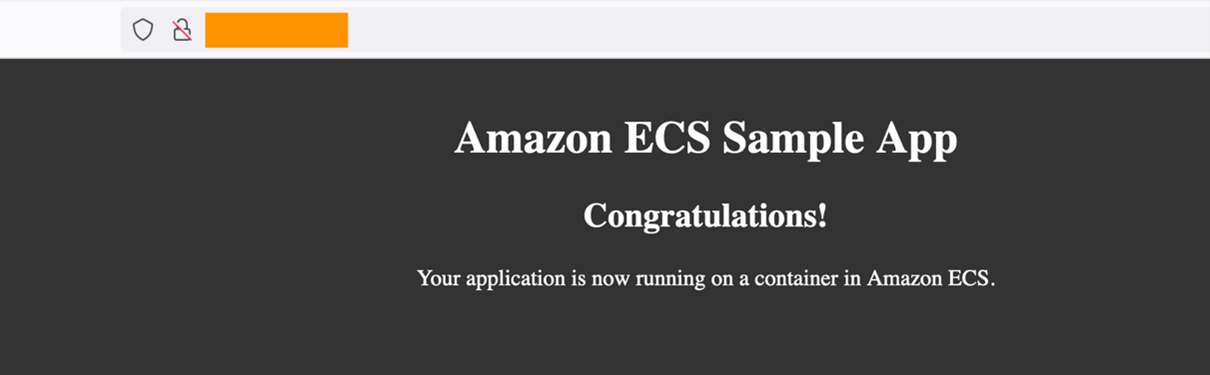
- Navigate to the Step Functions console.
- Choose FISTest-aws-region-StateMachineECSFIS, then Start execution.
- The workflow transitions to Wait during the execution.

Once the execution is complete, the webpage momentarily becomes unavailable until a new task comes up. The public IP address and ARN of the task changes. The task status of the stopped tasks now shows “Task stopped by AWS FIS”.

To perform an FIS experiment against an existing ECS cluster, add the Resource Tags value “FISAction: StopECSTask” to your ECS tasks before running the workflows.
{ "Targets": { "ecsfargatetask": { "ResourceType": "aws:ecs:task", "ResourceTags": { "FISAction": "StopECSTask" }, "SelectionMode": "ALL" } }}Cleanup
If you have deployed the code using AWS SAM, delete the resources:
sam delete –stack-name <STACK\_NAME>Refer to this documentation for further information.
Conclusion
This blog post describes how to use Step Functions to orchestrate Fault Injection Simulator (FIS) experiments for EC2 and ECS workloads. Using the workflow in this post as an example, you can build state machines for more AWS FIS experiments. Step Functions, AWS FIS, and other services can be combined to build resiliency workflows, and test your application against your resiliency goals.
To learn more about AWS FIS and Step Functions, visit:
- How Step Functions works
- Testing resiliency using chaos engineering
- Chaos experiments on Amazon RDS using AWS Fault Injection Simulator
- Increase your ecommerce website reliability using chaos engineering and AWS Fault Injection Simulator
For more Step Functions resources, visit the Serverless Workflows Collection.
This blog post is written by Eric Vasquez, Specialist Hybrid Edge Solutions Architect, and Paul Scherer, Senior Network Service Tech.
Overview
AWS Outposts brings managed, monitored AWS infrastructure, compute, and storage to your on-premises environment. It provides the same AWS APIs, and console experience you would get within the AWS Region to which the Outpost is homed to. You may already have an Outposts rack. An Outpost can consist of one or more racks creating a pool of consumable resources as a single logical Outpost. In this post, we will introduce you to an Aggregation, Core, Edge (ACE) rack.
Depending on your familiarity with the Outpost family, you might have already heard about an ACE rack. An ACE rack serves as an aggregation point for multi-rack Outpost deployments. ACE racks reduce the physical networking port requirements as well as the logical interfaces needed, while allowing for connectivity between multiple racks in your logical Outpost. ACE racks are recommended for customers with planned deployments beyond three racks excluding the ACE rack itself.
We recommend that all customers leverage an ACE rack if planning expansions beyond three racks in the long-term, even if the initial deployment is a single rack. An ACE rack contains four routers, and these routers can connect to either two or four customer upstream devices. For the best redundancy, reliability, and resiliency, we recommend deploying an ACE rack to four upstream customer devices.
ACE racks support 10G, 40G, and 100G connections to a customer network. However, 100G connections between each ACE router to a customer device are recommended.
 Outpost extension from region and ACE rack deployment in a 15 rack Outpost configuration
Each Outposts rack comes standard with redundant Outpost networking devices, power supplies, and two top-of-rack patch panels which serve as demarcation points between the Outpost rack and your customer networking device (CND). For the remainder of this post, we’ll refer to the Outpost Networking Devices as OND and customer switches/routers as CND. The Outpost rack ONDs form Border Gateway Protocol (BGP) neighbor relationships with either your CND or the ACE rack using point-to-point (P2P) Virtual LAN (VLAN) interfaces.
For Outposts installation without an ACE rack, each Outposts OND connects to your LAN using single-mode or multi-mode fiber with LC connectors supporting 1G, 10G, 40G, or 100G connectivity. We provide flexibility for the CNDs and allow either Layer 2 or Layer 3 devices, including firewalls. Each OND uses a single LACP port channel that carries 2 VLAN point-to-points virtual interfaced (VIF)to establish 2 BGP relationships over the port channel to your upstream CND and aggregate total bandwidth. This results in each Outpost rack requiring a minimum of two physical uplinks, but as a general best practice we recommend two-per-device for a total of four uplinks, along with two LACP port channels and 4 VLAN to establish point-to-points (P2P) BGP peering’s. Note that the IP’s used in the following diagram are just examples.
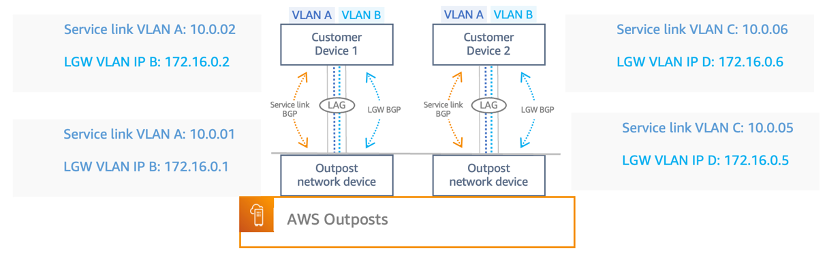 Outpost Service link and Local Gateway VLAN
As we continue to expand rack deployments, so will the number of physical uplinks and VLAN interfaces required for the added OND to a CND. When we introduce the ACE rack, the OND is no longer attached to your CND. Instead, it goes directly to ACE devices, which provide at least one uplink to your network switch/router. In this topology, AWS owns the VLAN interface allocation and configuration between compute rack OND and the ACE routers.
Let’s cover the potential downsides to a multi-rack installation without an ACE rack. In this case, we have a three-rack Outpost deployment, with one uplink (two per rack) from each rack OND to the CND. This would require you to provide: six physical ports on your devices, six fiber cables,12 VLAN VIFs, 12 P2P subnets potentially exhausting 24 ips, and six port channels.
In comparison to a three-rack install that sits behind an ACE rack, you provide fewer physical network ports on your devices, fewer fiber cabling uplinks, fewer VLAN VIFs, fewer port channels, and fewer P2P’s. Each ACE router will have its own LACP port channel with 2x VLAN VIFs in each channel (the same as an Outposts Networking Devices (OND) <> Customer connection). The following table highlights the advantages in using an ACE rack when running a multi-rack Outpost, which becomes more desirable as you continue to scale.
| 2-Rack Outpost Installation | 3-Rack Outpost Installation | 4-Rack Outpost Installation | ||||
| Requirement | Without ACE | With ACE | Without ACE | With ACE | Without ACE | With ACE |
| Physical Ports | 4 | 4 | 6 | 4 | 8 | 4 |
| Fiber Cables | 4 | 4 | 6 | 4 | 8 | 4 |
| LACP Port Channels | 4 | 4 | 6 | 4 | 8 | 4 |
| VLAN VIFs | 8 | 8 | 12 | 8 | 16 | 8 |
| P2P Subnets | 8 | 8 | 12 | 8 | 16 | 8 |
ACE VS Non-ACE Rack Components Comparison
Furthermore, you should consider the additional weight, and power requirements that an ACE rack introduces when planning for multi-rack deployments. In addition to initial kVA requirements for the Outpost racks you must account for the resources required for an ACE rack. An ACE rack consumes up to 10kVA of power and weighs up to 705 lbs. Carefully planning additional capacity for these resources with your AWS account team will be critical for a successful deployment.
Similar to an Outpost rack, an ACE rack deployment is monitored by AWS. The rack provides telemetry data transmitted over a set of VPN tunnels back to the anchor points in the Region to which the Outpost is homed. This allows AWS to monitor the rack for hardware failures, performance degradation, and other alarm conditions including Links, Interfaces going down, and BGP drops.
As part of the Outpost ordering process, AWS will work closely with you to determine the location for install, power availability on-site, and the network configuration of both the Outposts rack and ACE rack. This includes BGP configuration, and the Customer Owned IP Address (CoIP), which is the pool of IP addresses for route advertisements back to your CND. The COIP pool allows resources inside your Outpost rack to communicate with on-premises resources and vice-versa. Another connectivity option would be the Direct VPC Routing (DVR) where we advertise VPC subnets associated with your LGW to your on-premises networks. Outposts uses a networking connectivity back to the Region for management purposes called the service link (SL). The SL is an encrypted set of VPN connections used whenever the Outpost communicates with your chosen home Region.
Conclusion
This post addresses the most common questions surrounding ACE racks, how an ACE rack can be deployed, and why an ACE rack would be leveraged for a multi-Outpost rack deployment. In this post, we demonstrated how an ACE rack serves as a consolidation point in your on-premises environment, making multi-rack deployments scalable, while reducing complexity and physical port allocation for connectivity between an Outpost and your LAN. In addition, we described how you can get this process started. If you want to learn more about Outposts fundamentals and how you can build your applications with AWS services using Outposts for hybrid cloud deployments you can learn more check out the Outposts user guide.
This post is written by Brigit Brown (Solutions Architect), and Helen Ashton (Observability Specialist Solutions Architect).
When using AWS Lambda, changes made to code can impact performance, functionality, and cost. It can be challenging to gain insight into how these code changes impact performance.
This blog post demonstrates how to capture, record, and visualize Lambda code deployment data with other data in an Amazon CloudWatch dashboard. This solution enables serverless developers to gain insight into the impact of code changes to Lambda functions and make data-driven decisions.
There are three steps to this solution:
- Capture: Lambda function code updates using Amazon EventBridge.
- Record: Lambda function code updates by creating an Amazon CloudWatch metric.
- Visualize: The relationship between Lambda function code updates and application KPIs by creating a CloudWatch dashboard.
Overview
EventBridge and CloudWatch are used to monitor and visualize the impact of code changes to Lambda functions on key application metrics.

Step 1: Capturing
AWS CloudTrail records all management events for AWS services. These are the operations performed on resources in your AWS account and include Lambda function code updates.
An EventBridge rule can listen for Lambda functions code updates and send these events to other AWS services, in this case to CloudWatch.
You can create EventBridge rules using an example event syntax as reference. To get the example event, update the code of a Lambda function and search in CloudTrail for all events with Event source of lambda.amazonaws.com, and an Event name starting with UpdateFunctionCode. UpdateFunctionCode is one of many events captured for Lambda functions. For example:
{ "eventVersion": "1.08", "userIdentity": { "type": "AssumedRole", "principalId": "x", "arn": "arn:aws:sts::xxxxxxxxxxxx:assumed-role/Admin/x", "accountId": "xxxxxxxxxxxx", "accessKeyId": "xxxxxxxxxxxxxxxxx", "sessionContext": { "sessionIssuer": { "type": "Role", "principalId": "x", "arn": "arn:aws:iam::xxxxxxxxxxxx:role/Admin", "accountId": "xxxxxxxxxxxx", "userName": "Admin" }, "webIdFederationData": {}, "attributes": { "creationDate": "2022-09-22T16:37:04Z", "mfaAuthenticated": "false" } } }, "eventTime": "2022-09-22T16:42:07Z", "eventSource": "lambda.amazonaws.com", "eventName": "UpdateFunctionCode20150331v2", "awsRegion": "us-east-1", "sourceIPAddress": "AWS Internal", "userAgent": "AWS Internal", "requestParameters": { "fullyQualifiedArn": { "arnPrefix": { "partition": "aws", "region": "us-east-1", "account": "xxxxxxxxxxxx" }, "relativeId": { "functionName": "example-function" }, "functionQualifier": {} }, "functionName": "arn:aws:lambda:us-east-1:xxxxxxxxxxxx:function:example-function", "publish": false, "dryRun": false }, "responseElements": { "functionName": "example-function", "functionArn": "arn:aws:lambda:us-east-1:xxxxxxxxxxxx:function:example-function", "runtime": "python3.8", "role": "arn:aws:iam::xxxxxxxxxxxx:role/role-name", "handler": "lambda\_function.lambda\_handler", "codeSize": 1011, "description": "", "timeout": 123, "memorySize": 128, "lastModified": "2022-09-22T16:42:07.000+0000", "codeSha256": "x", "version": "$LATEST", "environment": {}, "tracingConfig": { "mode": "PassThrough" }, "revisionId": "x", "state": "Active", "lastUpdateStatus": "InProgress", "lastUpdateStatusReason": "The function is being created.", "lastUpdateStatusReasonCode": "Creating", "packageType": "Zip", "architectures": ["x86\_64"], "ephemeralStorage": { "size": 512 } }, "requestID": "f566f75f-a7a8-4e87-a177-2db001d40382", "eventID": "4f90175d-3063-49b4-a467-04150b418457", "readOnly": false, "eventType": "AwsApiCall", "managementEvent": true, "recipientAccountId": "113420664689", "eventCategory": "Management", "sessionCredentialFromConsole": "true"}The key fields are eventSource, eventName, functionName, and eventType. This is the event syntax containing only the key fields.
{ "eventSource": "lambda.amazonaws.com", "eventName": "UpdateFunctionCode20150331v2", "responseElements": { "functionName": "example-function" } "eventType": "AwsApiCall",}Use this example event as a reference to write the EventBridge rule pattern.
{ "source": ["aws.lambda"], "detail-type": ["AWS API Call via CloudTrail"], "detail": { "eventSource": ["lambda.amazonaws.com"], "eventName": [{ "prefix": "UpdateFunctionCode" }], "eventType": ["AwsApiCall"] }}In this EventBridge rule, the detail section contains properties to match the original UpdateFunctionCode event pattern. The values to match are in square brackets using EventBridge syntax.
The eventName changes with each UpdateFunctionCode event, including date and version information within the value (i.e. UpdateFunctionCode20150331v2) and so a prefix matching filter is used to match the start of the eventName.
The source and the detail-type of the event are two additional fields included by EventBridge. For all Lambda CloudTrail calls, the detail-type is [“AWS API Call via CloudTrail”] and the source is “aws.lambda“.
Next, send an event to CloudWatch. Each EventBridge rule can send events to multiple targets, including Amazon SNS and CloudWatch log groups. Choose a target of CloudWatch log groups, with the log group specified as /aws/events/lambda/updates. EventBridge creates this log group in CloudWatch.

Finally, test the EventBridge rule.
- To trigger an event, change the code for any Lambda function and deploy.

AWS Console
- To view the event, navigate to the CloudWatch console > Logs > Log groups.

Log group
- Choose the log group (/aws/events/lambda/updates).
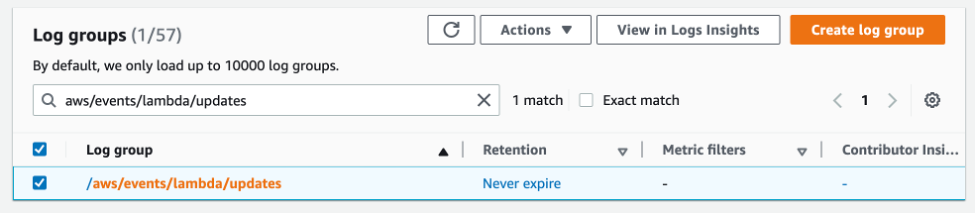
Selected log group
- Select the most recent log stream.

Recent log stream
- If the EventBridge rule is successful, the Lambda code update event is visible. To see the JSON from the event, expand the event with the arrows to the left and see the detail field.

Expanded view of event
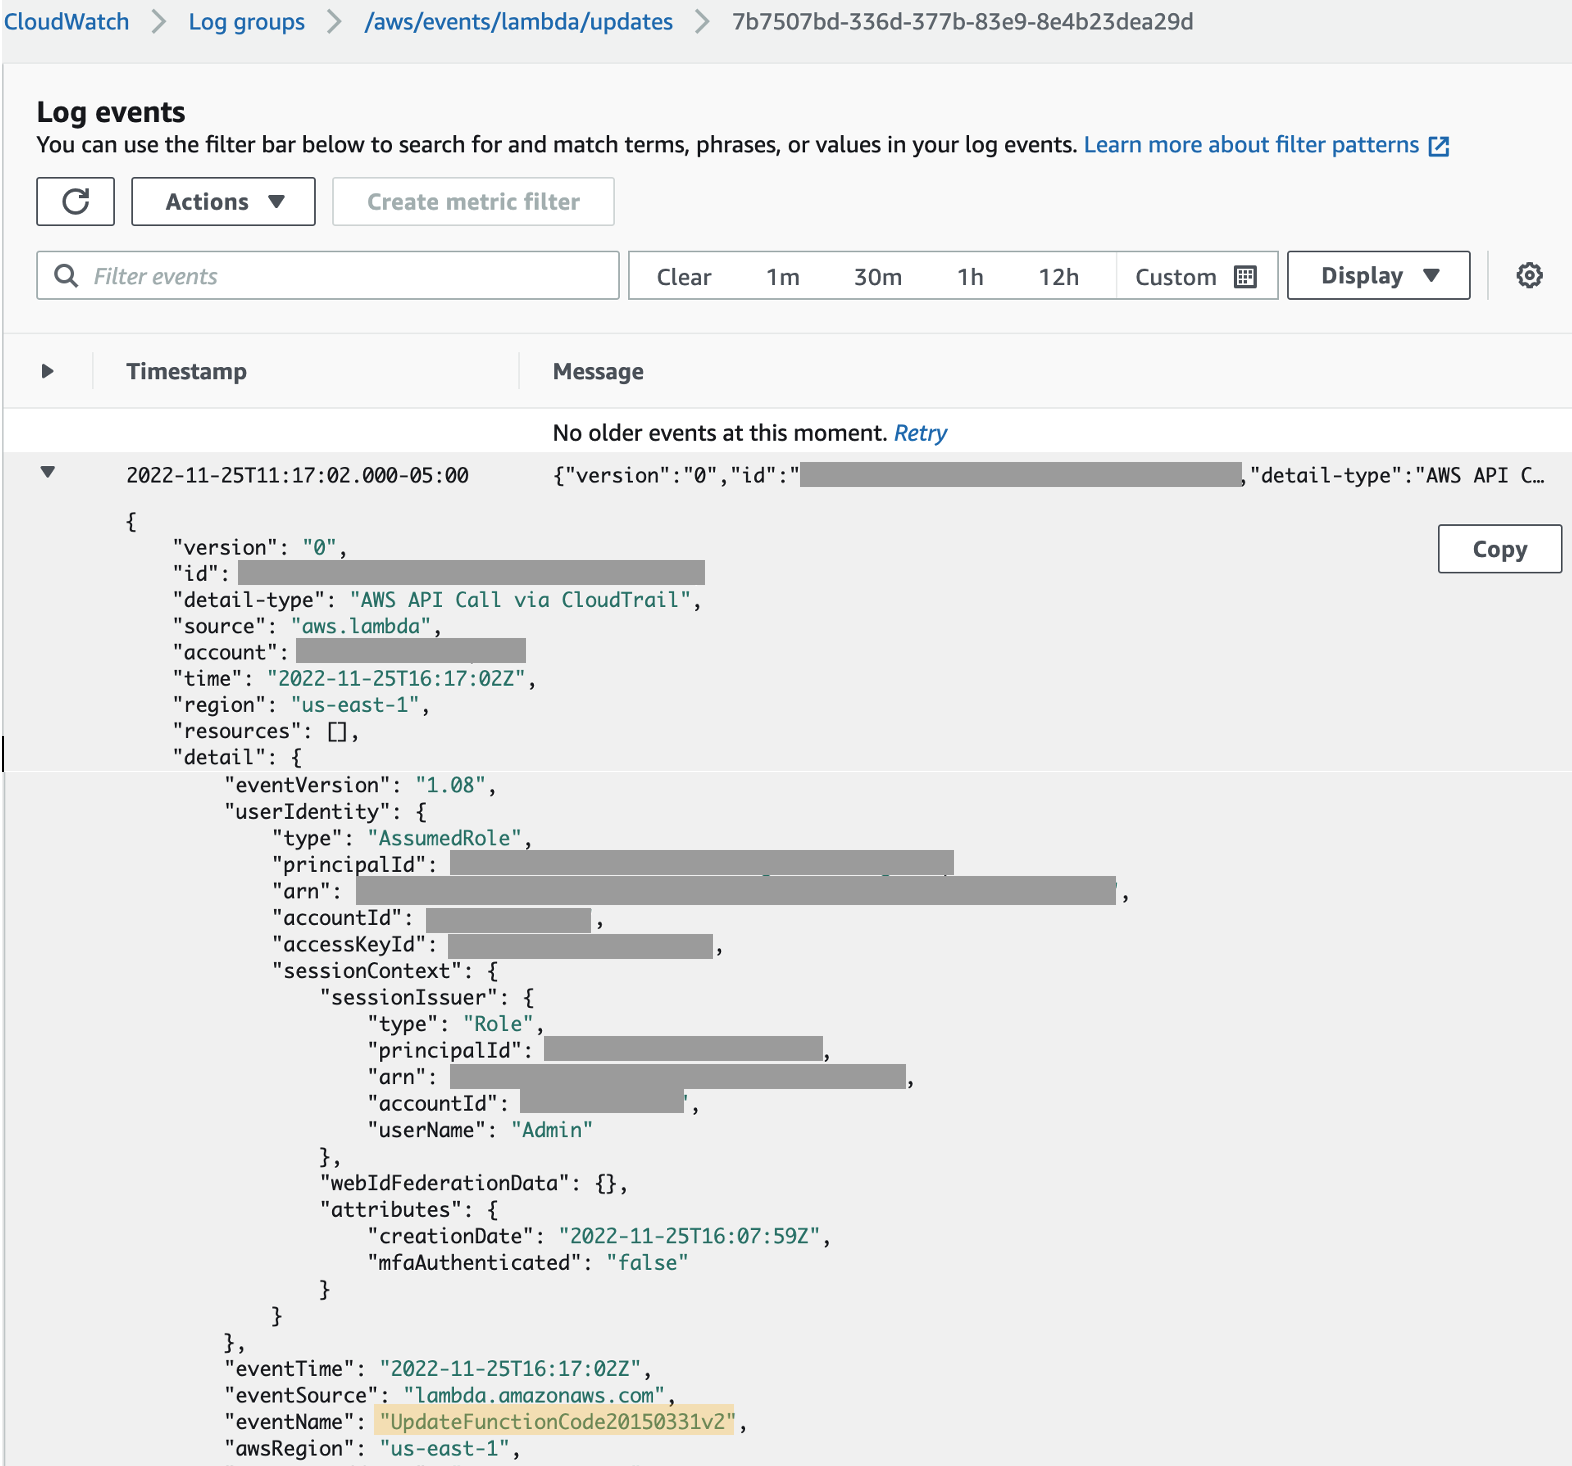
Step 2: Recording
To display the Lambda function update data alongside other CloudWatch metrics, convert the log event into a metric using metric filters. A metric filter is created on a log group. If a log event matches a metric filter, a metric data point is created.
A metric filter uses a filter pattern to match on specific fields in the JSON event. In this case, the filter pattern matches on the eventName starting with UpdateFunctionCode (note the star as a wildcard).
{ $.detail.eventName=UpdateFunctionCode* }
Create a metric filter with the following:
- Metric namespace: LambdaEvents
- Metric name: UpdateFunction
- Metric value: 1
- Dimensions: DimensionName: FunctionName; Dimension Value: $.detail.responseElements.functionName
Dimensions allow metadata to be added to metrics. Setting a dimension with the JSON path to $.detail.responseElements.functionName allows the FunctionName value to come from the data in the log event. This makes this a generic metric filter for any Lambda function.
The event pattern of a metric filter can be tested on real data in the Test pattern section. Choose the log stream to test the filter on by using the Select log data drop down and selecting Test pattern. This shows a table with the matched events and the field value.
The CloudWatch console provides a view of the metrics for Lambda functions. To see the metric data, update the code for a Lambda function and navigate to the CloudWatch console. Choose Metrics > All metrics from the left menu, the Custom namespace of LambdaEvents, and dimension of FunctionName (as set in the preceding metric filter). To see the data on the chart, check the box beside the metric of interest. The metric can be added to a CloudWatch dashboard under the Actions menu.
Metric filters only create metrics when a new log event is ingested. You must wait for a new log event to see the metrics.
Step 3: Visualizing
A CloudWatch dashboard enables the visualization of metric data and creation of customized views. The dashboard can contain multiple widgets with data from metrics, logs, and alarms.
The following dashboard shows an example of visualizing Lambda code updates alongside other performance data. There is no single visualization that is right for everyone. The data added to the dashboard depends on the questions and actions the business wants to take. This data can be varied and include performance data, KPIs, and user experience.
The dashboard displays data on Lambda function code updates and Lambda performance (duration). A metric line widget shows a time chart of Lambda function duration with the update Lambda code metric data. Duration is a performance metric that is provided for all Lambda functions. Read more in Working with Lambda Function metrics.
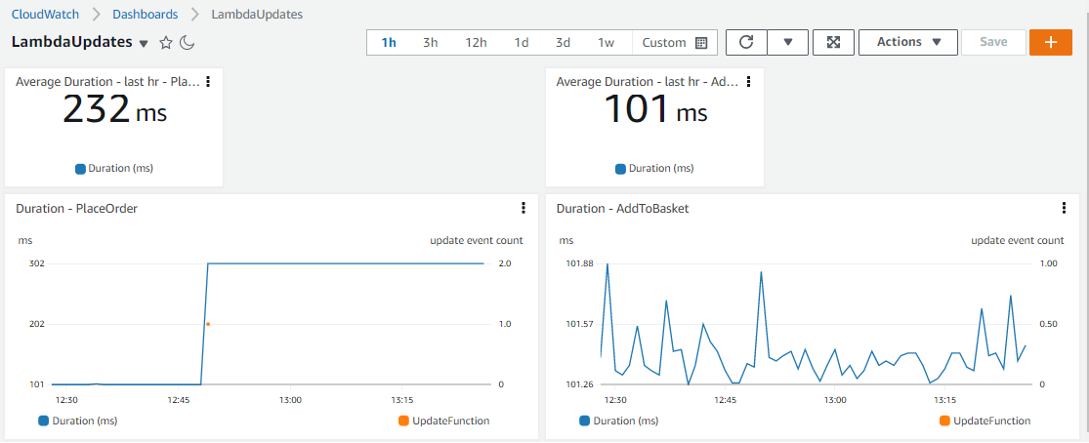
This screenshot shows the Lambda function duration for two different functions: PlaceOrder and AddToBasket. The duration for each function is represented in two ways:
- A single number showing the average duration in the last hour.
- A chart of the duration over time.
The Lambda function update event is shown on the duration time chart as an orange dot. The different views of duration show a high-level value and the detailed behavior over time. The detailed behavior is important to understanding the outcome. With only the high-level value, it is difficult to see if an increase in the hourly duration results from a short-term increase in duration, an upward trend, or a step change in behavior.
What is clear from this dashboard is that immediately following an update to the Lambda code, the PlaceOrder function duration dramatically increases from an average of ~100ms to ~300ms. This is a step change in behavior. The same deployment does not have the same impact on the duration of the AddToBasket function. While the duration is increasing near the end of the time period, it is less clear that this is because of the deployment. This dashboard provides awareness to the impact of the change at a function level so that the business can decide if the impact is acceptable.
Resources for creating your own dashboard
- Explore the default Lambda metrics that may be useful.
- Learn more about Creating and working with widgets on CloudWatch dashboards including the metric number widgets, the metric line (time chart) widgets, and the text widgets.
- Explore the dashboard section of the One Observability workshop for hands-on practice.
Conclusion
This blog demonstrates how to create an EventBridge rule and CloudWatch dashboard to visualize the impact of Lambda function code changes on performance data. First, an EventBridge rule is created to capture Lambda function code update events recorded in CloudTrail. EventBridge sends the event to CloudWatch where UpdateFunctionCode events are stored as a metric. The UpdateFunctionCode event data is visualized in a CloudWatch dashboard alongside Lambda performance data. This visibility enables teams to better understand the impact of code changes and make data-driven solutions.
You can modify the concepts in this blog and apply them to a wide variety of use cases. EventBridge can capture AWS CodeCommit and AWS CloudFormation deployments, and send the events to a CloudWatch dashboard to visualize alongside other metrics.
For more serverless learning resources, visit Serverless Land.
This post is written by Madhu Singh (Solutions Architect), and Krupanidhi Jay (Solutions Architect).
Lambda function URLs is a dedicated HTTPs endpoint for a AWS Lambda function. You can configure a function URL to have two methods of authentication: IAM and NONE. IAM authentication means that you are restricting access to the function URL (and in-turn access to invoke the Lambda function) to certain AWS principals (such as roles or users). Authentication type of NONE means that the Lambda function URL has no authentication and is open for anyone to invoke the function.
This blog shows how to use Lambda function URLs with an authentication type of NONE and use custom authorization logic as part of the function code, and to only allow requests that present valid Amazon Cognito credentials when invoking the function. You also learn ways to protect Lambda function URL against common security threats like DDoS using AWS WAF and Amazon CloudFront.
Lambda function URLs provides a simpler way to invoke your function using HTTP calls. However, it is not a replacement for Amazon API Gateway, which provides advanced features like request validation and rate throttling.
Solution overview
There are four core components in the example.
1. A Lambda function with function URLs enabled
At the core of the example is a Lambda function with the function URLs feature enabled with the authentication type of NONE. This function responds with a success message if a valid authorization code is passed during invocation. If not, it responds with a failure message.
2. Amazon Cognito User Pool
Amazon Cognito user pools enable user authentication on websites and mobile apps. You can also enable publicly accessible Login and Sign-Up pages in your applications using Amazon Cognito user pools’ feature called the hosted UI.
In this example, you use a user pool and the associated Hosted UI to enable user login and sign-up on the website used as entry point. This Lambda function validates the authorization code against this Amazon Cognito user pool.
3. CloudFront distribution using AWS WAF
CloudFront is a content delivery network (CDN) service that helps deliver content to end users with low latency, while also improving the security posture for your applications.
AWS WAF is a web application firewall that helps protect your web applications or APIs against common web exploits and bots and AWS Shield is a managed distributed denial of service (DDoS) protection service that safeguards applications running on AWS. AWS WAF inspects the incoming request according to the configured Web Access Control List (web ACL) rules.
Adding CloudFront in front of your Lambda function URL helps to cache content closer to the viewer, and activating AWS WAF and AWS Shield helps in increasing security posture against multiple types of attacks, including network and application layer DDoS attacks.
4. Public website that invokes the Lambda function
The example also creates a public website built on React JS and hosted in AWS Amplify as the entry point for the demo. This website works both in authenticated mode and in guest mode. For authentication, the website uses Amazon Cognito user pools hosted UI.
Solution architecture
This shows the architecture of the example and the information flow for user requests.

In the request flow:
- The entry point is the website hosted in AWS Amplify. In the home page, when you choose “sign in”, you are redirected to the Amazon Cognito hosted UI for the user pool.
- Upon successful login, Amazon Cognito returns the authorization code, which is stored as a cookie with the name “code”. The user is redirected back to the website, which has an “execute Lambda” button.
- When the user choose “execute Lambda”, the value from the “code” cookie is passed in the request body to the CloudFront distribution endpoint.
- The AWS WAF web ACL rules are configured to determine whether the request is originating from the US or Canada IP addresses and to determine if the request should be allowed to invoke Lambda function URL origin.
- Allowed requests are forwarded to the CloudFront distribution endpoint.
- CloudFront is configured to allow CORS headers and has the origin set to the Lambda function URL. The request that CloudFront receives is passed to the function URL.
- This invokes the Lambda function associated with the function URL, which validates the token.
- The function code does the following in order:
- Exchange the authorization code in the request body (passed as the event object to Lambda function) to access\_token using Amazon Cognito’s token endpoint (check the documentation for more details).
- Amazon Cognito user pool’s attributes like user pool URL, Client ID and Secret are retrieved from AWS Systems Manager Parameter Store (SSM Parameters).
- These values are stored in SSM Parameter Store at the time these resources are deployed via AWS CDK (see “how to deploy” section)
- The access token is then verified to determine its authenticity.
- If valid, the Lambda function returns a message stating user is authenticated as <username> and execution was successful.
- If either the authorization code was not present, for example, the user was in “guest mode” on the website, or the code is invalid or expired, the Lambda function returns a message stating that the user is not authorized to execute the function.
- Exchange the authorization code in the request body (passed as the event object to Lambda function) to access\_token using Amazon Cognito’s token endpoint (check the documentation for more details).
- The webpage displays the Lambda function return message as an alert.
Getting started
Pre-requisites:
Before deploying the solution, please follow the README from the GitHub repository and take the necessary steps to fulfill the pre-requisites.
Deploy the sample solution
1. From the code directory, download the dependencies:
$ npm install2. Start the deployment of the AWS resources required for the solution:
$ cdk deployNote:
- optionally pass in the –profile argument if needed
- The deployment can take up to 15 minutes
3. Once the deployment completes, the output looks similar to this:
Open the amplifyAppUrl from the output in your browser. This is the URL for the demo website. If you don’t see the “Welcome to Compute Blog” page, the Amplify app is still building, and the website is not available yet. Retry in a few minutes. This website works either in an authenticated or unauthenticated state.
Test the authenticated flow
- To test the authenticated flow, choose “Sign In”.

2. In the sign-in page, choose on sign-up (for the first time) and create a user name and password.
3. To use an existing an user name and password, enter those credentials and choose login.
4. Upon successful sign-in or sign up, you are redirected back to the webpage with “Execute Lambda” button.

5. Choose this button. In a few seconds, an alert pop-up shows the logged in user and that the Lambda execution is successful.
Testing the unauthenticated flow
1. To test the unauthenticated flow, from the Home page, choose “Continue”.

2. Choose “Execute Lambda” and in a few seconds, you see a message that you are not authorized to execute the Lambda function.

Testing the geo-block feature of AWS WAF
1. Access the website from a Region other than US or Canada. If you are physically in the US or Canada, you may use a VPN service to connect to a Region other than US or Canada.

2. Choose the “Execute Lambda” button. In the Network trace of browser, you can see the call to invoke Lambda function was blocked with Forbidden response.
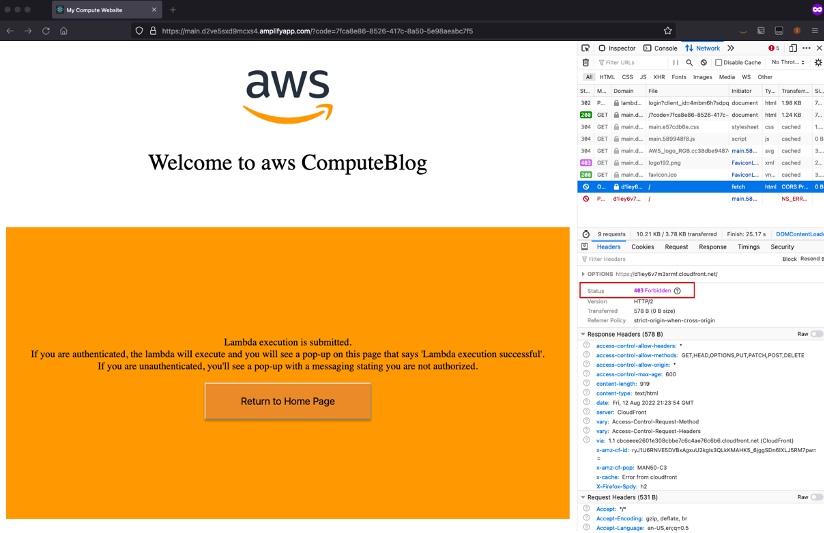
3. To try either the authenticated or unauthenticated flow again, choose “Return to Home Page” to go back to the home page with “Sign In” and “Continue” buttons.
Cleaning up
To delete the resources provisioned, run the cdk destroy command from the AWS CDK CLI.
Conclusion
In this blog, you create a Lambda function with function URLs enabled with NONE as the authentication type. You then implemented a custom authentication mechanism as part of your Lambda function code. You also increased the security of your Lambda function URL by setting it as Origin for the CloudFront distribution and using AWS WAF Geo and IP limiting rules for protection against common web threats, like DDoS.
For more serverless learning resources, visit Serverless Land.
Today the Serverless DA team is launching Serverlesspresso Extensions, a new program that lets you contribute to Serverlesspresso. The best extensions will be added to the Serverlesspresso application running in production and featured on the AWS Compute Blog.
What is Serverlesspresso?
Serverlesspresso is a multi-tenant event-driven serverless application for a pop-up coffee bar that allows you to order from your phone. In 2022, Serverlesspresso processed over 20,000 orders at technology events around the world. At this year’s re:Invent, it featured in the keynote of Amazon CTO, Dr Werner Vogels. It was showcased as an example of an event-driven application that can be easily evolved.
The architecture comprises several serverless apps and has been open-source and freely available since it was launched at re:Invent 2021.
What is extensibility?
Extensibility is the ability to add new functionality to an existing piece of software without modifying the core code already in place. Extensions for web browsers are an example of how useful extensibility can be. The core web browser code is not changed or affected when third parties write extensions, but end users can gain new, rich functionality not envisioned or intended by the original browser authors.
In many production business applications extensibility can help you keep up with the pace of your users requests. It allows you to create new and useful functionality without having to rearchitect the core, original part of your code. Choosing an architectural style that supports this concept can help you retain flexibility as your users needs change.
How EDA supports extensibility
Serverlesspresso is built on an event-driven architecture (EDA). This is an architecture style that uses events to decouple an application’s components. Event-driven architecture offers an effective way to create loosely coupled communication between microservices. This makes it a good architectural choice when you are designing workloads that will require extensibility.
Loosely coupled microservices are able to scale and fail independently, increasing the resilience of the application. Development teams can build and release features for their team’s microservice quickly, without needing to worry about the behavior of other microservices in the application. In addition, new features can be added on top of existing events without making changes to the rest of the application.
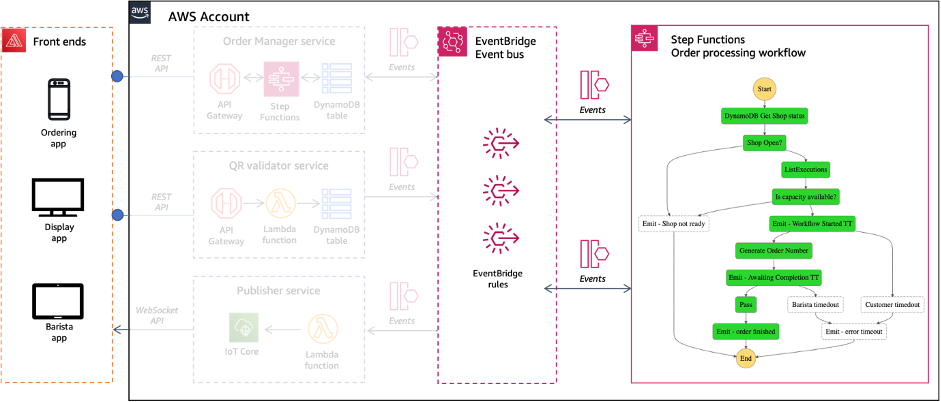
Choreography and orchestration are two different models for how distributed services can communicate with one another. In orchestration, communication is more tightly controlled. A central service coordinates the interaction and order in which services are invoked.
Choreography achieves communication without tight control. Events flow between services without any centralized coordination. Many applications, including Serverlesspresso use both choreography and orchestration for different use cases. Event buses such as Amazon EventBridge can be used for choreography, and workflow orchestration services like AWS Step Functions can help build for orchestration.
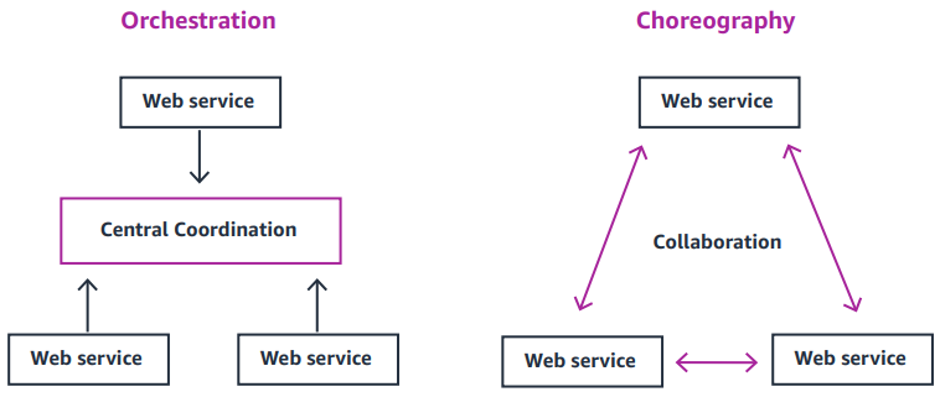
New functional requirements come up all the time in production applications. We can address new requirements for an event driven application by creating new rules for events in the Event Bus. These rules can add new functionality to the application without having any impact to the existing application stack.
Characteristics of a Serverlesspresso EDA extension
- Extension resources do not have permission to interact with resources outside the extension definition (including core app resources).
- Extensions must contain at least one new EventBridge rule that routes existing Serverlesspresso events.
- Extensions can be deployed and deleted independently of other extensions and the core application.
Building a Serverlesspresso extension
This section shows how to build an extension for Serverlesspresso that adds new functionality while remaining decoupled from the core application. Anyone can contribute an extension to Serverlesspresso. Use the Serverlesspresso extensions GitHub repository to host your extension:
- Complete the GitHub issue template:

- Clone the repository. Duplicate, and rename the example \_extension\_model directory.
- Add the associated extension template and source files.
- Add the required meta information to `README.md`.
- Make a pull request to the repository with the new extension files.
Additional guidance can be found in the repository’s PUBLISHING.md file.
Tools and resources to help you build
Event decoupling introduces a new set of challenges. Finding events and their schema can be a difficult process. Developers must coordinate with the team responsible for publishing an event, or look through documentation to find its schema, and then manually create an object for the event in order to use it in their code.
The Amazon EventBridge schema registry helps solve this challenge. It automatically finds events and their structure, or schema, and stores them in a shared central location. For serverlesspresso Extensions, we have created the Serverlesspresso events catalog, and filled it with events from the EventBridge schema registry. Here, all Serverlesspresso events have been documented to help you understand how to use them in your extensions. This includes the services that produce and consumer the event as well as example schemes for each event.
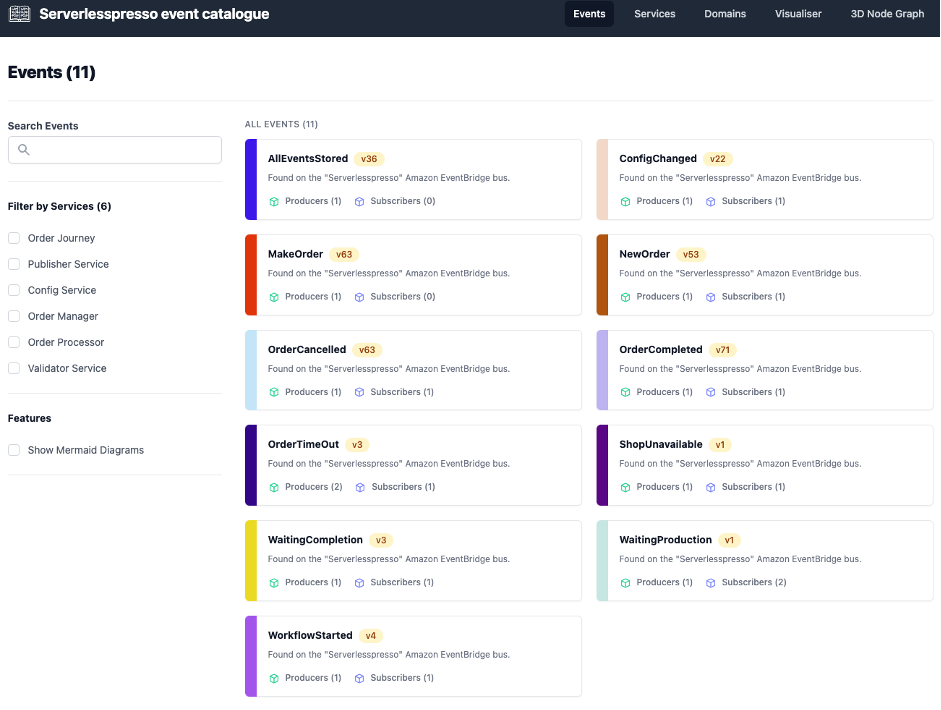
The event player
The event player is a Step Functions workflow that simulates 15 minutes of operation at the Serverlesspresso bar. It does this by replaying an array of realistic events. Use the event player to generate Serverlesspresso events, when building and testing your extensions. Each event is emitted onto an event bus named Serverlesspresso.
- Clone this repository:
git clone https://github.com/aws-samples/serverless-coffee.git - Change directory to the event player:
cd extensibility/EventPlayer - Deploy the EventPlayer using the AWS SAM CLI:
sam build and sam deploy --guided
This deploys a Step Functions workflow and a custom event bus called “Serverlesspresso”
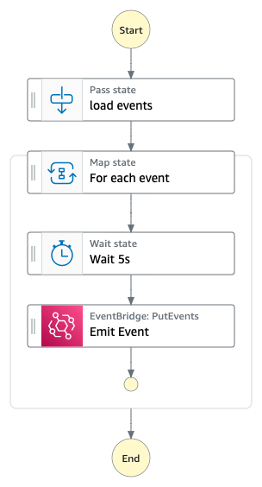
Running the events player
- Open the event player from the AWS Management Console.
- Choose Start execution, leave the default input payload and choose Start execution.
The player takes approximately 15 minutes to complete.
About your extension submission
Extensions will be reviewed by the Serverless DA team within 14 days of submission. When submitting your extension, your extension will become part of the open source offering and is covered by the existing license in the repo. It may be used by any customer under the same license. For additional guidance and ideas to help build your Serverlesspresso extensions, use the following resources:
- Learn more about Serverlesspresso!
- The serverlesspresso workshop
- What is Event driven Architecture
- Building next-gen applications with event-driven architectures
- Advanced serverless workflow patterns and best practices
Conclusion
You can now build extensions for Serverlesspresso, and potentially be featured on the AWS Compute Blog by submitting a Serverlesspresso extension. The best extensions will be added to Serverlesspresso in production.
Some demo extensions have been built and documented at https://github.com/aws-samples/serverless-coffee/tree/main/extensions. You can download and install these extensions to see how they are constructed before creating your own.
Visit the Serverless Workflows Collection to browse the many deployable workflows to help build your serverless applications.
This blog post is written by Joe Sacco, Senior Technical Account Manager. The AWS Global Cloud Infrastructure includes 30 Launched Regions, 96 Availability Zones (AZs), 410+ Points of Presence with 400+ Edge Locations, and 13 Regional Edge Caches. With over 200 AWS services, most customer workloads can run in the AWS Regions. However, for some […]
This post is written by Luca Mezzalira, Principal Specialist Solutions Architect. Today, AWS is launching a preview of AWS Application Composer, a visual designer that you can use to build your serverless applications from multiple AWS services. In distributed systems, empowering teams is a cultural shift needed for enabling developers to help translate business capabilities […]
This blog post is written by Jack Chen, Telco Solutions Architect, and Robert Belson, Developer Advocate. AWS Wavelength embeds AWS compute and storage services within 5G networks, providing mobile edge computing infrastructure for developing, deploying, and scaling ultra-low-latency applications. AWS recently introduced support for Application Load Balancer (ALB) in AWS Wavelength zones. Although ALB addresses […]
The AWS Serverless Learning Plan and digital badge are available now. All courses are available on-demand. Both the learning plan courses and the assessment are free for everyone.
Written by Mark Sailes, Senior Serverless Solutions Architect, AWS. At AWS re:Invent 2022, AWS announced SnapStart for AWS Lambda functions running on Java Corretto 11. This feature enables customers to achieve up to 10x faster function startup performance for Java functions, at no additional cost, and typically with minimal or no code changes. Overview Today, […]
This blog written by Tarun Rai Madan, Sr. Product Manager, AWS Lambda, Mike Danilov, Sr. Principal Engineer, AWS Lambda, and Colm MacCárthaigh, VP/Distinguished Engineer, EC2. AWS Lambda SnapStart is a new performance optimization developed by AWS that can significantly improve the startup time for applications. Announced at AWS re:Invent 2022, the first capability to feature […]
This post is written by Adam Imeson, Sr. Hybrid Edge Specialist Solutions Architect. AWS Outposts rack is a fully-managed service that offers the same AWS infrastructure, APIs, tools, and a subset of AWS services to any data center, colocation space, or on-premises facility for a consistent hybrid experience. Outposts rack is ideal for workloads that […]
This post is written by Prachi Sharma (Software Development Manager, Amazon SNS), Mithun Mallick (Principal Solutions Architect, AWS Integration Services), and Otavio Ferreira (Sr. Software Development Manager, Amazon SNS). Amazon Simple Notification Service (SNS) is a messaging service for Application-to-Application (A2A) and Application-to-Person (A2P) communication. The A2A functionality provides high-throughput, push-based, many-to-many messaging between distributed […]
This blog post is written by Shruti Koparkar, Senior Product Marketing Manager, Amazon EC2. AWS re:Invent is the most transformative event in cloud computing and it is starting on November 28, 2022. AWS Compute team has many exciting sessions planned for you covering everything from foundational content, to technology deep dives, customer stories, and even […]
During the last few weeks, the AWS serverless team has been releasing a wave of new features in the build-up to AWS re:Invent 2022. This post recaps some of the most important releases for serverless developers building event-driven applications. AWS Lambda Lambda Support for Node.js 18 You can now develop Lambda functions using the Node.js 18 […]
This post is written by Uma Ramadoss (Senior Specialist Solutions Architect), and Jeetendra Vaidya (Senior Solutions Architect). Today, AWS is announcing the availability of container, database, and queue utilization metrics for Amazon Managed Workflows for Apache Airflow (Amazon MWAA). This is a new collection of metrics published by Amazon MWAA in addition to existing Apache […]
Caching data retrieved from external services is an effective way to improve the performance of your Lambda function and reduce costs. Implementing a caching layer has been made simpler with this AWS-managed Lambda extension.
This post demonstrates how to create a Step Functions Express Workflow in one account and call it from a Step Functions Standard Workflow in another account using a new credentials capability of AWS Step Functions.
Node.js 18 is now supported by Lambda. When building your Lambda functions using the zip archive packaging style, use a runtime parameter value of nodejs18.x to get started building with Node.js 18.
This post is written by Vikas Panghal (Principal Product Manager), and Hardik Vasa (Senior Solutions Architect). Amazon Simple Queue Service (SQS) is a fully managed message queuing service that makes it easier to decouple and scale microservices, distributed systems, and serverless applications. SQS queues enable asynchronous communication between different application components and ensure that each of these […]
AWS now supports .NET 7 native AOT on Lambda. Read the Lambda Developer Guide for more getting started information. For more details on the performance improvements from using .NET 7 native AOT on Lambda, see the serverless-dotnet-demo repository on GitHub.
This blog post is written by Jagdeep Phoolkumar, Senior Specialist Solution Architect, Flexible Compute and Peter Manastyrny, Senior Product Manager Tech, EC2 Core. Amazon EC2 Spot Instances are unused Amazon Elastic Compute Cloud (Amazon EC2) capacity in the AWS Cloud available at up to a 90% discount compared to On-Demand prices. One of the best […]
This blog post was written by, Antoine Awad, Solutions Architect, Kevin Taylor, Senior Solutions Architect and Joel Desaulniers, Senior Solutions Architect. Machine Learning (ML) models are used for inferencing of highly sensitive data in many industries such as government, healthcare, financial, and pharmaceutical. These industries require tools and services that protect their data in transit, […]
This post is written by Suresh Poopandi, Senior Solutions Architect and Seb Kasprzak, Senior Solutions Architect. Today, AWS is announcing the public preview of AWS Serverless Application Model CLI (AWS SAM CLI) support for local development, testing, and debugging of serverless applications defined using HashiCorp Terraform configuration. AWS SAM and Terraform are open-source frameworks for […]
Today, we are announcing Amazon EventBridge Scheduler. This is a new capability from Amazon EventBridge that allows you to create, run, and manage scheduled tasks at scale. With EventBridge Scheduler, you can schedule one-time or recurrently tens of millions of tasks across many AWS services without provisioning or managing underlying infrastructure. Previously, many customers used […]
This blog post is written by Anton Aleksandrov, Principal Solution Architect and Shridhar Pandey, Senior Product Manager Today AWS is announcing the AWS Lambda Telemetry API. This provides an easier way to receive enhanced function telemetry directly from the Lambda service and send it to custom destinations. Developers and operators can now more easily monitor and […]
This blog is written by Rajesh Kesaraju, Sr. Solution Architect, EC2-Flexible Compute and Peter Manastyrny, Sr. Product Manager, EC2. Today AWS is adding two new attributes for the attribute-based instance type selection (ABS) feature to make it even easier to create and manage instance type flexible configurations on Amazon EC2. The new network bandwidth attribute […]
This post shows how you can create rules in EventBridge to react to operational events from AWS services. These events are routed to Step Functions, which runs a workflow consisting of steps to enrich the event, handle errors, and emit the enriched event. The example shows how to consume the enriched events, resulting in an operator receiving an email.
This first post starts the journey into micro-frontends, a distributed architecture for frontend applications. The next post will explore the UI composer and micro-frontends discovery implementations.
This blog post is written by Rachel Rui Liu, Senior Solutions Architect. AWS Local Zones are a type of infrastructure deployment that places compute, storage, database, and other select AWS services close to large population and industry centers. Following the successful launch of the AWS Local Zones in 16 US cities since 2019, in Feb 2022, AWS […]
This post is written by Michael Havey, Senior Specialist Solutions Architect, AWS This post shows how to model a Unified Modeling Language (UML) state machine as an AWS Step Functions workflow. A UML state machine models the behavior of an object, naming each of its possible resting states and specifying how it moves from one […]
AWS re:Invent 2022 is only a few weeks away, featuring an exciting slate of sessions on Serverless and Application Integration. This post highlights many of the sessions we are hosting on Serverless and Application Integration. It groups sessions by theme to help you quickly find the sessions most interesting to you.
This blog written by Omkar Deshmane, Senior SA and Anton Aleksandrov, Principal SA, Serverless. This blog shows how to use Amazon API Gateway with a custom authorizer to process incoming requests, validate the mTLS client certificate, extract the client certificate subject, and propagate it to the downstream application in a base64 encoded HTTP header. This […]
This blog post is written by, Glenn Chia Jin Wee, Associate Cloud Architect, and Randall Han, Professional Services. You may be required to manually validate the Amazon Machine Image (AMI) built from an Amazon Elastic Compute Cloud (Amazon EC2) Image Builder pipeline before sharing this AMI to other AWS accounts or to an AWS organization. […]
This post written by Kurt Tometich, Senior Solutions Architect, AWS. Developers have been using the AWS Serverless Application Model (AWS SAM) to streamline the development of serverless applications with AWS since late 2018. Besides making it easier to create, build, test, and deploy serverless applications, AWS SAM now further simplifies permission management between serverless components […]
This blog post is written by Shiv Bhatt, Manthan Raval, and Pawan Matta, who are Senior Solutions Architects with AWS. Many industries are subject to regulations that are created to protect the interests of the various stakeholders. For some industries, the specific details of the regulatory requirements influence not only the organization’s operations, but also […]
SQS now provides server-side encryption (SSE) using SQS-owned encryption (SSE-SQS) by default. This enhancement makes it easier to create SQS queues, while greatly reducing the operational burden and complexity involved in protecting data.
Welcome to the 19th edition of the AWS Serverless ICYMI (in case you missed it) quarterly recap. Every quarter, we share all the most recent product launches, feature enhancements, blog posts, webinars, Twitch live streams, and other interesting things that you might have missed! In case you missed our last ICYMI, check out what happened […]
This post is written by Mansi Y Doshi, Consultant and Aditya Goteti, Sr. Lead Consultant. Enterprises are modernizing and migrating their applications to the AWS Cloud to improve scalability, reduce cost, innovate, and reduce time to market new features. Legacy applications are often built with RDBMS as the only backend solution. Modernizing legacy Java applications […]
This post is written by Leonardo Solano, Senior Hybrid Cloud Solution Architect and Chris Lunsford, Senior Specialist Solutions Architect, AWS Outposts. AWS Outposts lets customers use the same Amazon Virtual Private Cloud (VPC) security mechanisms, such as security groups and network access control lists, to control traffic flows for on-premises applications running on Outposts. Some […]
In part 1, you learn if it is possible to migrate a non-serverless web application to a serverless environment without changing much code. You learn different tools that can help you in this process, like Lambda Web Adaptor and AWS Amplify. By the end, you have migrated an application into a serverless environment. However, if […]
Customers migrating to the cloud often want to get the benefits of serverless architecture. But what is the best approach and is it possible? There are many strategies to do a migration, but lift and shift is often the fastest way to get to production with the migrated workload. You might also wonder if it’s […]
This post shows how message data protection enables a topic owner to discover and protect sensitive data that is exchanged through SNS topics. The example shows how to create a data protection policy that generates audit reports for sensitive data and blocks messages from delivery to specific subscribers if the payload contains sensitive data.
Developers use AWS Step Functions, a low-code visual workflow service to build distributed applications, automate IT and business processes, and orchestrate AWS services with minimal code. Step Functions Amazon States Language (ASL) provides a set of functions known as intrinsics that perform basic data transformations. Customers have asked for additional intrinsics to perform more data […]
Builders create AWS Step Functions workflows to orchestrate multiple services into business-critical applications with minimal code. Customers are looking for best practices and guidelines to build cost-effective workflows with Step Functions. This blog post explains the difference between Standard and Express Workflows. It shows the cost of running the same workload as Express or Standard […]
This blog post shows how AWS Controllers for Kubernetes enables you to deploy a Lambda function directly from your Amazon EKS environment. AWS Controllers for Kubernetes provides a convenient way to connect your Kubernetes applications to AWS services directly from Kubernetes.
This blog post is written by, Sudhi Bhat, Senior Specialist SA, Flexible Compute. Amazon EC2 Spot Instances are one of the popular choices among customers looking to cost optimize their workload running on AWS. Spot Instances let you take advantage of unused Amazon Elastic Compute Cloud (Amazon EC2) capacity in the AWS cloud and are […]
This blog written by Jeff Marcinko, Sr. Technical Account Manager, Health Care & Life Sciencesand Brian Zambrano, Sr. Specialist Solutions Architect, Serverless. Developers and operators have been using the AWS Serverless Application Model (AWS SAM) to author, build, test, and deploy serverless applications in AWS for over three years. Since its inception, the AWS SAM […]
This post shows how to use the new custom consumer group ID feature of the Lambda event source mapping for Amazon MSK and self-managed Kafka. This feature can be used to consume messages with Lambda starting at a specific timestamp or offset within a Kafka topic. It can also be used to consume messages from a consumer group that is replicated from another Kafka cluster using MirrorMaker v2.
This blog shows how to act on changes to your Salesforce data in real-time using the new Salesforce partner event source integration with EventBridge. The example demonstrated how your Salesforce data can be processed and enriched with custom AWS applications and updates sent back to Salesforce using EventBridge API Destinations.
Today, the AWS Serverless Developer Advocate team introduces the Serverless Snippets Collection. This is a new page hosted on Serverless Land that makes it easier to discover, copy, and share common code that can help with serverless application development. Builders are writing serverless applications in many programming languages and spend a growing amount of time […]
When building serverless applications using AWS Lambda, there are a number of considerations regarding security, governance, and compliance. This post highlights how Lambda, as a serverless service, simplifies cloud security and compliance so you can concentrate on your business logic. It covers controls that you can implement for your Lambda workloads to ensure that your […]
You can use Lambda functions to handle fully managed asynchronous processing of SQS messages. Estimating the cost and optimal setup depends on leveraging the various configurations of SQS and Lambda functions. The cost estimator tool presented in this blog should help you understand these configurations and their impact on the overall cost and performance of the Lambda function-based messaging solutions.
This blog post is written by, Gabriele Postorino, Senior Technical Account Manager, and Giorgio Bonfiglio, Principal Technical Account Manager In this post, we’ll discuss how you can prepare for planned and unplanned scaling events with Amazon Elastic Compute Cloud (Amazon EC2), and make sure that your infrastructure is ready to sustain increased compute power requirements. […]
AWS Lambda functions often need to access secrets, such as certificates, API keys, or database passwords. Storing secrets outside the function code in an external secrets manager helps to avoid exposing secrets in application source code. Using a secrets manager also allows you to audit and control access, and can help with secret rotation. Do […]
This blog post is written by Heeki Park, Principal Solutions Architect, Serverless. AWS Lambda charges for on-demand function invocations based on two primary parameters: invocation requests and compute duration, measured in GB-seconds. If you configure additional ephemeral storage for your function, Lambda also charges for ephemeral storage duration, measured in GB-seconds. AWS continues to find […]
This blog post is written by Yashlin Naidoo, Arnav Thakur, Kim Read, Guilherme Silva. Amazon SNS enables you to send notifications to a mobile push endpoint using a platform application endpoint by dispatching the notification on your application’s behalf. Push notifications for iOS apps are sent using Apple Push Notification Service (APNs). To send push […]
In this blog post, you learn how to run external transactions securely on Db2 for IBM i databases using a combination of Amazon ECR and AWS Lambda. By using Docker to package the driver, forwarder, and custom queries, you can execute transactions from Lambda, allowing modern architectures to interface directly with Db2 workloads. Get started by cloning the GitHub repository and following the deployment instructions.
This conversion example shows how Step Functions can help you rewrite complex batch processes written in JCL to serverless workflows. It also shows how such a conversion provides maintenance and monitoring features that make it easier to simplify and scale these batch processes.
This blog post is written by Chris McPeek, Principal Solutions Architect. AWS Lambda now supports attribute-based access control (ABAC), allowing you to control access to Lambda functions within AWS Identity and Access Management (IAM) using tags. With ABAC, you can scale an access control strategy by setting granular permissions with tags without requiring permissions updates […]
This blog post is written by, Frankie Negro, Outposts Solution Architect. AWS Outposts is a family of fully managed solutions that extend AWS infrastructure, services, APIs, and tools to customer premises. Outposts is available in a variety of form factors, from 1U and 2U Outposts servers (https://aws.amazon.com/outposts/servers/) to 42U Outposts racks (https://aws.amazon.com/outposts/rack/). AWS Outposts is […]
This blog post is written by Mark Richman, Senior Solutions Architect. Today, AWS is launching a new capability to integrate the Amazon CodeWhisperer experience with the AWS Lambda console code editor. Amazon CodeWhisperer is a machine learning (ML)–powered service that helps improve developer productivity. It generates code recommendations based on their code comments written in […]
AWS Lambda provides a serverless compute service that can scale from a single request to hundreds of thousands per second. When designing your application, especially for high load, it helps to understand how Lambda handles scaling and throughput. There are two components to consider: concurrency and transactions/requests per second. Concurrency of a system is the […]