Amazon OpenSearch Ingestion is a serverless, auto-scaled, managed data collector that receives, transforms, and delivers data to Amazon OpenSearch Service domains or Amazon OpenSearch Serverless collections. OpenSearch Ingestion is powered by Data Prepper, an open-source, streaming ETL (extract, transform, and load) solution that’s part of the OpenSearch project. When you use OpenSearch Ingestion, you don’t need to maintain self-managed data pipelines to ingest logs, traces, metrics, and other data with OpenSearch Service. Amazon OpenSearch Ingestion responds to changing volumes of data, automatically scaling your ingest pipeline.
Distributed tracing is the leading way to locate, alert on, and remediate problems with your application and infrastructure. Distributed tracing is part of a broader observability solution, often combined with metrics and log data. OpenSearch Service gives you a native toolset to store and analyze large volumes of log, metric, and trace data. However, moving these large volumes of data is non-trivial to set up, monitor, and maintain.
In this post, we outline steps to set up a trace pipeline and strategies to deal with high volume tracing with Amazon OpenSearch Ingestion.
Solution overview
There is now a new option on the OpenSearch Service console called Pipelines under Ingestion in the navigation pane. We use this feature to create a trace pipeline.

You can also use the AWS Command Line Interface (AWS CLI), AWS CloudFormation, or AWS APIs to create a trace pipeline.
Prerequisites
Refer to Security in OpenSearch Ingestion to set up the permissions you need to create a pipeline and write to a pipeline, and the permissions the pipeline needs to write to a sink.
Create a trace pipeline
To create a trace pipeline, complete the following steps:
- On the OpenSearch Service console, choose Pipelines under Ingestion in the navigation pane.
- Choose Create pipeline.

Amazon OpenSearch Ingestion, powered by Data Prepper, uses pipelines as a mechanism to move the data from a source to a sink, with optional processors to mutate, route, sample, and detect anomalies for the data in the pipe. For more information, refer to Data Prepper. When you use Data Prepper, you build a YAML configuration file. When you use OpenSearch Ingestion, you upload your YAML configuration to the service. If you’re using the OpenSearch Service console, you can use one of the configuration blueprints that we provide. For distributed tracing, you will use an otel\_trace\_source and an OpenSearch Service domain as the sink.
- On the Configuration blueprints menu, choose AWS-TraceAnalyticsPipeline.

Choosing this blueprint will create a sample pipeline with otel\_trace\_source, an OpenSearch sink, along with span-pipeline and service-map-pipeline.
- Enter a name for this pipeline along with a minimum (1) and maximum (96) capacity value for Ingestion-OCUs.
Amazon OpenSearch Ingestion will scale automatically between these values to suit the volume of data you are ingesting.
- Edit the configuration’s
hosts,aws.sts\_role\_arn, andregionfields of the OpenSearch Service sink. - Follow rest of the steps to complete the trace pipeline creation.
Sample trace pipeline
The following code shows the components of a sample trace pipeline:
The sample trace pipeline has three sub-pipelines in its configuration. These are entry-pipeline, span-pipeline, and service-map-pipeline. The following diagram illustrates the workflow.
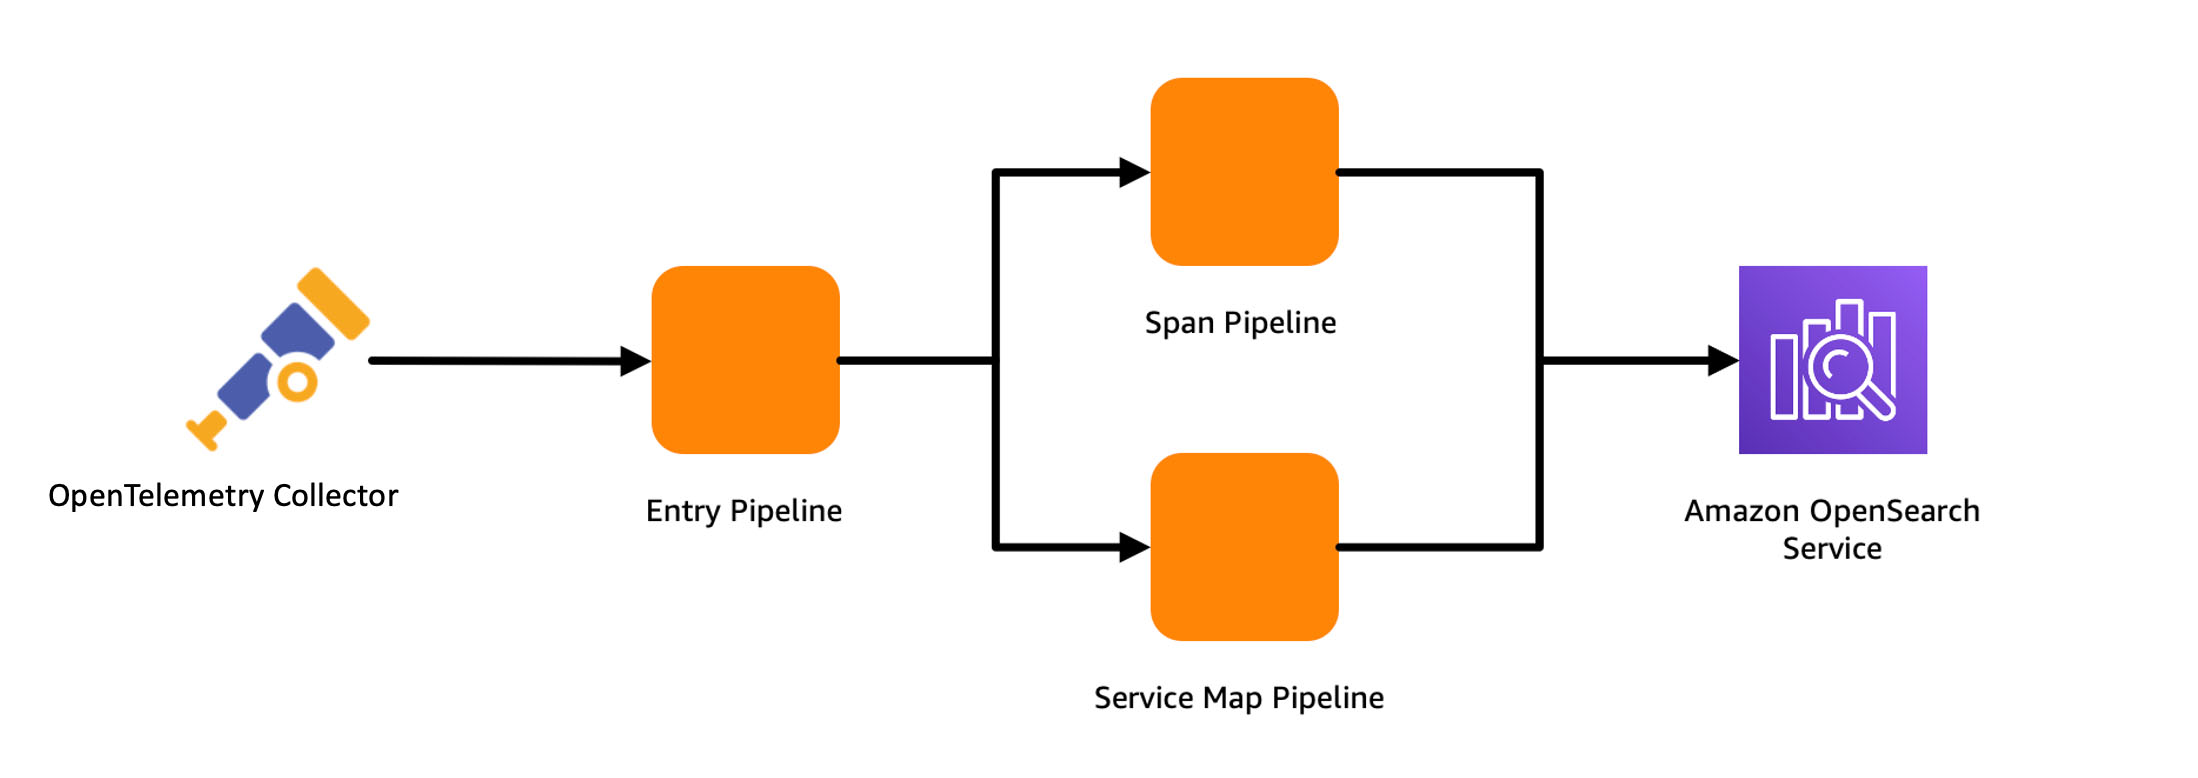
entry-pipeline specifies the source of data as otel\_trace\_source, which creates an HTTP listener for receiving OpenTelemetry traces at the ingestion URL for the pipeline. You use a trace\_peer\_forwarder processor to eliminate duplicate HTTP requests and forward the data to the span-pipeline and service-map pipelines. span-pipeline gets the raw trace data from entry-pipeline and uses the otel\_trace\_raw processor to complete trace group-related fields for the incoming span records. You use the service\_map\_stateful processor to have Data Prepper create the distributed service map for visualization in OpenSearch Dashboards. After the sample trace pipeline is created, it’s ready to receive OpenTelemetry traces at its ingestion URL!
Reduce your storage footprint and optimize for cost
The volume of traces collected from instrumenting a modern production enterprise application can reach tens or hundreds of terabytes very quickly, especially when you store every trace from every request. The problem of managing the storage footprint becomes important. In this section, we discuss strategies for reducing your storage footprint and optimizing for cost.
Use storage tiering
OpenSearch Service has three storage tiers: hot, UltraWarm, and cold. You use the hot tier to store frequently accessed data for quick reading and writing, the UltraWarm tier for infrequently used, read-only data backed by Amazon Simple Storage Service (Amazon S3) for lower cost, and the cold tier to maintain re-attachable data at near-Amazon S3 cost. By adjusting relative retention periods between these tiers, you can store a high volume of traces. For example, instead of storing 1 weeks’ worth of traces in the hot tier, you can store 2 days of traces in the hot tier and 15 days in the UltraWarm tier.
Extract metrics without storing traces
You can also use Data Prepper’s aggregation process to extract metrics in the pipeline to avoid delivering all of your data to OpenSearch Service. For example, you may want to analyze request, error, and duration (RED) metrics of your traces to know the current state of your services. OpenSearch Ingestion can calculate these metrics in the pipeline, aggregating them and storing them in separate indexes for analysis, reducing the ingestion and storage footprint of your traces. The following pipeline configuration snippet shows how to use the aggregate processor to calculate a histogram of the duration metric:
Use sampling
When your application is running without issues, the proportion of error traces is just a small percentage of your overall trace volume. Storing all of the traces for successful requests increases the cost substantially, while offering low value. To reduce cost, you can sample your trace data, reducing the number of traces you store in OpenSearch Service. There are generally two techniques for sampling:
- Head sampling – When you do head sampling, you ask OpenSearch Ingestion to make a sampling decision without looking at the whole trace. Head sampling is easy to configure and is efficient, but has a downside of possibly missing important traces.
- Tail sampling – Tail sampling is where you analyze the entirety of the trace and then decide whether to sample the trace or not. This accurately captures all the needed traces at the cost of complexity in configuring and implementing.
The following configuration snippet shows an example of the percent\_sampler, from the aggregate processor. In this example, you send only 25% of your traces to OpenSearch Service, based on head sampling:
Use conditional routing with sampling
Head sampling using the percentage\_sampler is simple and straightforward, but is a blunt tool. A better way to sample would be to gather, for example, 10% of successful responses, and 100% of failed responses or 100% high duration traces. To solve this, use conditional routing. Routes define conditions that can be used within processors and sinks to direct the data flowing through different parts of pipeline. For example, the following configuration snippet routes traces whose status code indicates a failure to the error\_trace pipeline. You forward 100% of the data in that pipe. You route traces whose duration metric is more than 1 second to the high\_latency pipeline where you sample them at 80%. Other normal traces are only sampled at 20%.
Conclusion
In this post, you learned how to configure an OpenSearch Ingestion pipeline and several strategies to keep in mind that help minimize cost while supporting a large-scale production system for distributed tracing. As next step, refer to the Amazon OpenSearch Developer Guide to explore logs and metric pipelines that you can use to build a scalable observability solution for your enterprise applications.
About the author
 Muthu Pitchaimani is a Search Specialist with Amazon OpenSearch Service. He builds large-scale search applications and solutions. Muthu is interested in the topics of networking and security, and is based out of Austin, Texas.